Formation Evaluation of ‘J Field’, Niger Delta Using Well Log
Data
Joseph Oyebamiji* Oluwatoyin Oluwadare
Department of Applied Geophysics, Federal University of Technology, Akure, Ondo State Nigeria Abstract
Wireline logs from three (3) wells, 1, 2 and 3 were used to quantitatively evaluate the ‘J field’ of the Niger Delta area. The wells had been evaluated using a combination of Gamma-ray log, Resistivity logs and Neutron – Density logs. Wireline log analysis was used in the reservoir evaluation of the ‘J field’; the hydrocarbon sands were delineated by the use of gamma ray, resistivity and density/neutron from which the reservoir prospectivity were determined. Well 1 has 4 reservoirs, well 2 has 4 reservoirs and well 3 has 4 reservoirs, the reservoirs are namely (A, B, C, D) .This investigation helps to identify the lithologies and recognize the hydrocarbon bearing intervals as – well as to quantify the amount/type of hydrocarbon in the reservoirs contained in wells 1, 2, 3) for further exploration and exploitation in the ‘J field’ of the Niger Delta. The petrophysical properties of the reservoirs analyzed include: water saturation for wells 1, 2 and 3 ranging from (0.13– 0.26) %, (0.16 – 0.37) % and (0 – 0.41) %, porosity values; (18 –23) %, (14 – 20) % and (18 – 23) %, hydrocarbon saturation for the wells are; (0.74 – 0.86) %, (0.63 – 0.84) % and (0 – 0.59) % respectively. The net pay thickness for well 1 is 39.88 metres, well 2 is 53.4 metres and well 3 is 53.9 metres. The analysis of the wells depict the presence of hydrocarbons in well 1 and well 2, with only one reservoir (D) in well 3 indicating the presence of hydrocarbon.
Keywords: (Hydrocarbon, Well logs, Reservoir and Volumetric Analysis) DOI: 10.7176/JEES/10-2-05
Publication date: February 29th 2020
Introduction
The investigation of wells/boreholes, using various instruments and techniques (depending on the well /borehole environment) and specific parameters being sought for, is known as Geophysical Well Logging or Borehole Geophysics. The subsurface geologic investigation with the use of wireline geophysical well logs has progressed over the years and has thus become a standard of operation in petroleum exploration. With the integration of exploration results from gravity, magnetic and seismic geophysical prospecting methods, favorable geological conditions for hydrocarbon accumulation may be identified. Exploratory wells are drilled into the prospective structure to evaluate the prospect. This is called Formation Evaluation. It is the process of using information obtained from borehole to determine the physical and chemical properties of subsurface rocks and their fluid content along the borehole (Figure 1.1). It involves the analysis and interpretation of well-log data, drill-stem tests, cores, drill cuttings, etc. Petrophysics is a term used to express the physical and chemical properties of rocks which are related to pore and fluid distributions, particularly as they pertain to detection and evaluation of hydrocarbon bearing layers, (Archie, 1950). Petrophysics pertains to the science of measuring rock properties and establishing the relationships between these properties. It is related to petrology as much as geophysics is related to geology. Petrophysics is an important tool in hydrocarbon exploration. Its use in hydrocarbon prospecting involves well drilling and formation evaluation. The measurements are displayed as a set of continuous curves called Log, from which hydrocarbon reservoirs can be identified and reservoir parameters such as porosity, water saturation, hydrocarbon saturation and reservoir thickness can be estimated. These parameters will help in the estimation of hydrocarbon in place.
The propertied of a formation can be estimated from well log measurements include lithology, bed thickness, porosity, permeability and the portion of water and hydrocarbon occupying the pore spaces.
Study Area and Geology
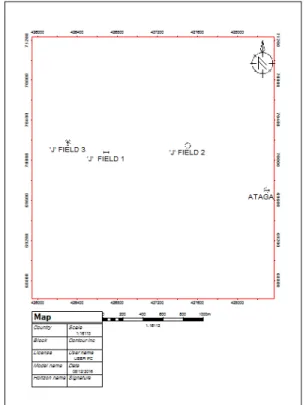
The ‘J’ Field is an onshore oil field in the Niger Delta region, located in the southern part of Nigeria (Figure 1). Niger Delta according to Klett et al. (1997) is situated within the Gulf of Guinea with extension throughout the Niger Delta Province. The Niger Delta province is made up of one known petroleum system – the Tertiary Niger Delta (Agbada - Akata) petroleum system. The maximum extent of the petroleum system coincides with the boundaries of the province (Fig 2.1). The minimum extent of the system is defined by the areal extent of fields and contains known resources (cumulative production plus proved reserves) of 34.5 billion barrels of oil (BBO) and 93.8 trillion cubic feet of gas (TCFG). The primary source rock is the upper Akata Formation, the marine- shale facies of the delta, with possibly contribution from interbedded marine shale of the lowermost Agbada Formation. Oil is produced from sandstone facies within the Agbada formation. However, turbidite sand in the upper Akata Formation is a potential target in deep water offshore and possibly beneath currently producing intervals onshore.
Niger Delta province is the twelfth richest in petroleum resources, with 2.2% of the world’s discovered oil and 1.4% of the world’s discovered gas (Petroconsultants, 1996).
Figure 1: Base Map of the Study Area Showing Wells location Methodology
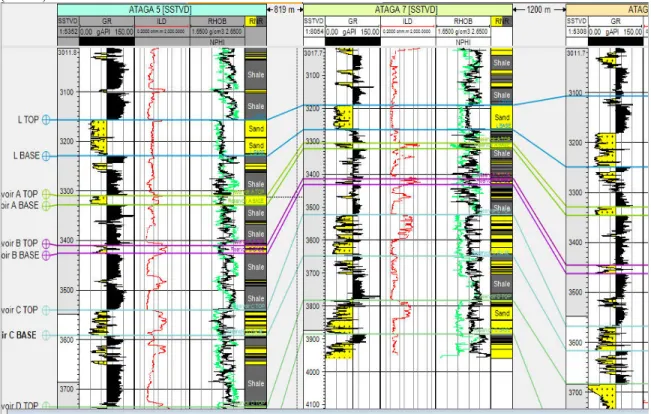
Three exploratory wells were evaluated qualitatively and quantitatively in the ’J’ oil field, Niger Delta Nigeria. The evaluation and its interpretation was done for each well, with the use of fundamental petrophysical equations, based on a suite of wireline logging technology that is runned in each of the wells. The method of study involved the application of empirical petrophysical formulas for the petrophysical evaluation. Hydrocarbon bearing reservoirs were identified and their petrophysical parameters were evaluated. Reservoir formations that are 100% water charged were left out without being evaluated. The identified hydrocarbon-bearing reservoirs were correlated across the three wells in the field (Figure 2), to determine their lateral continuity and vertical extent. This was achieved by the integration of gamma ray, resistivity, density and compensated neutron (also known as neutron porosity hydrogen index) logs. The lithologies of the three wells are identified and correlated, using gamma ray and resistivity logs. Shale bed was used as the reference datum for the correlation. The petrophysical
parameters that were evaluated by this project work are; Resistivity of Formation Water (RW), True
Formation Resistivity (Rt), Gamma Ray Index (IGR),Volume of Shale (VSh), Net to Gross (NTG) Porosity (Ø),
Formation Factor (F),Water Saturation (SW),Hydrocarbon Saturation (Sh), Irreducible Water Saturation (SW
irr),Permeability (K),Hydrocarbon Pore Volume (HCPV).
Results and Discussion
The reservoir in the wells were correlated and the results of the qualitative and quantitative interpretation of the delineated reservoirs from ‘J’ Field were presented as Tables showing the computed petrophysical parameter. Reservoir A
The reservoir is penetrated at depth (3309.06 – 3327.11m), (3306.28 – 332241m) and (3327 – 3346.25m) by wells 1, 2 and 3 respectively. It is characterized by an average net thickness of 13.8m, with a percentage net sand to gross reservoir thickness of (77 %), (81 %) and (78 %) in the three wells respectively. The reservoir in well 1 is characterized by porosity and permeability values typical of sandstone reservoir with permeability values of (33.4md) and porosity value of 23 %. The reservoir has an average volume of shale (Vsh) of 31 % and average porosity (Ø) of 18.3 % . Also the well 1 has a high value of hydrocarbon pore volume 20.7 % which is expected
hydrocarbon saturation, good transmissivity with respect to oil ( k, kro, ko) and high hydrocarbon pore volume (HCPV) in the field.
Figure 2: Correlation of the three wells Reservoir B
The reservoir is penetrated at depths (3410.06 – 3425.85 m) , (3418.36 – 3431.09 m) and (3446.30 – 3462 m) by wells 1, 2 and 3 respectively. It is characterized by an average net sand thickness of 10.1m with high percentage net sand to gross reservoir thickness of (81 %) , (53 %) and (68 %) in the three wells respectively. Well 1 has a good porosity of 18 % and hydrocarbon saturation of 86 % while its water saturation is 14 %. The hydrocarbon pore volume is about 15.4 % which confirms the presence of hydrocarbon. It is significantly marked by high permeability of (85.2 md) . Well 2 has a good porosity of 20 % and hydrocarbon saturation of 84) % , while its water saturation is 16 % . It hydrocarbon pore volume is about 20.5 % which confirms the presence of hydrocarbon. It is significantly marked by high permeability of (19.7 md) .
Reservoir C
The reservoir is penetrated at depths (3541 – 3591.25 m), (3521.10 – 3649.30 m) and (3567.85 – 3615.98 m) by wells 1,2 and 3 respectively. It is characterized by average net sand thickness of 61.85m with a percentage net sand to gross reservoir thickness of (86 %), (82 %) and (77 %) in the three wells respectively. Well 1 has a good porosity of 19 % and a high permeability of (15.1 md). The presence of hydrocarbon can be accounted for, by hydrocarbon pore volume of 16.5 %, hydrocarbon saturation of 87 % and a water saturation of 13 % in well 1. Well 1 has a relative permeability to water (Krw ) of (0.08 md), effective permeability to oil (Ko) of (1.20 md) and
relative permeability to oil (Kro) of (0.94 md).
Reservoir D
The reservoir is penetrated at depths (3734.50 – 3833.81 m), (3783 – 3883.65 m) and (3683.61 – 3856.05 m) by wells 1, 2 and 3 respectively. It is characterized by average net sand thickness of 110.43 m with a percentage net sand to gross reservoir thickness of (89 %), (88 %) and (88 %) in the three wells respectively. Well 3 has a good porosity of 23 % and a high permeability of (30.9 md), this indicates the presence of hydrocarbon. The hydrocarbon saturation (Sh) are 86 %, 63% and 59 % for well 1,2, and 3 respectively. Hydrocarbon production can still be expected when the reservoir is put into production for well 1 and well 2.
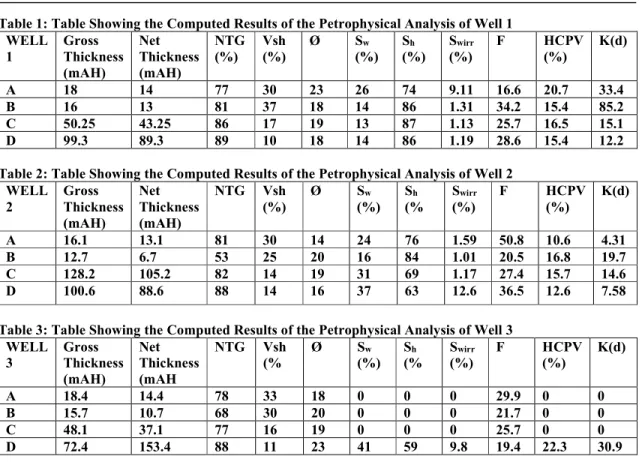
Table 1: Table Showing the Computed Results of the Petrophysical Analysis of Well 1 WELL 1 Gross Thickness (mAH) Net Thickness (mAH) NTG (%) Vsh (%) Ø Sw (%) Sh (%) Swirr (%) F HCPV (%) K(d) A 18 14 77 30 23 26 74 9.11 16.6 20.7 33.4 B 16 13 81 37 18 14 86 1.31 34.2 15.4 85.2 C 50.25 43.25 86 17 19 13 87 1.13 25.7 16.5 15.1 D 99.3 89.3 89 10 18 14 86 1.19 28.6 15.4 12.2
Table 2: Table Showing the Computed Results of the Petrophysical Analysis of Well 2 WELL 2 Gross Thickness (mAH) Net Thickness (mAH) NTG Vsh (%) Ø Sw (%) Sh (% Swirr (%) F HCPV (%) K(d) A 16.1 13.1 81 30 14 24 76 1.59 50.8 10.6 4.31 B 12.7 6.7 53 25 20 16 84 1.01 20.5 16.8 19.7 C 128.2 105.2 82 14 19 31 69 1.17 27.4 15.7 14.6 D 100.6 88.6 88 14 16 37 63 12.6 36.5 12.6 7.58
Table 3: Table Showing the Computed Results of the Petrophysical Analysis of Well 3 WELL 3 Gross Thickness (mAH) Net Thickness (mAH NTG Vsh (% Ø Sw (%) Sh (% Swirr (%) F HCPV (%) K(d) A 18.4 14.4 78 33 18 0 0 0 29.9 0 0 B 15.7 10.7 68 30 20 0 0 0 21.7 0 0 C 48.1 37.1 77 16 19 0 0 0 25.7 0 0 D 72.4 153.4 88 11 23 41 59 9.8 19.4 22.3 30.9 Conclusion
From the result of this research, it can be seen and observed that several alternatives pose themselves in the analysis of hydrocarbon bearing reservoirs, as full characterization and evaluation process allow for subsequent development and optimum recovery methods.
The stratigraphy of the study location revealed a sand-shale intercalation with exceptions to some reservoirs bearing traces of shale within them, a common trend of the Agbada formation of the Niger Delta. Typical of sandstone reservoirs, the estimated porosity values for Well 1 fall within a range of 15 % < Ø < 25 % which is good according to Buller et al Classification and the permeability values fall within 10 -100 md which indicates a high permeability. In conclusion the reservoirs in well 1 bear high prospect for hydrocarbon when put into production. This being validated by results of petrophysical estimations obtained for the delineated reservoirs, though differing in values, fall within a range of standard measures as expected for hydrocarbon bearing reservoir. References
Asquith, G and Gibson, C (1982). Basic Well Log Analysis for Geologists. AAPG Oklahoma. 2nd Ed. Pg 7,
91-107.
Beka, F.T., and M. N. Oti, 1995, The distal offshore Niger Delta: frontier prospects of a mature petroleum province, in Oti, M.N., and G. Postma, eds., Geology of deltas: Rotterdam, A. A. Balkena, pp. 237-241. Doust, H., and Omatsola, E., 1990, Niger delta, in, Edwards, J.D., and Santogrossi, P.A., eds., Divergent/passive
Margin Basins, AAPG Memoir 48: American Association of Petroleum Geologists, pp. 239-248.
Edwards, J.D., and Santogrossi, P.A., 1990, Summary and conclusions in Edwards, J.D., and Santogrossi, P.A., Divergent/passive Margin Basins, AAPG Memoir 48: American Association of Petroleum Geologists, pp. 239-248.
Hunt, J.M., 1990, Generation and migration of petroleum from abnormally pressured fluid compartments: American Association of Petroleum Geologists Bulletin, v.74, pp. 1-12.
Kulke, H., 1995, Nigeria, in H. Kulke, ed., Regional petroleum geology of the world. Part II: Africa, America, Australia and Antarctica: Berlin, Gebruder Borntraeger, pp. 143-172.84
Stacher, P., 1995, Present understanding of the Niger Delta hydrocarbon habitat, in Oti, M.N. and Postma, G., eds., Geology of deltas: Rotterdam, A.A Balkema, pp. 257-267
209-Klett et, al 1997, Ranking of the world’s oil and gas provinces by known petroleum volumes: U.S Geological Survey Open file Report, pp. 97-463.