HAL Id: hal-02095010
https://hal.archives-ouvertes.fr/hal-02095010
Submitted on 10 Apr 2019HAL is a multi-disciplinary open access archive for the deposit and dissemination of sci-entific research documents, whether they are pub-lished or not. The documents may come from teaching and research institutions in France or abroad, or from public or private research centers.
L’archive ouverte pluridisciplinaire HAL, est destinée au dépôt et à la diffusion de documents scientifiques de niveau recherche, publiés ou non, émanant des établissements d’enseignement et de recherche français ou étrangers, des laboratoires publics ou privés.
Multi-Scale Maps with Clutter Measures
Marion Dumont, Guillaume Touya, Cécile Duchêne
To cite this version:
Marion Dumont, Guillaume Touya, Cécile Duchêne. Assessing the Variation of Visual Complexity in Multi-Scale Maps with Clutter Measures. 19th ICA Workshop on Generalisation and Multiple Representation, Jun 2016, Helsinki, Finland. �10.13140/RG.2.1.4775.3849�. �hal-02095010�
1
Assessing the Variation of Visual Complexity
in Multi-Scale Maps with Clutter Measures
Marion Dumont1, Guillaume Touya1, Cécile Duchêne1
1. Motivations
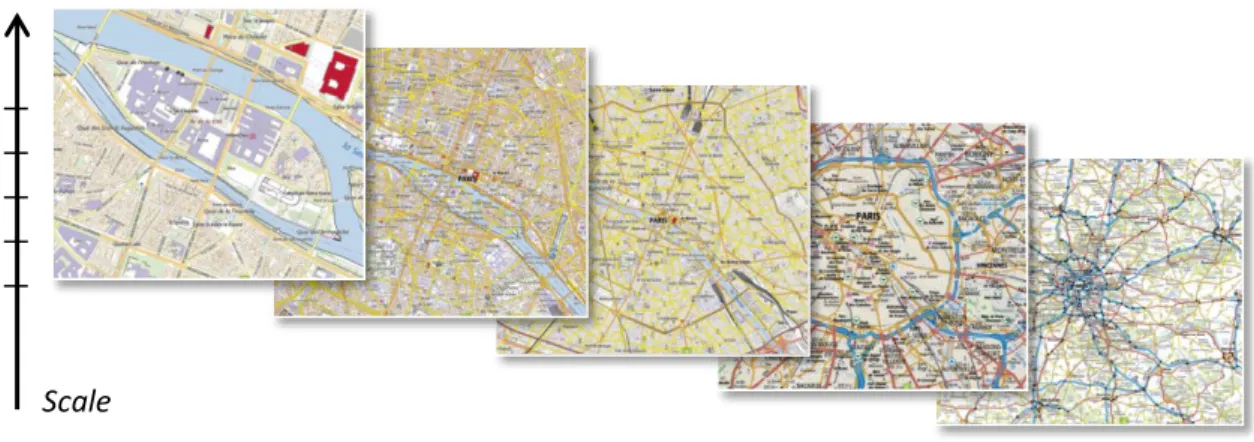
Mapping applications, where a multi-scale navigation is available, display multi-scale maps, i.e. a set of maps at different scales. Across scales, the map levels (Fig. 1) can present large differences in terms of representation, due to cartographic generalisation. In our research project [2], we assume that adding intermediate representations between existing map levels could be one way to reduce these differences and to enable smooth transitions while zooming.
Inspired by the literature (§2.b), we believe that smooth zooming requires regular and small variations of map complexity across scales. In this paper, we present our experiments assessing clutter variation in existing multi-scale maps. This study seeks to identify if clutter variations may predict the perceived variation of visual complexity in multi-scale maps.
After presenting some research works connected to our experiments (§2), the following sections address our research issues and study procedure (§3), then results analysis (§4). Lastly, we discuss the relevance of clutter measures for our project and presents our future work (§5).
2. Related Work
a.
Map Complexity
Many researchers studied the complexity of maps, using a different focus and thus different concepts. However, most proposed definitions [4; 8; 9; 16] highlight the distinction between:
▪
the visual (or graphical) complexity, evolving with the distribution and symbolization of map elements,▪
thesemiological complexity, related to the understanding of the semantic meaning of map signs,▪
and the intellectual (or cognitive) complexity, which covers the understanding of spatial structures and implicit message of the map.The initial assumption of studying map complexity was that it could have an adverse effect on map effectiveness [9], and should thus be controlled. In this paper, we focus on visual complexity, as it is the aspect of complexity over which cartographers have the greater control [9].
b.
Estimating Cognitive Load with Visual Complexity Assessment
As highlighted in [7], assessing the visual complexity of a display (not specifically a map) may serve to estimate the cognitive load required for its understanding, and inversely, estimate its effectiveness. To confirm this hypothesis, some works evaluate the correlation between computed visual complexity and performance evaluation of a user task in images [1; 11 pp. 17-20] and in maps [6; 14]. These assessed tasks may be the time of search for specific objects in a map for instance. In most studies, user performances get worse with the increase of visual complexity.
In our case, we need to limit and thus assess the visual complexity of each multi-scale map level. Moreover, we believe that large variations of visual complexity between map levels may imply an additional cognitive effort. In this paper, we will specifically focus on these variations.
c.
Assessing Visual Complexity with Visual Clutter Measures
Visual Clutter Definition. Some studies [6; 10] highlight the main responsible factors for visual complexity:
1
2
▪
amount of information, determined by the amount of visual features and their shape complexity, but also the variation in colour and luminance;▪
information organization, assessed as the spatial distribution and organization/disorganization of features in the display;▪
and information discriminability, measured as the graphical specifications, compared to the limitations of human visual system.As defined in [14], visual clutter corresponds to a threshold above which the increase of visual complexity leads to a degradation of user performance at some task. Different methods proposed in the literature measure most or all of the features listed above, and may thus be a way of assessing visual complexity.
Clutter Measures. Literature related to visual clutter mostly focuses on images and thus proposes image-based methods for assessing visual clutter [1; 7; 10; 11 pp. 6-17; 13; 14]. Some of these studies focus on maps [4; 8; 14; 15]. Besides, few researchers propose vector-based methods on maps [4; 6; 9]. In this paper, we will focus on image-based methods, as our multi-scale maps samples are available in raster format. However, we acknowledge the potential of vector-based methods, and will use them in future work.
In the remainder of this paper, “clutter measures” will refer to methods for assessing visual clutter. However, it must be reminded that these methods measure visual complexity, and highlight a visual clutter only above a certain threshold, which depends on a specific task.
Measures Validation. Some studies have shown the correlation between clutter measures and perceived visual complexity, by measuring the performance of a user task (§2.b) or by subjective evaluations [6; 7; 9; 10; 11 pp. 20-24; 13], which ask participants to rate or rank some images according to their complexity.
In this study, we will use different clutter measures to assess the visual complexity of each multi-scale map level, and check if the computed clutter variations are consistent with the perceived variation of visual complexity across scales.
d.
Clutter Measures across Scales
In a previous work [15], we used different clutter measures on official topographic map series across three or four scales. We specifically highlighted their potential and their limitations for cartographic generalization purpose.
In this paper, we will go further in the scales comparison, computing these clutter measures on multi-scale maps from several cartographic producers. We will assess all the available map levels, and not only the different topographic maps. Indeed, some producers use a same map at two or more consecutive zoom levels [3], potentially with different visual complexity as the display scale changes.
3. Assessing the Variation of Visual Complexity with Clutter Measures
a.
Research Issues
In this study, we assume that variation of perceived visual complexity in a multi-scale map may be predicted with computed clutter measures. We will thus check if we perceive the computed clutter variations in existing multi-scale maps.
Then, studying the irregularities and large variations, we will try to identify their potential factors, to avoid them when modelling our generalization process. In particular, as the literature on visual complexity (§2.c) highlights the importance of colour variability, we will focus on the palette influence.
On the contrary, we will also try to heuristically establish an “ideal clutter variation”, using “good” examples of scale transitions.
3
b.
Study Procedure
Data Collection. We selected sixteen multi-scale maps, provided by national mapping agencies (ACT-Luxembourg, BEV-Austria, GDI-Germany, OS-Ireland, ICGC-Catalonia, IGN-Spain, IGN-France (Scan Express and Scan IGN), Lantmäteriet-Sweden, NGI-Belgium, NLS-Finland, Swisstopo, USGS), private companies (GoogleMaps, BingMaps) or collaborative communities (OpenStreetMap). We took screenshots of these maps (Fig. 1) at every available scale, always keeping the same screen characteristics (size, resolution). All the screenshots of a same multi-scale map are also centred on the same point.
Fig. 1. Different map levels of the Scan Express multi-scale map from IGN France
In this study, we chose to focus on urban areas, as their visual complexity and need for generalization is generally higher than rural areas.
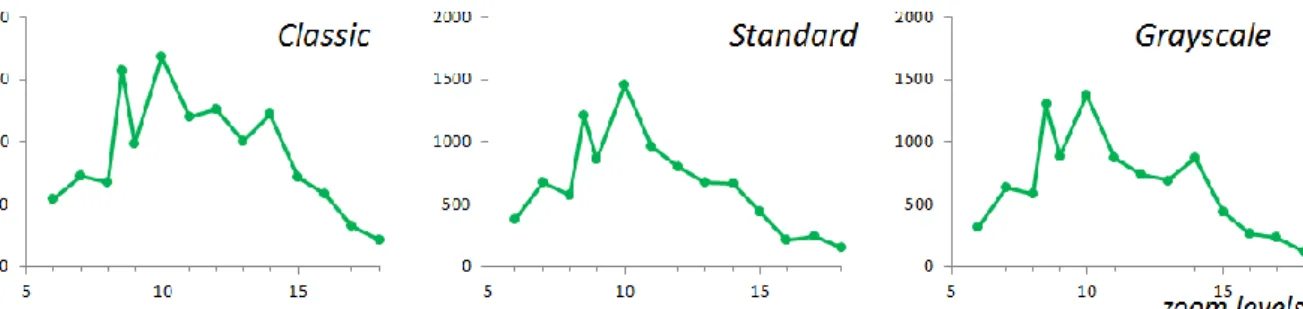
Concerning the colour variability, we studied the Scan Express multi-scale map, provided by IGN France with three different palettes (Fig. 2):
▪
the classic palette uses the colour space of the French 1: 25 000 topographic maps,▪
the standard palette uses paler hues to serve as background map for instance,▪
and the last palette uses a grayscale representation.Fig. 2. Extract of the Scan Express multi-scale map for available palettes: classic, standard and grayscale
Clutter Measures. In this study, we used previously implemented clutter measures [15]. We already tested them on maps and found their results consistent with our cartographer perception of visual complexity. In the following paragraphs, their individual way of working is briefly described.
The quad tree clutter [8] converts the assessed image in grayscale and computes a quad tree on it, based on the homogeneity of pixel values. If the difference of pixel values in a cell is bigger than a threshold, the cell is cut in four new cells. The clutter is the resulting number of cells, when all of them are considered homogeneous. This method is particularly applicable here, because developed for maps, although in grayscale. Its results are considered consistent by cartographic experts [8].
Scale
Grayscale Palette
4
The subband entropy method is similar to JPEG compression. After decomposing the image into wavelets for each CIELab channel, the clutter value is computed as a weighted sum of subbands entropies. This clutter measure has been adapted from two existing works [8; 14]. This last work validated this method on maps with a performance evaluation of user tasks.
The segmentation-based method[1] computes an efficient segmentation algorithm [5] on the image. The clutter value is given by the number of identified objects. This method has been validated on images with a performance evaluation of user tasks. Its results are consistent with the subband entropy method [14], and thus relevant on maps.
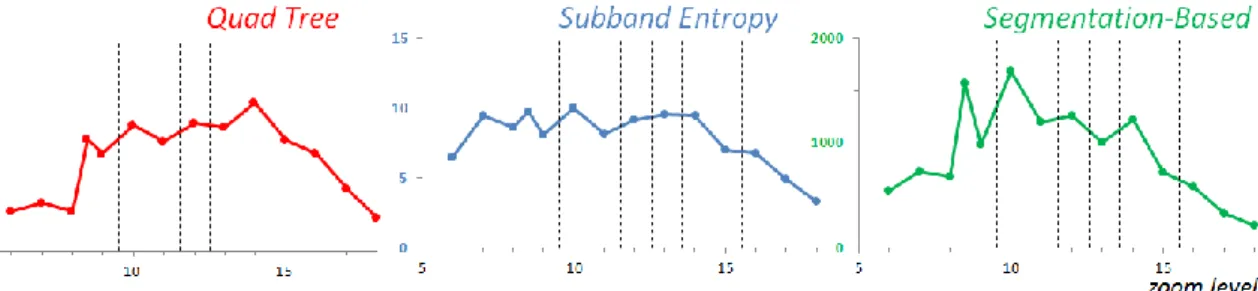
Clutter Variation. For each captured screenshot, we computed these three clutter measures. As we are interested in the variation of visual complexity over scales, we studied the variation curve of computed clutter values (Fig. 3, Y axis) in a multi-scale map depending on the zoom level [3, 12] of the screenshot (Fig. 3, X axis). For instance, for the Scan Express multi-scale map, zoom levels are available from 6 at 1: 6 000 000 scale, to 18 at 1: 1500 scale.
Fig. 3. Clutter variation assessed with the three clutter measures, for the Scan Express multi-scale map (classic palette). Vertical dashed lines indicate a change of map content (according §2.b).
Comparing clutter values (Fig. 3) between different measures is obviously impossible, as they measure different things. We thus observed the shapes of the curves, as trends in clutter variation.
4. Results Analysis
a.
Clutter Measures Comparison
Most studied multi-scale maps present similar clutter variations between different methods, as for Scan Express (Fig. 4).
Fig. 4. Comparison of curve shape between different clutter measures for Scan Express (classic palette), by vertical alignment of curves from Figure 3
Given that clutter values may vary a bit depending on the measure parameters, we consider the few differences of variation that have been found between methods as negligible. We also believe that small clutter variations in a multi-scale map may be not perceptible and thus negligible. However,
5
even with a user experience, defining a significance threshold may be very hard and will depend on a specific user task. To circumvent this difficulty, we will use simultaneously the three methods, which measure different features of visual complexity and may thus identify different problems.
b.
Colour Sensitivity
To assess their colour sensitivity, we computed the clutter measures on the three available Scan Express palettes (Fig. 2). The three methods give very similar curves between different versions. Few differences appear on the curves of segmentation-based method (Fig. 5), mainly due to the method parameter, which influences the minimum size of segmented objects.
Fig. 5. Clutter variation assessed for the different palettes of Scan Express with the segmentation-based method For most map levels, the computed clutter is higher for the classic palette than for the two others. Vibrant colours seem thus assessed as more complex than paler ones. Besides, grayscale maps are generally considered less complex than the standard palette. It is consistent with the specifications of this palette, voluntary simple to serve as background map.
We conclude here that these clutter measures are not very sensitive to the palette, when a legible colours organization is used. Although these results are consistent with our visual perception, it may be useful to measure more precisely the palette complexity in multi-scale maps. Different methods, such as proposed in [13], may be used to deeper assess the colour variability of maps.
c.
Perception of Computed Clutter Variations
In most cases, our perception of how visual complexity varies in the studied multi-scale maps is consistent with the computed clutter variations. In the Scan Express multi-scale map for instance, the following successive map levels (Fig. 6) give us a feeling of varying visual complexity, as the amount and size of map elements (linear, place names, symbols) successively decrease and increase. The relative curve of clutter variation (Fig. 7) is thus consistent with our perceptions.
Fig. 6. Successive levels of the Scan Express multi-scale map
Fig. 7. Extract of the clutter variation curve for the previous Scan Express map levels (Fig. 6) with the subband entropy method. The other clutter methods give a similar curve shape.
6
d.
Need for Intermediate Representations
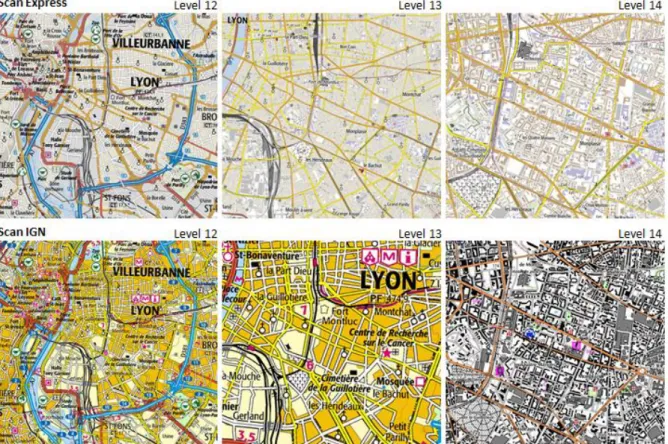
In the previous example (Fig. 6), clutter variations seem due to a lack of intermediate representation. To provide a map level at each zoom level defined by [12], producers sometimes use an enlarged map, defined for another scale [3]. If such a map is displayed at too small or too large scales, readability issues may appear. We thus assume that adding intermediate representations, consistent in terms of content, abstraction and representation, may improve the existing multi-scale maps [2]. The following figure (Fig. 8) compares Scan Express and Scan IGN, two multi-scale maps provided by the French IGN. These sets of maps are generally based on similar data, as shown in the two couples of maps at levels 12 and 14 (Fig. 8). However, in Scan Express, an intermediate representation has been added at level 13, whereas in Scan IGN, this level shows an enlarged version of the map used at level 12.
Fig. 8. Consecutive levels of Scan Express and Scan IGN multi-scale maps (IGN France)
The clutter variations between these respective levels (in red, Fig. 9) seem less important for Scan Express. It would confirm our main hypothesis that intermediate representations may smooth the variation of visual complexity and thus enable smooth zooming.
Fig. 9. Clutter variation in Scan Express (standard palette) and Scan IGN, with the subband entropy method. Red points correspond to the maps shown in Figure 8
7
e.
Towards an Ideal Clutter Variation
Considering that only small variations of clutter may enable smooth transitions, we have computed the variance and maximum range of clutter values in the studied multi-scale maps. Minimum and maximum results highlight multi-scale maps with the smallest or largest variations.
Smallest Variations. Multi-scale maps which are not produced by governmental organizations (i.e. BingMaps, GoogleMaps, OpenStreetMap) are generally classified in this category. These companies use few generalisation processes, keeping a similar amount of information and clutter across scales. In this class, we also find multi-scale maps using a harmonized symbolization for the whole map levels, which may ease the perceived scale transitions.
Largest Variations. In this category, we mainly find multi-scale maps produced with scanned paper maps, which may present important clutter variations as previously mentioned (§4.d). Both Scan Express and Scan IGN multi-scale maps are classified here and may thus be improved.
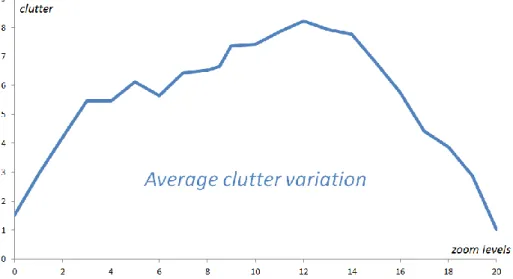
This classification is consistent with our visual perceptions. It confirms that clutter variations should be minimized between consecutive map levels. The following figure (Fig. 10) shows the average curve of clutter: for each zoom level, the clutter value has been averaged between all multi-scale maps. This curve has a right-tailed shape, with low clutter values at smaller and larger scale maps. At smaller scales, maps generally contain less information to respect the legibility constraints, while larger scales only display a small area and thus few objects, without additional information. We thus believe that an “ideal clutter variation” presents a right-tailed distribution, with a smooth and regular shape.
Fig. 10. Average curve of clutter variations in the studied multi-scale maps. Zoom level 12 corresponds to the 1: 1M scale.
5. Discussion and Future Work
Compared to our perceptions, clutter measures appear related to the variation of visual complexity in multi-scale maps. However, although we studied the clutter variations, measures only assess the complexity of multi-scale map levels, when we would assess the transitions between map levels. We think that only performance evaluation of user tasks may really assess the efficiency of scale transitions.
Studying the clutter variations in existing multi-scale maps allowed us to highlight a need of consistent intermediate representations. This variation is assessed as smoother when such a representation is added, which would confirm our initial assumption [2]. Our next goal will be to derive these intermediate representations in an existing multi-scale map.
With three different clutter measures, we identify two groups of multi-scale maps, which present small or large clutter variations. With a deeper study of these groups, we will search which elements
8
may cause small or large clutter variations. The visual results of quad tree and segmentation-based methods give an idea of these factors, as they show the cells local density and thus the clutter location. For instance, we found that place names are mainly responsible for clutter in the third map of Figure 6. To go further, we need the vector data of these multi-scale maps, to be able to add or remove each layer and test the impact on visual clutter. Moreover, it could be interesting to check if these factors are the same at different scales.
These measures may also help us to detect a need for generalization, as irregularities in the clutter variations. However, images-based measures present some limitations for generalization purpose, as shown in [15]. Complexity measures based on vector data [6] may thus be complementary for these issues.
In a previous work [2], we identified the potential negative effect of changing abstraction levels on scale transitions. More recently [3], we focused on the representation of settlement areas across scales. We identified interesting transitions between abstraction levels, such as the superposition of individual buildings and urban areas. We would now like to evaluate the effect of these choices on the variation of visual complexity. However, identifying this effect in clutter variations seems very hard, as multi-scale maps use very different abstraction choices and representations. We will thus build intermediate representations using different transitions in the Scan Express multi-scale map, to enable a relevant comparison.
Acknowledgments
This work is supported by the French National Research Agency, as part of the MapMuxing project [ANR-14-CE24-0011-01].
References
1. Bravo, M.J., Farid, H. (2008) A scale invariant measure of clutter. Journal of Vision, 8(1), 23–23
2. Dumont, M., Touya, G., Duchêne, C. (2015) Automated Generalisation of Intermediate Levels in a Multi-Scale Pyramid. In: Proceedings of 18th ICA Workshop on Generalisation and Multiple Representation. Rio de Janeiro, Brazil
3. Dumont, M., Touya, G., Duchêne, C. (2016) A comparative study of existing multi-scale maps: what content at which scale? In: GIScience 2016. Montreal, Canada. Submitted
4. Fairbairn, D. (2006) Measuring Map Complexity. The Cartographic Journal, 43(3), 224–238.
5. Felzenszwalb, P., Huttenlocher, D. (2004). Efficient graph-based image segmentation. International Journal of Computer Vision, 59(2), 167–181
6. Harrie, L., Stigmar, H., Djordjevic, M. (2015) Analytical Estimation of Map Readability. ISPRS International Journal of Geo-Information, 4(2), 418–446
7. Harper, S., Michailidou, E., Stevens, R. (2009) Toward a definition of visual complexity as an implicit measure of cognitive load. ACM Transactions on Applied Perception (TAP), 6(2)
8. Jégou, L., Deblonde, J.-P. (2012) Vers une visualisation de la complexité de l’image cartographique. Cybergeo : European Journal of Geography.
9. MacEachren, A.M. (1982) Map complexity: comparison and measurement. American Cartographer, 9(1), 31–46
10.Miniukovich, A., De Angeli, A. (2014) Quantification of interface visual complexity, in: Proceedings of the
2014 International Working Conference on Advanced Visual Interfaces. ACM, 153–160.
11.Moacdieh, N., Sarter, N. (2014) Display Clutter. Human Factors: The Journal of the Human Factors and Ergonomics Society, 51(7), 61-100
12.Open Geospatial Consortium Inc. (2010) OpenGIS® Web Map Tile Service Implementation Standard, OGC 07-057r7, version 1.0
13.Purchase, H.C., Freeman, E., Hamer, J. (2012) Predicting visual complexity, in: Proceedings of the 3rd
International Conference on Appearance, Edinburgh, UK. 62–65
14.Rosenholtz, R., Li, Y., Nakano, L. (2007) Measuring visual clutter. Journal of Vision, 7(2)
15.Touya, G., Decherf, B., Lalanne, M., Dumont, M. (2015) Comparing image-based methods for assessing visual clutter in generalized maps, in: 9th International Symposium on Spatial Data Quality (ISSDQ’2015). Montpellier-La Grande Motte, France
9
16.Touya, G., Christophe, S., Hoarau, C. (2016) Clutter and Map Legibility in Automated Cartography: A Research Agenda. Cartographica, 50(3)
Studied Multi-scale Maps
1. ACT Luxembourg, http://map.geoportail.lu/, last consulted 19 June 2015
2. BEV Austria, http://www.austrianmap.at/amap, last consulted 19 June 2015
3. Bing Maps, http://www.bing.com/maps, last consulted 22 June 2015
4. GDI Germany, http://www.geoportal.de/EN/Geoportal/Maps/maps.html, last consulted 19 June 2015
5. Google Maps, http://www.google.fr/maps, last consulted 22 June 2015
6. ICGC Catalonia, http://www.icc.cat/vissir3, last consulted 19 June 2015
7. IGN Spain, http://www2.ign.es/iberpix/visoriberpix/visorign.html, last consulted 5 November 2015
8. IGN France (Scan IGN), http://www.geoportail.gouv.fr/, last consulted 22 June 2015
9. IGN France (Scan Express), http://tab.geoportail.fr/, last consulted 6 November 2015
10.Lantmäteriet Sweden, http://kso2.lantmateriet.se/, last consulted 22 June 2015
11.NGI Belgium, http://www.ngi.be/topomapviewer, last consulted 19 June 2015
12.NLS Finland, http://kansalaisen.karttapaikka.fi/kartanhaku/osoitehaku.html, last consulted 19 June 2015
13.OpenStreetMap, http://www.openstreetmap.org/, last consulted 22 June 2015
14.OS Ireland, http://maps.osi.ie/publicviewer/, last consulted 19 June 2015
15.Swisstopo Switzerland, http://map.geo.admin.ch/, last consulted 19 June 2015