No. 2013/26
Granularity of Corporate Debt
Jaewon Choi, Dirk Hackbarth, Josef Zechner
C F S
W
O R K I N GP
A P E RCenter for Financial Studies Goethe University House of Finance
Tel: +49 69 798-30050 Fax: +49 69 798-30077
CFS Working Paper Series
The Center for Financial Studies, located in Goethe University’s House of Finance in Frankfurt, is an independent non-profit research center, funded by the non-profit- making organisation Gesellschaft für Kapitalmarktforschung e.V. (GfK). The CFS is financed by donations and by contributions of the GfK members, as well as by national and international research grants. The GfK members comprise major players in Ger- many’s financial industry. Established in 1967 and closely affiliated with the University of Frankfurt, it provides a strong link between the financial community and academia. CFS is also a contributor to policy debates and policy analyses, building upon relevant findings in its research areas.
The CFS Working Paper Series presents the result of scientific research on selected topics in the field of money, banking and finance. The authors were either participants in the Center´s Research Fellow Program or members of one of the Center´s Research Projects. If you would like to know more about the Center for Financial Studies, please let us know of your interest.
Prof. Michalis Haliassos, Ph.D. Prof. Dr. Jan Pieter Krahnen Prof. Dr. Uwe Walz
Center for Financial Studies Goethe University House of Finance Grüneburgplatz 1 60323 Frankfurt am Main
Tel: +49 69 798-30050 Fax: +49 69 798-30077
Granularity of Corporate Debt
∗Jaewon Choi† Dirk Hackbarth‡ Josef Zechner§
May 9, 2013
Abstract
We study to what extent firms spread out their debt maturity dates across time, which we call “granularity of corporate debt.” We consider the role of debt granularity using a simple model in which a firm’s inability to roll over expiring debt causes inefficiencies, such as costly asset sales or underinvestment. Since multiple small asset sales are less costly than a single large one, firms may diversify debt rollovers across maturity dates. We construct granularity measures using data on corporate bond issuers for the 1991–2011 period and establish a number of novel findings. First, there is substantial variation in granularity in that many firms have either very concen-trated or highly dispersed maturity structures. Second, our model’s predictions are consistent with observed variation in granularity. Corporate debt maturities are more dispersed for larger and more mature firms, for firms with better investment opportunities, with higher leverage ra-tios, and with lower levels of current cash flows. We also show that during the recent financial cri-sis especially firms with valuable investment opportunities implemented more dispersed maturity structures. Finally, granularity plays an important role for bond issuances, because we document that newly issued corporate bond maturities complement pre-existing bond maturity profiles.
JEL Classification Numbers: G13, G31, G32, G33.
Keywords: Capital Structure, Debt Structure, Debt Maturity.
∗We thank Viral Acharya, Heitor Almeida, Ran Duchin, Zhiguo He, Chuan Hwang, Evgeny Lyandres, Ernst Maug, Suresh Sundaresan, Sheriden Titman, John Wald, Toni Whited, and seminar participants at Catolica Lisbon joint with Nova and ISCTE-IUL, Copenhagen Business School, EDHEC, ESMT, Erasmus University Rotterdam, Hebrew University, IDC Herzliya, Maastricht University, Tel Aviv University, University of California at San Diego, University of Geneva, University of Hong Kong, University of Illinois, University of Iowa, University of Mannheim, University of Oxford, University of Pennsylvania, University of St. Gallen, University of Tilburg, University of Washington, Vienna University of Economics and Business, WHU Otto Beisheim School of Management, the 2012 China International Conference, the 2012 EFA Meetings, the 2012 Liquidity Risk Management Conference, 2013 New York Fed/NYU Stern Conference, and the NBER Conference on “Understanding the Capital Structures of Non-Financial and Finan-cial Corporations” for helpful comments and suggestions. We are grateful to Yunling Chen for providing us with data.
†University of Illinois, 1206 S. Sixth St., Champaign, IL 61820, USA. Email: [email protected]. ‡University of Illinois, 515 E. Gregory Dr., Champaign, IL 61820, USA. Email: [email protected].
§Vienna University of Economics and Business, Heiligenstaedter Str. 46, 1190 Vienna, Austria. Email: [email protected].
1
Introduction
It is not yet well understood to what extent firms manage the rollover dates of their bonds by spreading out maturities. Fixed cost components of bond issues and secondary market liquidity con-siderations should motivate firms to concentrate their debt in a single or few issues. However, even non-financial firms frequently have multiple bond issues outstanding, with different times to matu-rity. This suggests a potentially important but heretofore unrecognized dimension of debt structure requiring firms to trade off different frictions to determine an optimal debt maturity concentration. Surprisingly, we lack both testable theoretical implications and empirical evidence. Even basic stylized facts are largely unavailable, so there is little guidance as to what one would expect to find. In practice, however, debt maturity decisions are affected by the incentive to mitigate rollover risk, which is the most common motive in Servaes and Tufano’s (2006) survey of chief financial officers. Our paper therefore provides a first step towards understanding firms’ decisions to spread out bond maturity dates across time, which we call “granularity of corporate debt.”
To gain an understanding of what drives this dimension of debt structure and to generate a number of testable implications, we consider a simple, three-period model in which rollover risk has real effects and therefore influences debt maturity structure. The firm has an investment opportunity with decreasing returns to scale and payoffs at time three. The firm finances the project by issuing bonds with maturities less than or equal to two. Thus, frictions, such as moral hazard or investor preferences, prevent the firm from issuing very long-term bonds that expire at time three, so that the firm must roll over the bonds issued at time zero at least once. In particular, we consider two maturity structures, aconcentrated and adispersedone. The firm with aconcentrated maturity structure (or firm C) refinances its bonds at one point in time (i.e. date one or two), whereas the firm with a dispersed maturity structure (or firm D) refinances its bonds attwo points in time.
Along some paths, the bonds can be rolled over and the final cash flows are eventually realized in full. Along other paths, however, the firm can temporarily lose its access to the bond market. The firm’s inability to refinance its bonds may arise because markets freeze for exogenous reasons or it may arise endogenously since the firm can become temporarily exposed to a large risk.1 We show 1See, e.g., Acharya, Gale, and Yorulmazer (2011) for market freezes after a decline in collateral value. There are
many reasons for a state of increased uncertainty to adversely affect a firm’s ability to access capital markets that can lead to a market freeze for that firm: negative supply shocks due to firm-specific or market-wide tightening of credit, large legal battles or liability risks (e.g., in the oil industry as documented by Cutler and Summers (1988) or in the pharmaceutical industry), recall risks of car manufacturers (e.g., Toyota’s malfunctioning gas pedal), challenges or disputes of patents, regulatory risks of energy companies (e.g., whether or not to exit nuclear power
that, in such states, investors may not be able to roll over their bonds. As a result, the firm must pass up or partially liquidate investment projects to repay the bondholders, and this is inefficient. Firm D only needs to liquidate a small fraction of its assets to repay its bonds. It has the real option to keep the more profitable assets and liquidate those with a small or zero net present value (NPV). By contrast, if firm C cannot roll over its bonds, then it must liquidate a large fraction of its assets (including some with higher NPVs) or forgo positive NPV projects. Thus, in our model it is less costly to be exposed to small rollover risks at two points in time rather than being exposed to large rollover risk at one point in time.2 On the other hand, one larger bond issue has lower flotation costs (see Lee et al. (1996)) and liquidity costs (see Longstaff, Mithal, and Neis (2005) and Mahanti et al. (2008)) than two smaller bond issues. Thus, there is a trade-off in that firmD
faces lower expected costs due to rollover risk than firmC, whereas firm C has a transaction cost advantage over firm D.
Based on the tension between costly asset sales or underinvestment on the one hand and trans-action costs on the other hand, we derive a number of testable implications. Our model implies that the benefits of dispersed corporate debt maturities increase with rollover risk and with the value of investment opportunities. Moreover, corporate debt should be more dispersed for larger and more mature firms due to their lower transaction costs, for firms with higher leverage ratios, and for firms with lower levels of current cash flows due to their lower ability to withstand episodes of limited access to external funding without costly investment reductions or project liquidations.
We construct a large panel data set that contains information on maturity structures and firm characteristics by merging data on corporate bond issues from Mergent’s Fixed Investment Secu-rities Database (FISD) with the COMPUSTAT database. For the 1991–2011 period, we obtain an unbalanced panel with 17,396 (9,880) firm-year observations for firms with at least one bond (two bonds) outstanding. We use these firm-level data from FISD to measure how dispersed maturity structures are.3 For each firm, we group bond maturities into the nearest integer years and compute
production after disasters such as Fukushima) or hedge funds (e.g., after the financial crisis), and impending natural catastrophes, such as oil spills whose exact consequences for businesses such as tourism are unknown for some time (see, e.g., Massa and Zhang (2011)). One such example of a market freeze and rollover risk is the case of General Growth Properties in April 2009.
2There may be additional motives why firms issue debt with different maturity dates. Matching maturities of firms’
liabilities with those of their assets requires that asset maturities can be determined easily. In addition, firms usually consist of a large number of projects, so it is not feasible to issue a separate bond for each project. Also, asymmetric information problems are likely to be more severe at longer horizons compared to shorter horizons, which further limits firms’ ability to match the maturities of liabilities with those of assets. Thus, the frictions that we consider in this paper remain relevant even in the presence of other motives for spreading debt maturity dates across time.
the fractions of bond amounts outstanding each year. The first measure of maturity dispersion is the inverse of the maturity profile’s Herfindahl index based on these fractions. The second measure is related to the distance of a firm’s actual maturity profile from the perfectly dispersed maturity profile, holding its average maturity constant.
We document that there is substantial variation in debt granularity. Although a large number of firms have highly dispersed maturity structures, we find at the same time that many firms have very concentrated maturity structures. These concentrated firms are typically young and small and finance a significant portion of their assets through a single, small bond issue, which suggests that spreading out maturities using smaller bonds might be too costly for them. We also find that firms issue bonds to become more granular during economic downturns when rollover risk is supposedly high, which supports the view that firms consider trade-offs in determining maturity structure.
In addition to these basic stylized facts, we report novel results that are directly related to our model’s predictions. We find that larger and more mature firms, firms with more valuable invest-ment projects, and firms with more leverage exhibit more dispersed maturity profiles. In contrast, granularity is negatively associated with profitability. Most of these firm characteristics remain eco-nomically and statistically significant after controlling for industry or firm and year fixed effects, suggesting that firms condition on these variables in the management of their debt maturity profile. These findings are robust to inclusion of private debt maturity profiles into our granularity measures and are also present in subsamples of firms with a high and a low proportion of private debt.4
We study several, related aspects. We check whether firms use tools other than debt granularity to manage rollover risk. We document that firms tend to rely on credit lines to avoid high rollover risk arising from concentrated debt structures, which is consistent with Chang, Chen, and Das-gupta (2010). Moreover, during the 2008–2009 financial crisis when rollover risk is likely to have been higher, we find that especially firms with valuable investment opportunities implemented more dispersed debt maturity structures. In addition, we establish that the dispersion of debt maturi-ties moves over time towards target levels. In particular, speed-of-adjustment regressions reveal surprisingly high adjustment rates, ranging from 21% to 56% per year.
We also provide evidence of active management of debt maturity dispersion by examining 4Renegotiation is common for private debt, so realized maturity is much shorter than contracted maturity (see,
e.g., Roberts and Sufi (2009)). Private debt’s maturity is also easy to modify (see, e.g., Mian and Santos (2011)). Firms with a large proportion of private debt may therefore not need dispersed public debt rollover dates and yet we do not find evidence for such a substitution effect.
whether firms consider pre-existing maturity profiles when they issue new bonds. To do so, we investigate whether discrepancies between a firm’s pre-existing maturity profile and a benchmark maturity profile (based on firm characteristics implied by our model) explain future debt issue be-havior. We find that, if a firm has a large fraction of bonds outstanding in any given maturity bucket relative to its benchmark profile, then it is significantly less likely to issue bonds in those maturity buckets. For example, the probability of issuing additional nine- or ten-year maturity bonds drops by 0.18 of a percentage point for every percentage point that a firm’s maturity profile exceeds the benchmark profile in this bucket. The results hold across all maturity buckets, are largely invariant to the definition of the benchmarks or buckets, and are also economically significant.
Our paper is related to several models of debt maturity and rollover frictions.5 By linking cor-porate bond credit risk and bond market liquidity risk, He and Xiong (2012) show that short-term debt exacerbates rollover risk. He and Milbradt (2012) endogenize the feedback between secondary market liquidity risk and rollover risk – reduced liquidity raises equity’s rollover losses, leading to earlier endogenous default, which in turn worsens bond liquidity. Chen, Yu, and Yang. (2012) study the link between credit spreads, systematic risk, and lumpy maturity structure. These papers focus on single-bond firms’ debt maturity choice. Auh and Sundaresan (2013) analyze the optimal liabil-ity structure of firms when there is the possibilliabil-ity of a run by short-term lenders. They show that, when the bankruptcy code allows for violations of absolute priority, the optimal liability structure may include both long-term debt and secured short-term debt, with safe harbor protection. More closely related to ours is a recent paper by Diamond and He (2012), which shows that maturing short-term debt can lead to more debt overhang than non-maturing long-term debt. However, none of these papers examine the decision of diversifying debt rollovers across dates to avoid maturity concentrations. In our setting, we show that neither the issuance of a single long-term nor that of a single short-term debt claim is optimal, because only a combination of debt with different rollover dates can reduce inefficiencies due to rollover risk.
Our paper is also related to recent empirical and survey research. Based on a global survey, Servaes and Tufano (2006) report that chief financial officers are concerned about losing access to debt markets and, in particular, that debt maturity choice is strongly driven by the objective of managing rollover risk by avoiding maturity concentrations. Almeida et al. (2012) document that firms with a greater fraction of long-term debt maturing at the onset of the 2007 financial crisis
had a more pronounced investment decline than otherwise similar firms.6 In the context of U.S. Treasury bonds, Greenwood, Hanson, and Stein (2010) argue that firms vary their debt maturity to act as macro liquidity providers by absorbing supply shocks due to changes in the maturity of Treasuries. Using syndicated loan data for U.S. firms, Mian and Santos (2011) find that most credit worthy firms frequently manage (i.e. extend) loan maturities to reduce liquidity risk. Rauh and Sufi (2010) and Colla, Ippolito, and Li (2012) establish that – relative to large, high credit quality firms – small, low rated firms have dispersed or multi-tiered debt structures, while small, unrated firms specialize in fewer types. Finally, Harford, Klasa, and Maxwell. (2012), who docu-ment declining debt maturities for U.S. firms, find that firms with more refinancing risk increase their cash holdings and save more cash from their cash flows.7 Unlike these studies, we focus on understanding the dispersion of corporate debt maturities.
The rest of the paper is organized as follows. Section 2 describes the model and its implications. Section 3 presents data sources, summary statistics, and stylized facts. Section 4 provides the empir-ical analysis of granularity and Section 5 reports the results for bond issuance. Section 6 concludes.
2
A Simple Model of Debt Granularity
In the presence of frictions due to rollover risk firms should respond by adjusting the distribution of debt maturity dates. To formalize this intuition and to better understand its implications for debt granularity, we study a three-period model of an initially all-equity financed firm. The firm has as-sets in place (or initial net worth),A, and a project that requires a capital outlay,I, at timet0. In the absence of early project liquidations, the project generates a cash flowI+Hat timet3. We normal-ize the riskless interest rate to zero and assume that the NPV of the project,H, is greater thanI/2.
The firm issues straight one- or two-period bonds to raise the required capital of I−A. To keep the analysis focused, we do not consider three-period bonds or equity. In a more general model, short maturity debt is optimal due to informational asymmetries (see, e.g., Diamond (1991), Dia-mond and He (2012), or Milbradt and Oehmke (2012)), and equity is also dominated as long as debt tax shields are sufficiently valuable. Thus, the project is financed by bond issues at time t0 that must be rolled over before timet3. However, at times t1 and t2, the bond market may freeze with probability λ. Appendix A provides an extended model where market freezes arise endogenously,
6Similarly, Hu (2010) finds firms with more maturing long-term debt had larger increases in credit spreads. 7See Barclay and Smith (1995), Guedes and Opler (1996), and Johnson (2003) for empirical debt maturity studies.
generating the same implications for debt granularity.
If the firm is unable to refinance maturing bonds due to a market freeze, then assets from the project must be sold to generate the funds required to repay the bondholders (an alternative interpretation of this inefficiency is that the firm needs to cut back on investment). Such a partial liquidation reduces the final cash flow and generates an immediate cash flow. We consider two discrete levels of asset sales. A moderate asset sale generates liquidation proceeds of I/2 and reduces final cash flows by the same amount. Thus, att1 andt2cash flows of up toI/2 are costlessly transferable from time t3 via an asset sale. By contrast, a large asset sale generates liquidation proceeds of I but reduces the final cash flows by I/2 +H. Thus, a large asset sale is inefficient, since H > I/2. This is either because of illiquidity of the collateral assets to be sold or because of decreasing economies of scale, i.e. the first project units to be liquidated have zero NPV but as more units of the project must be liquidated, positive NPV is lost. We assume that any excess cash generated by the asset sale not needed to repay the maturing bonds is paid out to stockholders.8
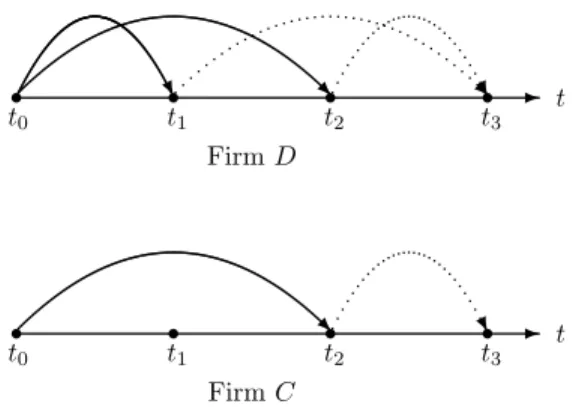
Figure 1. Evolution of Debt Rollover
Figure 3. Evolution of Roll-Over Decisions
FirmD s t0 Us R RU -t1 s t2 s t3 t FirmC s t0 R U -s t1 s t2 s t3 t
This figure plots the time line of rollover decisions for the dispersed maturity structure (or FirmD) with two smaller issues, which expire at timet−
1 andt−2, and the concentrated maturity structure (or FirmC) with one larger issue, which expires at timet−
2. An expiring issue needs to be rolled over to timet3 to obtain the firm’s continuation value.
This figure plots the time line of debt rollover for the dispersed maturity structure (or Firm D) with two smaller issues, which expire at time t1 and t2, and for the concentrated maturity structure (or Firm C) with one larger
issue, which expires at timet2. An expiring bond issue needs to be rolled over to timet3 or repaid with internally
generated cash to realize the project’s cash flow.
We consider two initial maturity distributions, aconcentrated and adispersedone (see Figure 1). We refer to the former as firmCand to the latter as firmD. FirmCissues bonds at timet0with ma-turities at either timet1or timet2, at which point they are rolled over to timet3 whenever possible. Since it is straightforward to show that firmCis indifferent between an initial maturity of timet1or timet2, we only consider the concentrated maturity structure at timet2. In contrast, firmDissues
8Thus, we assume that it is expensive to carry forward excess corporate cash balances from timet
1 tot2. This is
the case if free cash balances can be (partially) expropriated by management or used for empire building purposes.
two bonds at timet0, one with maturityt1 and one with maturityt2. Thus, firmDhas a dispersed maturity structure. We assume that the bonds issued initially by firmD have equal face value.
In practice, bond issuances have a fixed cost component. To capture scale economies of larger issues, we assume that the firm pays a fixed cost per issue,k, at timet0. As a result, firm C has a transaction cost advantage, because it incurs issue costs ofk, whereas firm D incurs issue costs of 2k. In addition,kcan be thought to reflect the fact that a single large bond issue may have a more liquid secondary market, thus leading to a lower illiquidity discount than two smaller bond issues. For evidence on a positive relation between issue size and direct issuance costs and secondary mar-ket liquidity, respectively, see Lee et al. (1996) and Longstaff, Mithal, and Neis (2005) or Mahanti et al. (2008). Moreover, Altinkilic and Hansen (2000) provide evidence that bond spreads decline monotonically with issue size, which is consistent with an ecnomies of scale interpretation. Finally, note that issue costs at each point in time would also favor firmCbecause it has only two issuances, while firmD has four issuances (see Figure 1).
Notice that bonds are risk-free and hence the face value of the concentrated firm’s bonds equals
BC =I−A. Therefore, ifBC > I/2, the concentrated firm faces costly rollover risk. If the bond market freezes at time t2, then the firm must engage in a large asset sale, which reduces final cash flows byI/2 +H to generate liquidation proceeds at timet2 ofI. On the other hand, the two bonds of the dispersed firm have a face value of BD
1 =B2D = (I −A)/2, which is less than I/2. In case of a market freeze, firmD only needs to engage in a moderate asset sale, which reduces final cash flows by I/2 to generate liquidation proceeds at time t1 and/or at timet2 of I/2. Therefore, the dispersed firm does not face costly rollover risk. More generally, of course, both types of firms may find it costly to refinance their bonds and hence our framework corresponds to a relative statement in that a concentrated maturity structure will lead to larger inefficiencies than a dispersed one.
As firmDencounters no inefficiencies, it is easy to verify that firmD’s equity value is given by:
ED = I+H−(I−A)−2k . (1)
Firm C does not face a rollover problem with probability 1−λand repays the bonds at time t3. However, ifBC > I/2, a large asset sale is required with probability λto generate a time t
2 cash flow ofI by reducing time t3 cash flow byI/2 +H. The resulting inefficiency is given by H−I/2. Alternatively, if assets in place, A, are sufficiently high such that BC ≤ I/2, then even the firm with a concentrated maturity structure does not face costly rollover risk. Therefore, the value of
firm C’s equity value is given by: EC = I+H−(I −A)−λ(H−I/2)−k ifBC > I/2 , I+H−(I −A)−k ifBC ≤I/2 . (2)
The benefits of a dispersed maturity structure are given by the difference in equity values, ∆E≡ED −EC, which is informative about the incentives for creating a granular debt structure:
∆E = λ(H−I/2)−k ifBC > I/2 , −k ifBC ≤I/2 . (3)
The comparison in equation (3) says that, for a sufficiently large amount of bonds (i.e.BC > I/2), a dispersed maturity structure is preferred in the absence of transactions costs because ofH > I/2. This result accords with practitioners’ concern about maturity concentrations.
In summary, the above model formalizes the intuition that firms may be unable to refinance expiring debt externally in some states of the world and are therefore forced to engage in ineffi-cient liquidations. Since multiple small asset sales are less costly than a single large one, it can be advantageous (depending on firm characteristics) to diversify debt rollovers across maturity dates. The inefficiency can also be interpreted as passing up valuable investment opportunities. To keep the analysis focused, we have not considered other channels to avoid or manage rollover risk, but we will consider the potential role of these alternatives in the empirical analysis (see Section 4.2).
The model generates a number of empirical predictions for a corporation’s incentives to select a concentrated or dispersed debt maturity profile. First, the potential benefits of a dispersed ma-turity structure increase with the probability of a market freeze, λ. Arguably, market freezes are more likely during economic downturns or financial crises. Second, dispersed debt maturities are increasingly valuable when the project’s net present value, H, rises. Put differently, it is optimal for a firm with more profitable projects as measured, e.g., by a higher value of Tobin’s Q, to have a more spread out maturity structure. Third, an increase in transaction costs, k, works in favor of a more concentrated maturity structure. This implies that a firm with higher floatation and illiquidity costs will have a lower incentive to implement a more dispersed maturity profile. Since transaction costs are generally regarded to be inversely related to firm age and firm size, corporate bond maturities should be more dispersed for larger and more mature firms.
There are additional observations that follow. Because a firm with a higher value of assets in place, A, needs less debt financing, the rollover problem in the λ state vanishes for firm C if
BC ≤I/2. Therefore, when leverage is sufficiently low, firmC dominates firmD. In other words, bond maturity dates should be more dispersed for firms with higher leverage. Moreover, even though we do not model cash flows from assets in place, observe that higher cash flows from assets in place correspond, in a present value sense, to a higher value of assets in place. Hence maturity profiles should be more dispersed for firms with lower cash flows from assets in place. Finally, notice that all of the above predictions should apply both to a comparison of firms with different characteristics and to bond issuance decisions of a given firm through time.
3
Data Description
3.1 Data Sources
Corporate bond data are drawn from Mergent’s Fixed Income Security Database (FISD), which contains comprehensive data on over 140,000 corporate bond issues for all credit ratings. The FISD includes fixed income securities that already have a CUSIP or are likely to have one in the near fu-ture. It also includes corporate bonds issued in private placements (e.g., Rule 144A securities). We obtain issue dates, bond maturities, initial and historical amounts outstanding, and other relevant information from FISD, which begins in the 1980s but becomes comprehensive in the early 1990s. Accounting data are drawn from the annual COMPUSTAT tapes. These data sets enable us to measure debt granularity and various firm characteristics for the 1991–2011 period. In addition, we also employ the Capital IQ database for firms’ usage of lines of credit. This results in a more restricted sample, which only covers the 2002–2011 period. Following standard practice, we exclude financial firms (SIC codes 6000-6999) and utilities (SIC codes 4900-4999), and winsorize the top and bottom 0.5% of variables to minimize the impact of data errors and outliers.
3.2 Variable Construction
Using bond maturity data from FISD, we construct two different measures of granularity. The first one is based on a concentration index. For each firm, we group debt maturities into the nearest integer years, i, and multiply principal amounts in each year, ai, by weights xi to get weighted principal amounts for each maturity. The weights,xi, can capture the idea that firms are more concerned about rollover risk from shorter maturities (see, e.g., Harford, Klasa, and Maxwell (2012)). For each debt maturityi, we then calculate the fraction of principal amounts outstanding,
wi = (xiai)/Pi(xiai), to compute the Herfindahl index, HERF = Piw2i.9 We examine two different weighting schemes. The first scheme places more weight on the fractions of shorter debt maturities. Specifically, for maturities less than or equal to 25 years, we usexi = (1i)/(P25i=11i) and, for maturities greater than 25 years, we usexi = 0. The second scheme employs equal weights for all debt maturities of the same firm (i.e.xi= 1). Since the empirical results are qualitatively sim-ilar, we report results in the subsequent sections only for the first scheme, which puts more weight on earlier rather than later maturities. The findings for the unadjusted fractions are available from the authors upon request.
The second measure is based on the distance of the observed maturity profile from the perfectly dispersed one. For each firm j with average maturitym in the sample, we envision a hypothetical firm that has a perfectly dispersed maturity profile with the same average maturity m as firm j. The average maturity of a firm with a perfectly dispersed maturity profile (i.e. a constant fraction of debt expiring each period) is given by: m= 1nP
ii. Applying the summation formula and solving fornyields that the perfectly dispersed firm would haven= 2m−1 debt obligations (with different maturities) outstanding. This hypothetical firm would roll over a constant fraction 1/n of its total debt each period (i.e. replace debt issuednperiods ago by new debt with maturityn). We therefore calculate the mean squared deviation of firmj’s actual maturity profile from the perfectly dispersed one: DIST = tmax1
j Pt max j i=1 wi−2m1−1 2
wherewi is the (unadjusted) fraction of principal amounts outstanding with equal weights (i.e. xi = 1) andtmaxj is the longest debt maturity of firm j.10
To capture dispersion rather than concentration or distance, we define the following granularity measures: inverse of the Herfindahl index, GRAN1 ≡1/HERF, and negative value of the log of the squared distance from perfect dispersion, GRAN2 ≡ −log(DIST).11 We use the maturity structure of corporate bonds from FISD rather than the maturity structure of total debt, which includes bank loans, because rollover frictions are more relevant for bonds than for loans. The results are similar when we extend the analysis to the maturity structure of total debt (see Section 4.6).
To investigate the empirical predictions from Section 2, we include a number of explanatory and control variables in our regression specifications. The explanatory variables include market-to-book 9For examining corporate bonds’ influence on role of credit default swaps, Oehmke and Zawadowski (2012) also
use a Herfindahl index as a proxy for the fragmentation of a firms total bonds outstanding.
10In an earlier version of the paper, we also proxy maturity dispersion based on an inequality index (Atkinson
(1970)). The results (available from the authors upon request) are qualitatively identical.
11Similar to Lemmon, Roberts, and Zender (2008), we add 0.001 toDIST to preventGRAN2 from being negative
(Q), firm size (Size), firm age (Age), leverage (Lev), and profitability (P rof). We provide details on the construction of all variables used in this study in Appendix B.
3.3 Summary Statistics and Stylized Facts
Table 3 contains the summary statistics for our sample of 2,477 firms over the 1991–2011 period, for which we have 17,396 firm-year observations. The sample consists of large firms with significant leverage, because firms are required to have corporate bonds outstanding to enter the sample. For example, the average (median) book assets are $7.65 ($1.69) billion, and the average (median) lever-age ratio is 0.28 (0.24). In addition, in the sample, bonds account for the majority of debt financing. On average, 65% of debt consists of corporate bonds (seeBondP ct). The distribution of principal amounts, BondAmt, is informative about the plausibility of fixed costs associated with bond is-suance. Typical issue sizes of bonds are quite large with a median of $150 million and an average of $208.8 million. Observe also that the interquartile range ofBondAmtstarts at $87.5 million and ends at $250 million. The fact that 75% of the bonds in our sample have a face value greater than $87.5 million is consistent with the presence of a fixed cost element associated with bond issuance. Table 4 documents statistics on key variables for tercile groups defined by the empirical dis-tributions of granularity, bond percentage, and debt maturity. The table reveals that there is observed heterogeneity in debt granularity across tercile groups. In theGRAN1 tercile groups, for example, the lowest granularity firms have on average 1.17 bonds outstanding (seeN Bond) and the Herfindahl-based granularity measure (GRAN1) equals 1.00. In contrast, the highest granularity firms have on average 13.76 bonds outstanding with GRAN1 value of 3.77. If one assumes equal principal amounts outstanding for the first fourteen years, then the perfectly granular firm would have GRAN1 ≈ 6.7. Thus, the Herfindahl-based granularity measure of 3.77 suggests that debt structures are not perfectly granular even for firms with the largest number of bonds outstanding.12 For theGRAN2 tercile groups, the lowest granularity firms haveGRAN2 = 2.18, which translates to an average standard deviation from perfect granularity of 33.5%, whereas the highest granularity firms’ corresponding standard deviation from the perfect granularity is only 9.15%. The sample properties are similar when we useGRAN2 to stratify the data in columns 4–6 of Table 4.
[Insert Table 4 here]
12The interpretation of the unadjustedGRAN1 measure (not reported) is more straightforward in that a perfectly
granular firm with n bonds outstanding would have GRAN1 equal ton because then GRAN1 is the inverse of the Herfindahl index. If the firm has a more concentrated debt structure, e.g.,n bonds with different face values,
These subsamples reveal that there is substantial variation in debt granularity and, at the same time, that firms do not appear to completely spread out their debt maturity dates. In particular, we highlight that a large number of firms have very concentrated maturity structures. In the tercile group based on GRAN1, for example, 8,415 out of 17,253 firm-year observations have perfectly concentrated debt structure, because one is a lower bound forGRAN1. These firm-year observa-tions are not all composed of single-bond firms, as seen from the average number of bonds, which is 1.17. In addition, we document that these firms issue large bonds relative to their assets. In the low tercile group based on GRAN1, the average bond amount with respect to assets is 0.28, whereas that for the high tercile is only 0.04. In addition, these firms are relatively younger (average age is 17 years) and smaller, but are similar to higher tercile firms in other dimensions. If firms matched the maturities of their liabilities to their assets for all projects (according to the matching principle), then we should observe a large number of bonds and a high level of granularity for all tercile groups, because firms tend to have many projects that begin (and end) at different points in time. However, the evidence in this table does not support this view.
This substantial variation in debt maturity profiles does not seem to be explained by bank loans. In other words, firms do not complement concentration in bond maturities with loan maturities. For the tercile groups based on corporate bonds’ percentages of total debt outstanding in colums 7–9 of Table 4, the highBondP ct group has a bond percentage of 97%, meaning that almost all of their debt financing is through bonds. In this group firms have, on average, 4.7 bonds outstanding but aGRAN1 value of only 1.85, which clearly suggests that their bond maturity structures are still relatively concentrated. Moreover, we also observe from the granularity-based tercile groups that the variation in e.g. GRAN1 is not much different forGRAN1L, which includes COMPUSTAT’s maturity variables to reflect private debt granularity.13 That is, for both granularity-based tercile groups, higher bond maturity dispersion is associated with higher debt maturity dispersion.
How do firms with concentrated maturity structures manage rollover risk? Although we do not consider other channels for managing rollover risk in our theoretical framework, firms might, in practice, use them too. That is, concentrated firms could hoard larger cash balances, issue more equity, or have more lines of credit. We find evidence for such substitution effects in Table 4 in that low-granularity firms tend to have greater cash balances (Cash), larger credit lines (LCLimit), and more equity issuances (EqIssue). For example, cash holding, lines of credit, and equity issuances
are, on average, 0.14 (0.07), 0.18 (0.11), and 0.03 (0.01) in the low (high)GRAN1 tercile group.
Finally, the last three columns of Table 4 consider tercile groups based on debt maturity. Two observations can be made. First, perhaps not surprisingly, firms with longer debt maturities tend to have more granular debt structures, possibly because they have a wider range of issuance choices. Second, asset maturity (AssetM at) is neither clearly increasing with nor reliably related to debt maturity. For the low, mid, and high terciles, average maturity is 3.91, 7.60, and 15.90, respec-tively, whereas average asset maturity is similar across the terciles, 4.15, 6.09, and 5.87. Despite the limitations of interpreting these statistics, it seems unlikely that the intuitive idea behind the maturity matching principle strongly influences firms’ behavior in the data.
Figure 2 plots time-series averages of debt maturity dispersion for issuing and non-issuing firms. For issuing firms, maturity dispersion is countercyclical, i.e. firms issue bonds to make maturity structures more dispersed during recessions. Increased rollover risk during recessions appears to push firms towards more dispersed debt structures, even though costs of issuance are typically higher in these periods. Thus, firms clearly manage debt maturity dispersion over the business cycle. This business cycle pattern is also consistent with our model, because in recessions the probability of a market freeze,λ, is likely to be higher.
[Insert Figure 2 here]
Summarizing, we have established several stylized facts. First, there is a lot of variation in granularity across firms. This variation is largely insensitive to the fraction of the firm’s private debt. Second, many firms have relatively concentrated maturity profiles, although they could have chosen more dispersed ones, which suggests that they evaluate costs and benefits of debt gran-ularity. Third, average granularity also varies considerably over time (e.g., with macroeconomic conditions). Finally, matching debt maturities with asset maturities does not seem to explain ob-served debt granularity. In the subsequent sections, we analyze debt granularity and bond issuance across firms and across time in more detail.
4
Empirical Analysis of Debt Granularity
We have argued in Section 2 that firms face trade-offs when they manage their maturities over time. This implies that different firms will follow different strategies depending on their characteristics, which is broadly confirmed by the heterogeneity of debt granularity observed in Section 3. In this
section, we examine whether firm characteristics that proxy for different incentives for granularity management are reliably related to observed variation in the dispersion of debt maturity structures.
4.1 Baseline Regressions
We begin by estimating the following baseline regression:
GRANi,t+1 =βXi,t+αi+yt+i,t+1 (4)
where Xi,t is a vector of explanatory and control variables, αi is an industry- or firm-level fixed effect, yt is a year fixed effect. As the explanatory variable, we consider proxies that capture the forces described in our model. Specifically, we include market-to-book (Q), leverage (Lev), firm size (Size), firm age (Age), and profitability (P rof) as explanatory variables, given that these variables are related to debt granularity according to our framework in Section 2. In an extended baseline specification, we add the following control variables. We use tangibility (T an) to control for the ef-fect of pledgeable assets on maturity dispersion. We include average maturity (BondM at), because we want to study the incremental effect of firm characteristics on maturity dispersion. Finally, cash flow volatility (P rof V ol) might affect a firm’s ability to rollover its debt, so we include it too.
Debt granularity may be affected by unobservable firm or industry characteristics and also vary within firms over time (e.g., due to granularity management through recapitalization). We there-fore include either industry- or firm-level fixed effects to examine the extent to which unmeasured characteristics (or proxies) affect across- or within-firm variation in granularity.14 Recall that Fig-ure 2 suggests that bond issuance decisions could depend on macroeconomic variables, so we allow for year fixed effects too. Note that a term structure measure (see, e.g., Johnson (2003)) or an aggregate supply measure of Treasury bonds (see, e.g., Greenwood, Hanson, and Stein (2010)) is absorbed by year fixed effects, so our tests control for these considerations. We allow for clustering of standard errors at the firm level and note that the results are robust to using industry-level clustering of standard errors.
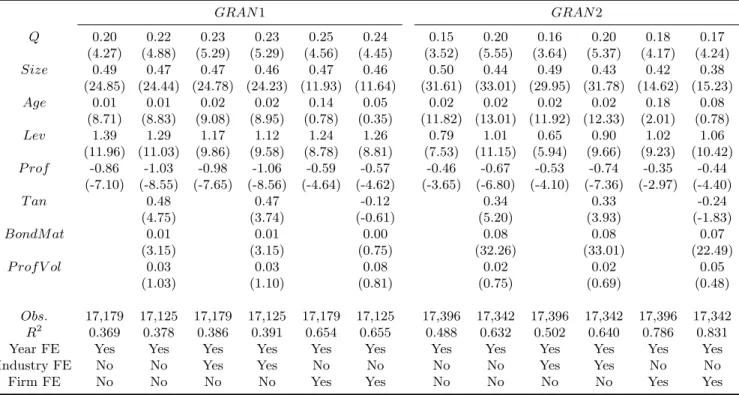
Table 5 gives the estimation results of equation (4) for the measures GRAN1 (in the left panel) andGRAN2 (in the right panel). Overall, the estimated coefficients are mostly statistically signif-icant, and their explanatory power is large. For example, in the first columns of the table for both granularity measures, all the variables are significant at the 1% level. Also, theR2 is quite high, i.e. 14We employ the Fama-French 49 industry classification. The results are robust to other industry specification, for
0.369 and 0.488 forGRAN1 and GRAN2, respectively. The economic significance is also sizable. Consider, for instance, the coefficient estimate of 0.20 on the market-to-book ratio (Q) in the first column of Table 5. It implies that a one standard deviation change (0.99) in the market-to-book ratio changesGRAN1 by 0.2, which corresponds to a 10.5% change relative to the sample average of GRAN1 (1.90) in Table 3.
[Insert Table 5 here]
Furthermore, the relation between the explanatory variables and debt maturity dispersion is consistent with our arguments in Section 2. The market-to-book ratio is reliably positively asso-ciated with maturity dispersion across all specifications for both of the granularity measures and with or without various fixed effects. This evidence supports the implication of our model that firms with more valuable growth opportunities have a higher incentive to spread out their bonds’ maturity dates across time to protect their valuable projects from inefficiencies.
The coefficient estimates on firm size (Size), as measured by log of total book assets, are reliably positive across all specifications in Table 5. Economically, firm size is highly significant. Observe that, given a one standard deviation change in log of total assets (1.63), the dependent variable is predicted to change by about 0.8 according to the first columns for each granularity measure. Firm age (Age) is also positively related to maturity dispersion, although its effect becomes weaker and statistically insignificant when we include firm fixed effects. Overall, these findings are consistent with the prediction that small, young firms are plagued by high transaction costs, and are therefore not able to spread out their bonds’ maturity dates across time.15
Leverage (Lev) is also positively associated with granularity. Although consistent with our prediction, this result can be partly due to endogeneity between granularity and leverage. Firms might consider bond amounts and bond maturity simultaneously when making issuance decisions. We consider endogeneity in Section 4.4 by using instrumental variable regressions.
Cash flow (P rof) is negatively associated with granularity, which is also consistent with the trade-off derived in Section 2. Intuitively, firms with lower cash flows want to avoid having to repay large amounts of debt at one point in time. We note that the negative coefficient estimate on cash flow is also consistent with signaling in the sense that “good types” want to separate from “bad types” by exposing themselves to rollover risk, because they are in a better position to handle 15To validate our assumption that size and age proxy for issuance costs, we perform in untabulated results
an analysis of gross spreads, the commissions paid to underwriters. Given issue amounts, we find a statistically significant, negative relation between firm size (or firm age) and gross spreads.
rollover problems. This interpretation of the relation between cash flow and granularity is in line with Diamond’s (1991) argument that links liquidity risk to debt maturity.
Moving to the extended baseline specification with control variables indicates that tangibility, maturity, and cash flow volatility are positively associated with granularity. However, these control variables do not reduce the explanatory power of the firm characteristics suggested by the model in Section 2. For example, the reliably positive coefficient forBondM atconfirms that a firm’s average bond maturity imposes a restriction on its granularity (i.e. a firm that cannot issue longer maturities cannot spread out its maturities over as many dates as an otherwise identical firm that can). While this effect is statistically significant, it by no means explains the relation between granularity and the main explanatory variables. This underscores the robustness of our baseline results.
In sum, the evidence in Table 5 establishes that firm characteristics, such asQ,Size,Age,Lev, and P rof, are strongly related to debt maturity dispersion in a way consistent with our model. These variables’ statistical significance is mostly unaffected by inclusion of different combinations of fixed effects. This shows that our variables measure granularity variation even after controlling for unobservable heterogeneity. The remainder of this section studies several alternative specifications and robustness tests for these baseline results.
4.2 Other Channels for Managing Rollover Risk
In practice, there are several mechanisms other than maturity dispersion to manage rollover risk. That is, firms with concentrated maturity profiles (see Table 4) may rely on other channels of rollover risk management, which we have not considered in Section 2. In this section, we examine how firms’ use of these channels is related to granularity.
The first channel we consider is corporate cash holdings. Given potential losses from higher rollover risk, firms would like to carry cash from good to bad states if their net worth enables them to do so. Recall that a sufficiently high net worth eliminates the inefficiency in Section 2. Another channel is equity issuance, which can also solve the firm’s problem in Section 2. Although equity issuances are in general relatively expensive, firms could use equity issuances to avoid inefficiencies. We measure cash holdings,Cash, by cash divided by total assets and equity issuance,EqIssue, by common or preferred stock sales divided by total assets.
The third channel relates broadly to lines of credit. Firms with lines of credit can better with-stand rollover risk and hence may have concentrated debt structures to reduce bond issuance costs.
For short-term debt rollovers, firms typically utilize lines of credit and reclassify short-term debt as long-term debt. We adopt the measure Rec from Chang, Chen, and Dasgupta (2010), which is defined as reclassified short-term debt under SFAS No. 6 divided by total assets.16 According to Chang, Chen, and Dasgupta (2010), reclassified debt is almost always accompanied by credit lines, and thus this measure should capture firms’ ability to manage rollover risk through credit lines. In addition, we employ direct measures of credit lines. We obtain data on firms’ total credit lines available from Capital IQ. The database facility amounts are for bank overdraft, letters of credit outstanding, and revolving credit. We aggregate these facility amounts for each firm and each year to get total lines of credit available. Our measure for lines of credit isLimitLC, which is total lines of credit available divided by total assets.
To examine whether these channels are related to debt granularity, we includeCash,LimitLC,
Rec, and EqIssue in our baseline specification (4) as independent variables. The results are re-ported in Table 6. Several observations follow. First, cash holdings are not reliably related to our granularity measures. These results suggest that firms do not hoard cash to deal with rollover risk, possibly because cash holdings are relatively expensive. Second, the results in the second and third columns of the table suggest that firms reliably use credit lines and debt reclassifications to manage rollover risk of bonds. That is, LimitLC and Rec are negatively related to granularity with statistical significance levels close to or better than 1%. Consistent with Chang, Chen, and Dasgupta (2010), we therefore find that firms also seem to employ lines of credit to manage rollover risk. Finally, firms do not appear to rely on equity issuances to manage rollover risk. This result is in line with the notion that equity issuances are even costlier than carrying cash.
[Insert Table 6 here]
In sum, the results suggest that, in addition to spreading out debt maturity dates over time, firms use other channels of rollover risk management. Firms with significant amounts of credit lines available tend to have concentrated debt structures, because they are more likely to roll over expiring debt without incurring inefficiencies and hence can economize on bond issuance costs.
4.3 Number and Type of Bonds
While our main variables are strongly associated with debt granularity, this does not rule out the possibility that firms do not consider debt granularity when making bond issuance decisions.
Accordingly, one might be tempted to argue that larger, more mature firms with higher leverage simply have more bonds outstanding. In addition, firms with better investment opportunities could have issued more bonds because of higher financing needs. Firms with many bonds outstanding probably have granular debt structures, because they are more likely to (or just randomly) issue bonds with different maturity dates, which would explain our baseline findings. This would be especially true if firms adhered to the matching principle. According to this interpretation, the firm characteristics we consider are associated with granularity through the number of bonds out-standing. If this is true, then the granularity measures would only pick up the effect of the number of bonds outstanding. Thus, controlling for the number of bonds outstanding should significantly weaken our baseline results.
[Insert Table 7 here]
Similar to Table 5, the left panel of Table 7 is for GRAN1 and the right panel is for GRAN2. In the first columns of the two panels, we examine whether our main explanatory variables are still reliably related to our granularity measures after including the number of bonds (N Bond). The columns show that the results are largely the same. The coefficients do not change much after controlling for the number of bonds. In the second columns of each panel in Table 7, we use as a dependent variable the residuals from the regression of granularity on the number of bonds to further control for the potential influence of variation in the number of bonds on debt granularity. The results are again very similar to the baseline results in Table 5. Overall, these robustness checks indicate that our main explanatory variables are significantly associated with debt granularity management even after controlling for the number of bonds outstanding.
Since there is a significant number of firms with only one bond outstanding, it is possible that the baseline results in Table 5 are mainly driven by these firms. If single-bond firms are not able to issue multiple bonds with different maturities for reasons not captured by the control variables, then having too many single-bond firms in the sample can be problematic. Moving to the columns labeled “N >= 2” in Table 7 reveals that the results for firms with at least two bonds outstanding are similar to the ones for the full sample. In fact, the economic significance of the main explana-tory variables, such as market-to-book, size, leverage, and profitability, tends to be higher for this subsample of firms. Thus, the results in Table 5 are not driven by firm-year observations for which only one bond is outstanding.
than 80% of their total bond amounts in bonds with option features and sinking fund provisions. Since effective maturities for bonds with options and sinking funds are likely to be much shorter than for straight bonds, re-estimating equation (4) for the subsample that is composed mostly of straight bonds is potentially more informative. Indeed, the columns “Straight” report stronger or similar relations between the granularity measures and the explanatory variables (i.e. the economic and statistical significance levels are larger in this subsample compared to the full sample).
4.4 Instrumental Variable Regressions
In Section 4.1, we find that leverage is positively and reliably related to granularity, which treats leverage as an exogenous variable and granularity as an endogenous variable. In reality, however, these variables are likely to be determined jointly and subject to the longest available maturity. That is, firms are likely to make financing decisions by considering the level of leverage along with the first two moments of maturity (i.e. average maturity and dispersion of maturity) simultaneously. In this subsection, we address these concerns by performing two-stage least-squares (2SLS) regressions. Specifically, we instrument leverage and maturity by including exogenous variables in addition to the other explanatory variables and controls. The additional exogenous variables need to affect granularity indirectly through leverage and maturity (but not directly). The first instrument is issuer-level credit rating. Rating agencies consider mainly debt coverage and cash flows to rate firms. As such, granularity is likely to be of little or no importance in determining credit ratings. This observation implies that rating is associated with granularity primarily through leverage and maturity. The second instrument is asset maturity. Asset maturity influences granularity mostly through average debt maturity but is unlikely to have a direct effect on granularity. Johnson (2003) and Saretto and Tookes (2012) also employ asset maturity as an instrument for debt maturity. In our implementation of the 2SLS estimations, we employ both of these instruments.17
Columns IV of Table 7 report the results from the 2SLS regressions using asset maturity and credit rating as instruments. We report the results based on firm fixed effects. The results show that instrumenting leverage and maturity sharpens the coefficient estimates on the key variables compared to the baseline results. For example, the effect ofQandP rof almost doubles in the left panel for GRAN1.18 All the explanatory variables are statistically significant at the same levels 17In untabulated results, we include industry leverage as the third instrument, similar to Saretto and Tookes (2012).
The results are qualitatively the same.
18This suggests that mangers are concerned about rollover risk in that they select low leverage and high granularity
as in Table 5 with the exception of Age in case of GRAN1, where Age is still significant at the 10% level. Taken together, these results provide further evidence of the trade-off in Section 2 that motivates firms’ incentives to manage the granularity of their debt.
4.5 Industry Granularity
Given that asset maturity is more homogeneous within an industry, it seems plausible that industry granularity should diminish the importance of some of the explanatory variables of the baseline re-gressions in Table 5, especially if firms match maturities of their liabilities with those of their assets (i.e. use the matching principle). So we consider in the last columns of Table 7 the possibility that industry granularity explains our baseline results. It turns out thatIndGRAN is economically and statistically significant, when we add it to the regression specifications for GRAN1 and GRAN2. However, it does not strongly influence the relations between granularity and firm characteristics, which we report in Table 5. In fact, the estimation results in the last columns of Table 7 suggest that firm characteristics, such as market-to-book or leverage, are independently important. We conclude that some but by no means all variation in granularity is driven by industry granularity and that these findings provide little support to the matching principle in our sample.
4.6 Including Private Debt in Granularity Measures
Our empirical analysis largely focuses on bond maturity profiles, because rollover frictions are likely to be smaller for private debt, such as bank loans. Recall that private debt is commonly and fre-quently renegotiated (see, e.g., Roberts and Sufi (2009)) and that the maturity of private debt is more easily manageable (see, e.g., Mian and Santos (2011)). In addition, bank loans are avail-able in relatively small increments, meaning that our arguments do not apply very well to private debt. On the other hand, corporate bonds, which are mostly public debt and characterized by a dispersed, anonymous ownership structure, are difficult to renegotiate once issued, are associated with sizable issue costs, and have large minimum issue sizes. In particular, Blackwell and Kidwell (1988) and Krishnaswami, Spindt, and Subramaniam (1999) find that issuance costs are larger for public debt than for private debt, which includes bank loans. In addition, Carey et al. (1993) find that public debt is cost-effective only above $100 million, while bank debt and non-bank private debt are cost-effective even for smaller issues. As a result, private debt maturity dispersion is less precisely measured and also less relevant for the arguments developed in Section 2.
Nonetheless, we examine whether our results are robust to inclusion of private debt maturities, and calculate granularity measures based on total instead of public debt maturities. To this end, we augment the corporate bond maturity structures from FISD by debt maturity variables from COMPUSTAT. Specifically, for maturities less than five years, we collect debt maturity information available in COMPUSTAT (DD1 to DD5). These COMPUSTAT variables include both public and private debt expiring in less than or equal to five years. For maturities greater than five years, we employ bond amounts available in FISD. We then combine debt amounts from these two sources to calculate granularity measures of firms’ total debt. Given that most bank loans have stated maturities of less than five years, this procedure should generate fairly good proxies for debt granularity that capture both public and private debt maturity dispersion. 19
To begin, notice that the descriptive statistics in Table 4 show that bond granularity (i.e.
GRAN1 or GRAN2) is largely unaffected by incorporating maturity profiles from COMPUSTAT to compute total debt granularity (i.e.GRAN1LorGRAN2L). More importantly, we re-estimate equation (4) using the granularity measures that include private debt as dependent variables. The regression results based on these measures are gathered in the fifth columns of Table 7. As seen in the “Loans” columns, most of the explanatory variables are statistically significant and their signs are consistent with the ones predicted by the model in Section 2. Overall, these results indicate that the firm characteristics we consider are also associated with total granularity.
4.7 Proportion of Private Debt
In addition to the results provided in Table 7 for including private debt maturity profiles into our granularity measures, we further examine the impact of private debt on public debt granular-ity. Recall that debt renegotiation is very common for private debt, so realized maturity is much shorter than contracted maturity (see, e.g., Roberts and Sufi (2009)). As a result, firms with a large proportion of bank loans may not need to spread out the maturity dates of their corporate bonds. Put differently, since private debt is easier to adjust and renegotiate than public debt, firms might effectively maintain a high degree of total debt maturity dispersion by managing bank debt dispersion, but leaving bond maturity structures less dispersed. In addition, some components of private debt, such as credit lines, are useful for managing rollover risk.
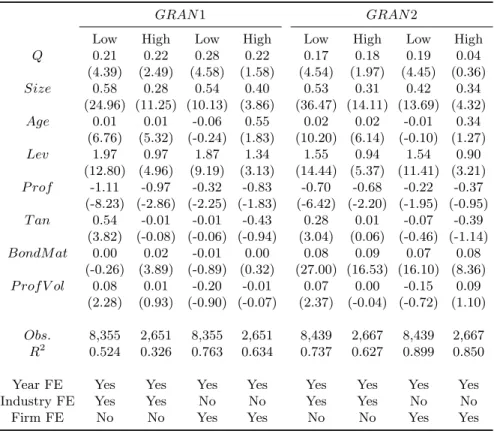
To examine this substitution hypothesis, we estimate the model in equation (4) for low and 19To validate this approach, we have examined maturities of bank loans for the limited sample (2002 onwards) using
high bank debt subsamples. That is, we investigate in Table 8 whether a larger fraction of bank debt affects firms’ granularity decisions. Firms are categorized as low bank loan firms if corporate bonds in FISD account for more than 50% of their total debt (long-term debt plus debt in current liabilities in COMPUSTAT), and they are categorized as high bank loan firms otherwise. Notably, the estimation results for both subsamples are qualitatively similar to the full sample results. Thus, the baseline results in Table 5 are robust to variation in the proportion of private debt. Consistent with the finding in Section 4.6, these results suggest that granularity is mainly relevant for public debt, which supports our arguments in Section 2.
[Insert Table 8 here]
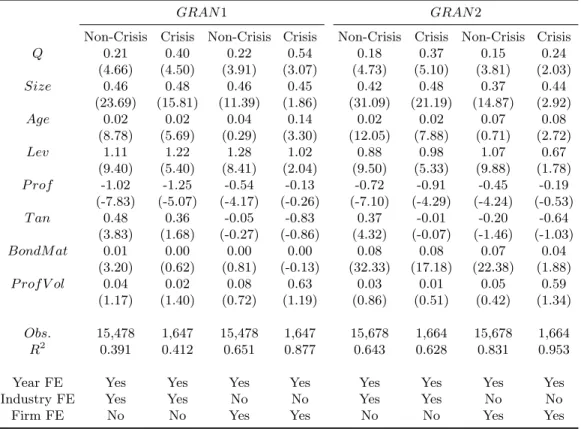
4.8 Granularity during the Financial Crisis
During the recent financial crisis, most firms probably faced substantially increased rollover risk. Almeida et al. (2012), for example, document that firms with long-term debt maturing during the financial crisis had to decrease investments. We therefore examine whether firms’ incentives to implement a more dispersed maturity structure are stronger during the 2008–2009 financial crisis. Table 9 reports estimation results of equation (4) for the 2008–2009 crisis period and for the non-crisis period (i.e. 1991 to 2007 and 2010 to 2011). Compared to the non-non-crisis period, the effect ofQ
is more precisely measured in the crisis subsample for both granularity measures (i.e. thet-statistics are similar but there is a substantial difference in the number of observations between the two sub-samples). In addition, the economic effect of investment opportunities on granularity rises consider-ably during the crisis. For example, the coefficient estimate onQin the fourth column ofGRAN1 with firm fixed effects is 0.54, compared to 0.22 for the non-crisis period in the third column. In untabulated results, the differences in coefficients between the two subsamples are in most cases statistically significant at the 1% level. These estimation results suggest that given the higher likeli-hood of investment inefficiencies due to rollover risk during the crisis, especially firms with valuable investment opportunities (as measured by a higherQ) selected reliably higher maturity dispersions.
[Insert Table 9 here]
4.9 Partial Adjustment and Target Granularity
The regression specification (4) assumes implicitly that observed maturity dispersion is also firms’ target dispersion. In a world without adjustment costs, this would be plausible. With adjustment
costs, however, realized dispersion is likely to deviate from its target level, and firms will typically make partial adjustments towards their targets. If firms manage granularity, then it will revert to target levels rapidly. In contrast, if there is no target granularity, or if adjustment costs are too high, then firms are passive and adjustment speeds should be slow.
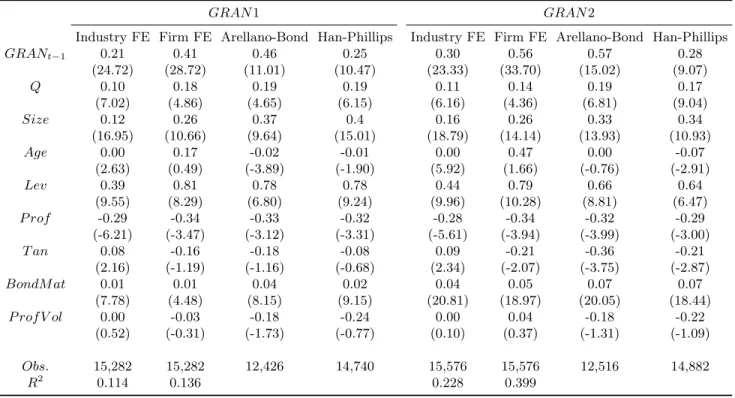
In this section, we account for the time-varying nature of target maturity dispersion and partial adjustments by estimating the following speed-of-adjustment (SOA) regression of debt granularity: ∆GRANi,t+1=γ(βXi,t−GRANi,t) +νi,t+1, (5)
where Xi,t is a vector of explanatory variables, such as Q, Size, Age, Lev, and P rof. So, βXi,t denotes target maturity dispersion and −γ is the speed of adjustment towards target dispersion.
Table 10 displays again results separately for GRAN1 and GRAN2. The first columns for
GRAN1 andGRAN2 present the OLS estimation results with industry and year fixed effects. The estimated SOA coefficients are 0.21 and 0.30 forGRAN1 andGRAN2, respectively. Economically, these estimates on lagged granularity imply that the half lives of excess granularity are between 2.94 to 1.94 years. Moreover, the estimated SOA coefficients are statistically highly significant, which indicates that firms have target granularity levels and are involved in the management of granularity.
[Insert Table 10 here]
These relatively low adjustment speeds can be due to unobservable firm-specific heterogeneity in target granularity. Following Flannery and Rangan (2006), we include firm and year fixed effects. With fixed effects, the SOA estimates increase substantially. In the second column for GRAN1, for example, the coefficient on lagged GRAN1 equals 0.41. At this high rate of adjustment, firms close the dispersion gap, on average, by 41% within one year. In untabulated results, an F-test for the joint significance of the fixed effects rejects the hypothesis that these terms are all equal, supporting heterogeneity in granularity targets.
The rapid adjustment speeds with fixed effect estimations require careful interpretation, be-cause coefficient estimates are inconsistent in a dynamic panel model with fixed effects. To address this issue, we employ panel GMM of Arellano and Bond (1991) and double-differencing estima-tion of Han and Phillips (2010) in Table 10. In the third column forGRAN1 the estimated SOA coefficient based on Arellano and Bond (1991) is 0.54, which indicates that a typical firm adjusts approximately 54% of maturity dispersion towards its target dispersion within one year. The SOA
estimate forGRAN1 based on Han and Pillips (2010) is 0.25, which is smaller than that based on Arellano and Bond (1991). These results for consistent estimates of SOA coefficients also suggest that firms manage debt granularity toward target granularity.
In addition to the SOA estimates in the first line, Table 10 provides coefficient estimates for (γβ)Xi,t, which allow us to deduce maturity dispersion targets as a function of firm characteristics. Note that the estimated dispersion targets confirm the predictions from our theory in most cases. Tobin’s Q, firm size, leverage, and profitability are reliably related to target dispersion across all the models considered in a way that is consistent with our hypotheses.
Overall, the SOA test results lead us to conclude that firms manage debt maturity dispersion. The speed with which firms make adjustments towards granularity targets is fairly high, implying that firms regard maturity dispersion management as important. Furthermore, granularity targets are explained by firm characteristics in ways that are in line with the predictions of our model and that are also consistent with the baseline results in Section 5.1.
5
Granularity Management through Bond Issuance
In this section, we provide evidence on the management of the dispersion of debt maturities through bond issuance. Specifically, we ask the following question: how important is maturity dispersion when firms determine the maturity of newly-issued bonds?
To answer this question, we investigate whether discrepancies between a firm’s pre-existing maturity profile and a benchmark maturity profile (based on firm characteristics implied by our model) explain future bond issue behavior. In other words, we conduct time-series tests, which are informative about whether newly-issued bonds’ maturities are consistent with debt maturity dis-persion management. For this purpose, we estimate a binomial choice regression for each maturity bucketj= 1,2, ...,7 for each new issue of bonds:
P rob(Iitj) =a1m1it+a2m2it+a3m3it+a4m4it+a5m5it+a6m6it+a7m7it , (6)
where Iitj is a dummy variable for bond issuance of firm i at time t and m1
it tom7it are deviations of the issuing firm’s maturity profile from its benchmark profile. The maturity buckets are defined as follows. For maturities shorter than 10 years (1≤j ≤5), there are five two-year buckets, each from 2j−1 to 2j years. For maturities longer than 10 years, there are two maturity buckets, one for 11 to 20 years and the other one for 21 years or longer.