Surendranath JORY*, Mark PERRY**, Thomas A. HEMPHILL***
Abstract: Starting in 2007, Sovereign Wealth Funds (SWFs) from Asia and the Middle East have invested billions of dollars in major U.S. financial firms. The primary driving force behind their growth is rising commodity prices, in particular oil. Given that SWFs represent a relatively new, cash-rich investment group, we studied the public policy concerns with their investments, SWFs mode of entry, and how does the market react to the investment. SWFs lack of transparency with regards to their investment motives and governance structure is cause for concern. While taking full opportunity of depressed security prices as a result of the 2007-2008 financial crisis, they are also being prudent by investing mostly in preferred stocks and fixed-income convertible securities of large U.S. corporations that are followed by many analysts and are highly liquid. Despite investing handsomely in U.S. targets and adopting a hands-off approach toward management; the liquidity crisis continues to perpetuate the decline in SWF-targets’ stock price post-investment. Using an event study parameter approach, we found the short-run market reaction to be statistically insignificant in 11 out of 12 announcements of SWF investments; but in the months following the investment, SWF-targets underperform both the S&P500 and the Dow Jones Financial Services Index Fund.
Keywords: Stock Market, Sovereign Wealth Funds (SWFs), SWF-targets’ stock price post-investment
JEL Codes:G1, G11
*
Surendranath Jory, Affiliation: Department of Finance, School of Management, University of Michigan – Flint, Email: [email protected]
**
Mark Perry, School of Management, The University of Michigan – Flint, [email protected]
*** Thomas A. Hemphill, School of Management, The University of Michigan – Flint,
Surendranath JORY, Mark PERRY, Thomas A. HEMPHILL 104
The U.S. public and federal regulators are taking a closer look at sovereign wealth funds (SWFs) as they invest generously in major U.S. firms, especially financial ones. Since 2007, SWFs from China, Dubai, Kuwait and Singapore have invested almost $50 billion in major U.S. financial firms like Citigroup, Merrill Lynch, Morgan Stanley, Bear Stearns (which has now been acquired by JPMorgan Chase), Blackstone Group, and Och-Ziff Capital Management Group (see Table 1). According to Morgan Stanley, SWFs today control more cash than the world’s hedge funds combined ($2.8 trillion vs. $1.7 trillion), and are expected to continue to grow.1 Nonetheless, SWFs are generally regarded as “not transparent,” and the public fears that these foreign government-owned investment funds could potentially be used for geopolitical gains at the expense of the U.S. – a fear echoed by the SEC Chairman as well.2
Most SWFs investing in the U.S. are based in Asia and the Middle East, and by investing in the U.S., they want to reduce their dependence on their traditional sources of export revenues. For example, by the late 1980s, the Kuwait government was earning more from overseas investments than oil sales, and the investment income served them well during the Gulf War and its aftermath.3 However, many SWFs do not report or publish their objectives, accounts, and assets and this is a cause of concern for U.S. regulators and the American public. Given that SWFs represent a relatively new, cash-rich investment group, it is important to study their objectives (i.e., to understand why they are investing in the U.S.) and economic impact (i.e., how they can influence the U.S. financial markets). This intellectual inquiry motivates our paper.
We focused specifically in this paper on the SWFs that made recent high-profile investments in the U.S., since they are the subject of considerable interest to major financial firms, regulators and politicians. Due to their lack of reporting and their involvement in many privately-negotiated deals, it was also a challenge to collect complete and comprehensive data on SWFs.
The rest of the paper proceeds as follows. In Section I, we define SWFs and list their motives and investment strategies, followed by Section II, which compares SWFs to other government-owned investment institutions. In Section III, we present a model for valuing SWFs that permits us to understand their investment behavior, and in Section IV we analyze the outstanding issues with SWFs. We evaluated the U.S. stock market reaction to SWFs’ investment in section V. In Section VI, we considered the ongoing efforts in the U.S. to improve
SWF transparency; and, in Section VII, we formulated short-term expectations about SWFs. We conclude in Section VIII.
1. DEFINITION AND MOTIVES OF SWFS
While there is not a precise definition for SWFs, the following definition is a fairly comprehensive one: “SWFs are vehicles to manage public funds”:4
x SWFs are predominantly engaged in cross-border investment seeking a higher risk-return combination than the one offered by safer investment like government bonds.
x SWFs obtain their capital mainly from foreign exchange reserves or current account surpluses.
x SWFs are controlled by their national government.
Their possible investment motives include one or more of the following: x To invest their foreign exchange reserves or current account surpluses;
x To diversify their asset holdings or invest in assets that are negatively correlated to their major exports (for example, some oil exporting nations want to diversify their nearly exclusive reliance on oil revenue; others want to limit the impact of volatile commodity prices and “smooth” revenue from exports); x To earn a higher rate-of-return than the one offered on safer investments, like
Treasury Bonds;
x To accumulate earnings to pay future obligations (for example, pension obligations);
x To learn new skills and technology from developed nations and transfer them home; and
x To influence foreign policies.
Based on an interview with the chiefs of the Kuwait Investment Authority (KIA), Dubai International Capital (DIC), and Istithmar Fund (three SWFs from the Middle East) published in BusinessWeek (January 21, 2008), we garner that SWFs invest primarily in stocks and private equity of large U.S. firms.
2. TYPES OF SWFS
SWFs can be classified as commodity versus non-commodity funds based on their sources of financing.5 “Commodity SWFs” are funded by oil or commodity export revenues and “non-commodity SWFs” are funded through transfers from
Surendranath JORY, Mark PERRY, Thomas A. HEMPHILL 106
official foreign exchange reserves. In that regard, most SWFs from the Middle East would be classified as oil “commodity SWFs,” while those from Asia would be classified as “non-commodity SWFs.”
According to researchers,6 SWFs belong to a continuum of sovereign investment vehicles that also includes central banks, sovereign stabilization funds, sovereign saving funds, government investment corporations, and government-owned enterprises, as we present in Figure 8.7 SWFs include Sovereign Stabilization Funds (designed to stabilize revenue, for example, for an oil economy the fund accumulates cash when oil revenue is high, and provides funding when oil revenue is low), Sovereign Saving Funds (acts as intergenerational funds with excess revenue/reserve saved for future generations) and Government Investment Corporations (to invest in mid to high risk-return securities abroad). Unlike central banks, SWFs do not have the day-to-day responsibility for maintaining the stability of the national currency and money supply. Therefore, most SWFs can afford to lengthen their investment horizon and assume more risk with the objective of earning high rates of return.
Sovereign Investment Vehicles: Investment Horizon
Risk Tolerance
Return on Investment
Shortest Lowest Lowest
Central Banks Ļ Ļ Ļ
Sovereign Stabilization Funds Ļ Ļ Ļ
Sovereign Saving Funds Ļ Ļ Ļ
Sovereign Wealth
Funds Government Investment Corporations Ļ Ļ Ļ
Government Owned Enterprises Ļ Ļ Ļ
Longest Highest Highest
Figure 8Types and Investment Characteristics of Sovereign Investment Vehicles
3. VALUATION OF SWFS
The Discounted Cash Flow analysis can be used to determine the value of SWFs. For example, consider a fund that invests all of its money in a project that pays cash flow CF every year for n number of years. The value of the fund is the present value of the CFs that it earns over the n number of years. The formula for valuing the fund is as follows:
¦
n t t t k CF Value 1 1 (1)whereCF represents cash flow, t is the year, n is the total number of years, and k is the required rate-of-return, or cost of capital. Usually, for a publicly incorporated fund, k is the weighted average cost of debt and equity. However, since they do not borrow money or sell stock to the public, there is neither a cost of debt nor a cost of equity for SWFs, and this allows them to charge a lower cost of capital to their investments.
Whether small or large, most private funds that borrow money face the risk of bankruptcy, and as a result, their cost of capital includes a premium for default risk. Usually, the higher the risk of default, the higher the default risk premium, and the higher the funds’ cost of capital. However, most SWFs do not borrow money and are backed by their government, so their cost of capital does not include a default risk premium8, and this permits them to supply funds at a lower required rate-of-return than a private fund.9
Referring back to Equation (1) and keeping CFt constant, a lower value for k increases the present value of the expected cash flows. This makes a given investment more valuable to SWFs than to other funds and this could explain why SWFs invest in projects that are not likely to be accepted by funds that are financed with debt and equity. The fact that SWFs can accept a lower rate-of-return implies that they are more likely to provide financing during a financial crisis than funds that are financed by debt holders and stockholders. For example, the subprime mortgage crisis in late 2007 and early 2008 increased the cost of capital for many financial firms. Since the required rate-of-return for SWFs is generally lower than the rate charged by debt holders and/or stockholders, corporations in need of financing during the credit crisis turned to the less “costly” SWFs for cash. Therefore, recent experience suggests that the SWFs can mitigate the adverse effects of a liquidity or credit crisis.
On a larger scale, SWFs facilitate the global allocation of credit and capital from countries with excess capital to firms that need capital. And not only do SWFs improve access to capital for corporations, they can make it available at a lower rate (as explained above). This, in turn, potentially increases the value of the investment for which the financing is needed.10 As a result, value is added to the SWF-financed corporation. Additionally, SWFs are predominantly passive investors and are not demanding boardroom changes or creating management upheaval in the U.S. companies they have been investing – at least so far.
Surendranath JORY, Mark PERRY, Thomas A. HEMPHILL 108
Nonetheless, there are risks associated with SWFs. One potential risk with SWFs lies in the fact that so little is known about them. Even though a SWF may assert that it is passively investing for the long-run, a change in its government or policy may alter this investment stance for economic or geo-political reasons, and a new government may want to sell some or all of the investment. Some SWFs, for example the China Investment Corp and the Kuwait Investment Authority, faced domestic critics for recent losses on their investments, hence putting some pressure on their government to sell their investments.11 If a SWF does ever decide to sell off its major holdings, the sale may potentially disrupt the market in the corporation’s securities. Next, SWFs are government-owned and managed by civil servants, so companies receiving SWF-financing have to deal with a new set of investor-bureaucrats. Moreover, equity investments by SWFs dilute the ownership of existing shareholders, hence reducing their claim on future cash flows.
4. WHAT ARE THE OUTSTANDING ISSUES WITH SWFS?
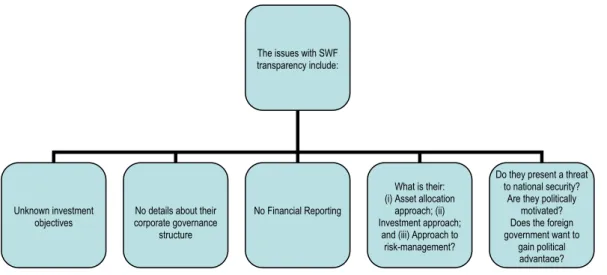
People want to know more about the investment objectives of SWFs. Much of the concern has to do with the fact that many of the cash-rich SWFs are based in countries that may not always be friendly with the U.S. Among the concerns levied against SWFs are: (i) their perceived lack of transparency with regards to their operations, wealth and corporate governance structures;12 (ii) the threat of a rival nation employing SWF capital to acquire strategic corporate assets and use them as a potential “weapon” against the U.S.; (iii) some SWFs adopt a non-traditional approach to investing. For example, many of them “bailed out” major U.S. financial firms in the subprime mortgage crisis of 2007-2008 when traditional investors did not. Investors feared that the loss caused by the credit crisis would persist and they needed more time to determine the full extent of the crisis before they committed more funds; while SWFs, on the other hand, invested generously during the crisis; and (iv) a foreign government could use a SWF to acquire proprietary knowledge, patented technology or trade secrets, and then transfer this knowledge back to the home country. According to researchers, such concerns about SWFs beg the question as to whether such investments are commercially-motivated or politically-commercially-motivated.13 We summarized more of the outstanding issues associated with SWF transparency in Figure 9.
Figure 9Issues with Sovereign Wealth Funds
5. MARKETREACTION TO SWF INVESTMENTS
To gauge the market reaction in the U.S. to investments by SWFs, we first identified the SWF investments that received the most media attention lately, by searching The Wall Street Journal, BusinessWeek, LexisNexis Academic and the SWF Institute.14 We next identified the specific dates of the first public announcements of those investments. Our first goal was to measure the return on the announcement day as an indication of market reaction. A positive return would show signs of market enthusiasm and a negative return would indicate the opposite.
Collecting such data turns out to be challenging because there is not a systematic way in which SWFs invest (see Table 1). Some SWFs buy U.S. stocks on the open market. Others invest in preferred stocks that are convertible into common stock, like Korea Investment Corporation’s $2 billion investment in Merrill Lynch convertible preferred stock, and Abu Dhabi Investment Authority’s $7.5 billion investment in a special class of high-yielding convertible stock in Citigroup.
Some SWFs participate in secondary equity offerings (see examples in Table 1, Panel C), while others participate in initial public offerings (see examples in Table 1, Panel D). We also observed cases where an investor sells stock directly to a SWF (for example, the U.S. based private-equity firm Arcapia sold its stake in Loehmann’s Holdings to Dubai’s Istithmar for $300 million in May 2006). Some
The issues with SWF transparency include:
Unknown investment objectives
No details about their corporate governance
structure
No Financial Reporting
What is their: (i) Asset allocation
approach; (ii) Investment approach;
and (iii) Approach to risk-management?
Do they present a threat to national security?
Are they politically motivated? Does the foreign government want to
gain political advantage?
Surendranath JORY, Mark PERRY, Thomas A. HEMPHILL 110
SWFs invest in private companies (for example, UAE’s Mubadala Fund paid $1.35 billion in September 2006 for a 7.5 percent stake in private equity firm Carlyle Group). Other SWFs participate in joint ventures with private equity firms (for example, in 2007, Kuwait Investment Authority invested $300 million in Texas utility TXU alongside private equity firms KKR and TPG).
Another problem obtaining complete data on SWFs is that not all announced deals are completed. Either the SWF opts out of the proposed investment (for example, China’s CITIC Securities Co. Ltd proposed investment in Bear Stearns in 2007 was subsequently withdrawn) or the deal is not yet effective.
For some SWF deals, the exact details on the amount invested or the stake purchased are not available, like Qatar Investment Authority’s acquisition of an undisclosed minority stake in Fortress Investment Group. In other cases, a revised deal is announced subsequent to the initial announcement. For example, in January 2008, MGM Mirage made a revised offer to Dubai World by offering additional shares. In other cases, the proportion of equity purchased and the proportion of voting power are not equal, such as the case of the Chinese government purchasing a 9.9 percent nonvoting stake in Blackstone. A few SWFs invest through a subsidiary under a different name, for example, Singapore Government Investment Corporation’s (SGIC) stake in Syniverse Holdings Inc., is also owned by a subsidiary of SGIC named Snowlake Investment Pte Ltd. It is also the case that there are many funds from the UAE that are investing in the U.S. and it is not clear which ones are actually SWFs. Despite the challenges outlined above, we are able to identify 15 major SWF deals in 2007 and 2008 that we present in Table 12.
A. Which SWFs Are Investing in the U.S.?
In Table 12, we present various characteristics about the target firm and the SWF acquirer in 15 SWF deals. We observe that these major SWF investments in the U.S. started in the second half of 2007 and coincided with the subprime mortgage crisis. In Panel A of Table 12 there are 12 target U.S. public corporations identified, and except for Advanced Micro Devices and MGM Mirage, all of them are financial corporations (i.e., investment advisors and/or security brokers and/or dealers) and most of them incurred major losses linked to the subprime mortgage crisis. All of the target firms are NYSE-listed, except for one NASDAQ listing, suggesting that SWFs prefer large-capitalization stocks that are frequently traded, and that benefit from increased investor recognition and enhanced liquidity. These large-cap stocks are also typically followed by many analysts and, compared to
other stocks, would contain the least amount of asymmetric information. The only non-NYSE target company in Table 12, Panel A, is NASDAQ Stock Market Inc., which is yet another major large-cap company. Panel B of Table 12 presents three Initial Public Offerings (IPOs) in which SWFs participated, and once again, we observe that the targets are major financial firms that are listed on the NYSE post-IPO.
1
Business Week, November 12, 2007.
2
Ibidem 3
G. Bahgat, “Oil Funds: Threat or Opportunity?” Oil & Gas Journal, (April 2008).
4
E. Borgne and P. Medas, “Sovereign Wealth Funds in the Pacific Island Countries: Macro-Fiscal Linkages,” Working Paper, International Monetary Fund (2007.)
5
R. Kimmitt (2008), “Public Footprints in Private Markets,” Foreign Affairs,
January/February, pp. 119-130.
6
S. Butt, A. Shivdasani, C. Stendevad, A. Wyman (2008), “Sovereign Wealth Funds: A
Growing Global Force in Corporate Finance,” Journal of Applied Corporate Finance,
Vol. 20, pp. 73-83.
7
Central Banks have short investment horizons and invest mostly in risk-free assets, like U.S. Treasury bills. Government-owned enterprises conduct business, such as manufacturing, and face real business risks.
8
There is one exception. The Dubai International Capital’s debt-to-equity ratio is approximately 4:1 (Business Week, January 21, 2008). Its lenders include HSBC, Barclays and RBS.
9
This would not apply for Pension Reserve Funds.
10
Further, SWFs that invest in convertible fixed-income securities provide additional value to corporations in the form of an interest tax shield because the fixed income paid to the SWFs is tax-deductible.
11
Wall Street Journal, February 28 and March 31, 2008.
12
This does not apply in the case of the SWF from Norway.
13
J. Aizenman and R. Glick (2007), “Sovereign Wealth Funds: Stumbling Blocks or
Stepping Stones to Financial Globalization?” Federal Reserve Bank San Francisco
Economic Letter, December.
14
The Sovereign Wealth Fund Institute (www.swfinstitute.org/aboutus.php) is an impartial organization designed to study Sovereign Wealth Funds and their impact on global economics, politics, financial markets, trade, and public policy.
S ur en d ra n at h J O R Y , M ar k P E R R Y , T h o m as A . H E M P H IL L 112 T a b le 1 2 S o ve re ig n W ea lt h F u n d s’ I n ve st m en ts i n t h e U .S . P an el A : In ve st m en ts in p u b lic ly -l is te d f ir m s D at e T ar ge t T ar ge t’s B us in es s T ar ge t E xc ha ng e A cq ui re r O rig in 25 -J ul -0 7 F or tr es s In v. G ro up L LC A ss et M an ag em en t N Y S E Q at ar In ve st m en t A ut ho rit y Q at ar 22 -A ug -0 7 M G M M ira ge R es or ts & C as in os N Y S E D ub ai W or ld U A E 20 -S ep -0 7 N as da q S to ck M ar ke t I nc . S ec ur ity & C om m od ity E xc h N as da q B or se D ub ai U A E 23 -O ct -0 7 B ea r S te ar ns C o. s In c. S ec ur ity B ro ke rs & D ea le rs N Y S E C IT IC S ec ur iti es C o. L td C hi na 16 -N ov -0 7 A dv an ce d M ic ro D ev ic es In c. S em ic on du ct or s N Y S E M ub ad al a D ev el op m en t C o. U A E 26 -N ov -0 7 C iti gr ou p In c. M on ey C en te r B an ks N Y S E A bu D ha bi In v. A ut ho rit y U A E 19 -D ec -0 7 M or ga n S ta nl ey S ec ur ity B ro ke rs & D ea le rs N Y S E C hi na In ve st m en t C or p. C hi na 24 -D ec -0 7 M er ril l L yn ch & C o. In c. S ec ur ity B ro ke rs & D ea le rs N Y S E T em as ek H ol di ng s (P te ) Lt d S in ga po re 15 -J an -0 8 M er ril l L yn ch & C o. In c. S ec ur ity B ro ke rs & D ea le rs N Y S E K uw ai t I nv es tm en t A ut ho rit y K uw ai t 15 -J an -0 8 M er ril l L yn ch & C o. In c. S ecurity Brokers & Dealers NYSE Korea In ve st m en t C or po ra tio n S ou th K or ea 15 -J an -0 8 C iti gr ou p In c. M on ey C en te r B an ks N Y S E K uw ai t I nv es tm en t A ut ho rit y K uw ai t 15 -J an -0 8 C iti gr ou p In c. M on ey C en te r B an ks N Y S E G ov er nm en t I nv . C or p. S in ga po re P an el B : In ve st m en ts in In it ia l P u b lic O ff er in g s D at e T ar ge t T ar ge t I nd us tr y T ar ge t E xc ha ng e A cq ui re r O rig in 22 -J un -0 7 B la ck st on e G ro up L LC A ss et M an ag em en t N Y S E C hi na S ta te In ve st m en t C or p. C hi na 29 -O ct -0 7 O ch -Z iff C ap ita l M gm t G rp L LC A ss et M an ag em en t N Y S E D ub ai In te rn at io na l C ap ita l U A E 7-A pr -0 8 V is a In c. B us in es s S er vi ce s N Y S E K uw ai t I nv es tm en t A ut ho rit y K uw ai t (c o n ti n u ed )
S H A N G H A I ,D U B A I ,M U M B A I O R G O O D B Y E ? T a b le 1 2 ( co n ti P an el C : In ve st m en ts in p u b lic ly -l is te d f ir m s D at e T ar ge t A cq ui re r T ra ns pa re nc y A m ou nt ( $M il. ) T ra ns ac tio n/ S ec ur ity S ta 25 -J ul -0 7 F or tr es s In v G ro up L LC Q at ar In ve st m en t A ut ho rit y 1 U nd is cl os ed P riv at el y ne go tia te d 22 -A ug -0 7 M G M M ira ge D ub ai W or ld 5 5 ,2 00 S ea so ne d E qu ity O ffe rin g & P ub lic T en de r 20 -S ep -0 7 N as da q S to ck M ar ke t I nc . B or se D ub ai 5 C ro ss In ve st C ro ss In ve st 23 -O ct -0 7 B ea r S te ar ns C o. s In c. C IT IC S ec ur iti es C o. L td 2 C r. In v. 1 ,0 00 W ith dr aw n 16 -N ov -0 7 A dv an ce d M ic ro D ev ic es In c. M ub ad al a D ev el op m en t C o. 3 6 08 S ec on da ry E qu ity O ffe rin g 26 -N ov -0 7 C iti gr ou p In c. A bu D ha bi In v. A ut ho rit y 3 7 ,5 00 C on ve rt ib le P re fe rr ed 19 -D ec -0 7 M or ga n S ta nl ey C hi na In ve st m en t C or p. 2 5 ,0 00 C on ve rt ib le P re fe rr ed 24 -D ec -0 7 M er ril l L yn ch & C o. In c. T em as ek H ol di ng s (P te ) Lt d 7 4 ,4 00 N ew ly is su ed c om m on s to ck in a p riv at e pl ac em en t 15 -J an -0 8 M er ril l L yn ch & C o. In c. K uw ai t I nv es tm en t A ut ho rit y 6 2 ,0 00 C on ve rt ib le P re fe rr ed 15 -J an -0 8 M er ril l L yn ch & C o. In c. K or ea In ve st m en t C or po ra tio n 9 2 ,0 00 C on ve rt ib le P re fe rr ed 15 -J an -0 8 C iti gr ou p In c. K uw ai t I nv es tm en t A ut ho rit y 6 3 ,0 00 C on ve rt ib le P re fe rr ed 15 -J an -0 8 C iti gr ou p In c. G ov er nm en t I nv . C or p. 6 6 ,8 80 C on ve rt ib le P re fe rr ed P an el D : In ve st m en ts in In it ia l P u b lic O ff er in g s D at e T ar ge t A cq ui re r T ra ns pa re nc y A m ou nt ( $M il. ) T ra ns ac tio n/ S ec ur ity S ta 22 -J un -0 7 B la ck st on e G ro up L LC C hi na S ta te In ve st m en t C or p. 2 3 ,0 00 In iti al P ub lic O ffe rin g 29 -O ct -0 7 O ch -Z iff C ap ita l M gm t G rp L LC D ub ai In te rn at io na l C ap ita l 5 1 ,2 50 In iti al P ub lic O ffe rin g 7-A pr -0 8 V is a In c. K uw ai t I nv es tm en t A ut ho rit y 6 8 00 In iti al P ub lic O ffe rin g
Surendranath JORY, Mark PERRY, Thomas A. HEMPHILL
114
In Table 12, Panels C and D, we present the Linaburg-Maduell transparency index, obtained from the Sovereign Wealth Fund Institute, for the SWFs investing in the U.S. The lowest rating (least transparent) a SWF can receive is a 1 and the highest (most transparent) is a 10. The Sovereign Wealth Fund Institute recommends a minimum transparency rating of 8 in order to claim adequate transparency. The mean and median transparency index for SWFs investing in the U.S. is 5, and most of them fail the Sovereign Wealth Fund Institute’s transparency minimum. Among the least transparent, we found the Qatar Investment Authority (Index = 1), China Investment Corporation (Index = 2), Abu Dhabi Investment Authority (Index =3), and Mubadala Development Company (Index = 3).
With regards to the amount invested, we found that the largest investment occurred in November 2007 when Abu Dhabi Investment Authority invested $7.5 billion in Citigroup Inc. The second highest investment was Government of Singapore Investment Corp.’s $6.88 billion investment in Citigroup Inc. in January 2008. The investments presented in Panels C and D of Table 12 total to more than $42 billion, and the average SWF investment is close to $3.5 billion.
Panel C of Table 12 shows that the most common form of transaction by SWFs is the purchase of convertible preferred securities, representing 6 out of the 12 major SWF deals in 2007-2008. Since most of the SWF investments targeted financial firms and occurred during the U.S. subprime mortgage crisis, the data suggests that SWFs adopt a prudent investment strategy in the sense that preferred stocks and other fixed-income securities are safer investments during a financial crisis, while common stocks are more sought-after during a bullish period. Most of the convertible preferred stocks issued to SWFs have mandatory conversion features within a few years (the most common conversion period occurs in three years).
The ownership stakes purchased by SWFs were all less than 10 percent, except for the transaction between Nasdaq and Borse Dubai which was for a 19.99 percent share (see Panels C and D of Table 1). In half of the 12 major transactions in Panel C of Table 12, the ownership stake purchased was less than five percent. In most cases, if a SWF (or any other investment group) holds more than five percent of a public company’s outstanding common stock, the investor would be considered a “block holder” and the company has to disclose it to the SEC in its Annual Reports and Proxy Statements. An investment below five percent also avoids a Federal Reserve investigation. In the transaction between Nasdaq and
Borse Dubai, the voting rights of Borse Dubai are limited to 5 percent, even though it bought 19.99 percent of Nasdaq’s share capital.
Although there are some advantages to minority ownership, it is not necessarily the case that all SWFs are buying minority stakes to evade regulations. A study by the consulting company Monitor Group reports that half of 420 equity investments by SWFs (for which it could trace the ownership interests) since 2000 involved purchases of majority stakes.1 Since we report a relatively large number of minority-stake acquisitions by SWFs of primarily convertible securities during a period of financial crisis (2007-2008), we cannot rule out the possibility that the recent minority-stake acquisitions were motivated more by a prudent and cautious investment strategy than by regulatory concerns. That is, the depressed security prices during a period of financial distress afforded the SWFs an opportunity to invest in the U.S. cheaply; however, the SWFs were wary of the consequences, and, consequently, invested in minority stakes.
B. Stock Market Reaction to Announcements of SWF Investment
Given the controversy about SWF investment in the U.S., we conducted an empirical investigation to measure the market reaction to the announcement of SWFs’ investments in U.S. target firms. Specifically, we attempted to answer the question: After controlling for the overall return on the market around the time of an announcement, do SWF investments have any significant impact, either positive or negative, on the stock returns of their targets? To answer this question, we used the event parameter approach whereby the market model is augmented by adding a dummy variable to identify the event period as follows:
t mt
t R d
R
D
E
J
H
(2)where Rt is the stock return on day t, Rmt is the return on the S&P500 on day t,d
is the Event Dummy that takes a value of 1 for the event window [-1,0,+1] and 0 otherwise, where day 0 is the day the SWF investment is announced. The model was estimated using daily returns starting 30 days prior to the event day 0 and ending 30 days following the event day 0. The return on the S&P500 was used as a proxy for market return. Stock price data were collected from the Global Financial
Database. We have presented the results in Panel A of Table 13.
1
S u re n d ra n at h J O R Y , M ar k P E R R Y , T h o m as A . H E M P H IL L 1 1 6 T a b le 1 3 M a rk et r ea ct io n t o I n ve st m en ts b y S o ve re ig n W ea lt h F u n d s P an el A : In ve st m en ts in p u b lic ly -l is te d f ir m s T hi s ta bl e sh ow s th e re su lts o f r un ni ng th e ev en t p ar am et er a pp ro ac h w he re th e m ar ke t m od el is a ug m en te d by a dd in g a du m m y va ria bl e to id en tif y th e ev en t p er io d. T he m od el is a s fo llo w s: t mt t d R R
H
J
E
D
w he re t R is th e st oc k re tu rn o n da y t , mt R is th e re tu rn o n th e S & P 50 0 o n da y t , d is th e E ve nt D um m y th at ta ke s a va lu e of 1 fo r th e ev en t w in do w [-1, 0, +1 ] a nd 0 o th er w is e, w ith d ay 0 is th e da y th e S W F in ve st m en t i s fir st an no un ce d to th e m ar ke t. T he m od el is e st im at ed u si ng d ai ly r et ur ns s ta rt in g 30 d ay s pr io r to th e ev en t d ay 0 a nd e nd in g 30 d ay s fo llo w in g th e ev en t d ay 0 . T he r et ur n on th e S & P 50 0 is u se d as th e pr ox y fo r m ar ke t r et ur n. S to ck p ric e da ta a re c ol le ct ed fr om th e G lo ba l F in an ci al D at ab as e . T he s ym bo l * ** d en ot es s ta tis tic al s ig ni fic an ce a t t he 5 p er ce nt le ve l o r be tte r. P ar am et er E st im at e (S ta nd ar d E rr or ) D at e T ar ge t A cq ui re r S P 50 0 E ve nt D um m y F V al ue A dj us te d R 2 25 -J ul -0 7 F or tr es s In ve st m en t G ro up L LC Q at ar In ve st m en t A ut ho rit y 1. 14 98 2* ** (0 .3 56 68 ) -0 .0 35 63 (0 .0 20 02 ) 8. 55 ** * 0. 19 85 22 -A ug -0 7 M G M M ira ge D ub ai W or ld 0. 69 05 5* ** (0 .1 88 58 ) 0.04567*** (0.0 10 80 ) 16 .6 6* ** 0. 33 92 20 -S ep -0 7 N as da q S to ck M ar ke t I nc . B or se D ub ai 0. 79 63 9* ** (0 .2 20 91 ) -0 .0 06 92 (0 .0 11 68 ) 6. 64 ** * 0. 15 60 23 -O ct -0 7 B ea r S te ar ns C o. s In c. C IT IC S ec ur iti es C o. L td 1. 66 76 2* ** (0 .2 26 91 ) -0 .0 12 25 (0 .0 12 84 ) 27 .1 8* ** 0. 46 19 16 -N ov -0 7 A dv an ce d M ic ro D ev ic es In c. M ub ad al a D ev el op m en t C o. 0. 89 70 3* ** (0 .2 47 78 ) 0. 01 27 1 (0 .0 14 38 ) 6. 63 ** * 0. 15 59 26 -N ov -0 7 C iti gr ou p In c. A bu D ha bi In v. A ut ho rit y 1. 47 58 0* ** (0 .1 81 17 ) -0 .0 02 33 (0 .0 11 02 ) 33 .2 5* ** 0. 51 40 19 -D ec -0 7 M or ga n S ta nl ey C hi na In ve st m en t C or p. 1. 59 69 7* ** (0 .2 09 47 ) 0. 00 75 7 (0 .0 14 23 ) 29 .7 0* ** 0. 48 48 24 -D ec -0 7 M er ril l L yn ch & C o. In c. T em as ek H ol di ng s (P te ) Lt d 1. 92 49 1* ** (0 .2 21 68 ) -0 .0 20 02 (0 .0 14 58 ) 37 .7 0* ** 0. 54 61 15 -J an -0 8 M er ril l L yn ch & C o. In c. K uw ai t I nv es tm en t A ut ho rit y 1. 79 25 5* ** (0 .2 41 73 ) 0. 01 47 4 (0 .0 14 54 ) 27 .5 6* ** 0. 46 55 15 -J an -0 8 M er ril l L yn ch & C o. In c. K or ea In ve st m en t C or po ra tio n 1. 79 25 5* ** 0. 01 47 4 27 .5 6* ** 0. 46 55S H A N G H A I ,D U B A I ,M U M B A I O R G O O D B Y E ? P ar am et er E st im at e (S ta nd ar d E rr or ) D at e T ar ge t A cq ui re r S P 50 0 E ve nt D um m y F V al ue A dj us te d 15 -J an -0 8 C iti gr ou p In c. G ov er nm en t I nv . C or p. 1. 61 88 6* ** (0 .1 78 36 ) -0 .0 15 28 (0 .0 10 72 ) 43 .6 8* ** 0. 58 32 P an el B : In ve st m en ts in In it ia l P u b lic O ff er in g s In th is p an el , w e ca lc ul at e th e fir st -d ay u nd er pr ic in g of IP O s in w hi ch S W F s pa rt ic ip at ed . T he fo rm ul a us ed to c om pu te u nd er pr ic in g is a s fo llo w s: [C lo si ng P ric e on fi rs t d ay o f t ra di ng – O ffe r P ric e] /O ffe r P ric e. A p os iti ve fi gu re r ep re se nt s un de rp ric in g w hi le a n eg at iv e fig ur e re pr es en ts o ve rp ric in g. D at e T ar ge t A cq ui re r O ffe r P ric e C lo si ng P ric e U nd er pr ic in g 22 -J un -0 7 B la ck st on e G ro up L LC C hi na S ta te In ve st m en t C or p. $ 2 9. 61 $ 3 5. 06 18 .4 3% 29 -O ct -0 7 O ch -Z iff C ap ita l M gm t G rp L LC D ub ai In te rn at io na l C ap ita l $ 3 2. 00 $ 3 0. 12 -5 .8 8% 7-A pr -0 8 V is a In c. K uw ai t I nv es tm en t A ut ho rit y $ 4 4. 00 $ 5 6. 50 28 .4 1%
Surendranath JORY, Mark PERRY, Thomas A. HEMPHILL
118
Out of the 12 SWF investments, the coefficient of the event dummy is statistically significant at conventional levels in only one case, that of Dubai World’s $5.2 billion investment in MGM Mirage. The latter is a casino giant and $2.7 billion of the investment would be used as a joint-venture in a major Las Vegas project. The investment was not related to the financial crisis in the U.S. during that period. It is possible that the expected costs due to financial distress weigh heavily on most of the target firms receiving SWF investments in 2007 and 2008. According to the Signaling theory of capital structure, firms with uncertain prospect would be willing to sell equity to raise cash. Based on the Pecking Order Hypothesis, firms with limited retained earnings, few marketable securities, and exhausted borrowing capacity are most likely to sell convertible securities and/or common stock.
In Panel B of Table 13, we analyzed the market reaction to IPOs in which SWFs participated. We measured the market reaction as the difference between the offer price to the SWF and the closing price on the first day of trading. Usually, the offer price is lower than the closing price. Underpricing would generally suggest market interest in an IPO. With underpricing averaging 12 percent starting in 2001 (following the Internet bubble years), the IPO deals to China Investment Corp. (underpricing of 18 percent) and Kuwait Investment Authority (underpricing of 28 percent) appear to be profitable ones.1 Given that SWFs are actively looking for investments in large, liquid, well-known organizations that trade on large exchanges, the marketing efforts and costs involved in selling the IPO of Blackstone Group LLC and Visa Inc. to SWFs could be low.2 As a result, the IPO firms were able to share some of the savings by offering lower offer prices to SWFs.
C. Short- to Medium-term Performance of Targets Following Investment by SWFs
In Table 14 we present the short- to medium-term stock performance of SWF targets. On average, the targets’ stock price performance is negative in the months following SWF investments. A “Buy and Hold Return” is also calculated as follows:
1
Re
1
1 » ¼ º « ¬ ª
m n n m turn BHR (3)whereBHRm is the Buy and Hold Return up to month m and Returnn is the return for month n. The results displayed in Table 14 show that the mean BHR is negative 7 percent for the first month, and decreases to negative 64 percent by the end of month 11. In other words, an investor, who buys the target firm’s stock upon announcement of the SWF investment, and holds it for the next 11 months, would lose 64 percent on her investment. The corresponding period mean BHR on the
S&P500 in negative 21 percent. In Panel B of Table 14, we show the short- to
medium-term performance of IPOs in which SWFs participate. The results suggest that, on average, the stock price performance is mostly negative in the months following the IPO. The average BHR for the 12 months following the IPO is negative 16 percent. We also present corresponding returns on the S&P500 for comparison purposes. We observe that, on average, the target firms underperform
theS&P500.
The above short- to medium-term underperformance suggests that, to many investors, SWF investments do not improve the firm’s outlook. Most SWF investments between mid-2007 and early-2008 were in financial firms, and that period coincides with the subprime mortgage crisis that continues to negatively affect financial firms in the U.S. today. The period also coincides with a negative outlook for the U.S. economy. It appears that investors do not believe that investments from SWFs were sufficient to overturn the negative effects of the credit crunch and a depressed economy.
In his speech at the American Enterprise Legal Center for the Public Interest
on December 5, 2007, the SEC Chairman Christopher Cox noted that: “If ordinary investors … come to believe that they are at an information disadvantage when they compete head-to-head in markets with governments, confidence … could
collapse…” The negative stock price performance following investments by SWFs
would seem to support the Chairman’s observation.
1
T. Loughran and J. Ritter, “Why Has IPO Underpricing Changed Over Time,” Financial Management, Vol. 33, pp. 5-37, (2004).
2
S u re n d ra n at h J O R Y , M ar k P E R R Y , T h o m as A . H E M P H IL L 1 2 0 T a b le 1 4 S h o rt - to M ed iu m -t er m p er fo rm a n ce o f ta rg et s fo ll o w in g i n ve st m en t b y S o ve re ig n W ea lt h F u n d
VI. THEGOVERNANCE STRUCTURE FOR SWFS IN THE U.S.
Given that SWFs are government-owned, their political risks cannot be discounted. However, the U.S. has no interest in turning them away. The U.S. Treasury acknowledges that SWFs have helped to stabilize financial companies reeling from the subprime mortgage debacle.1 In this section, we consider how existing measures can lessen some of the concerns associated with SWFs. First, the U.S. President has the authority to block any M&A deal that represents a threat to national security under the “Exon-Florio Amendment.” Second, the Amendment also establishes the U.S. Committee on Foreign Investment, which advises the President to block any foreign investment that poses a threat to national security. The presence of this Committee served as a threat to China National Offshore Oil Corporation’s attempt to acquire Unocal.2 The bid had to be aborted because of its political ramifications. Third, the U.S. Department of Treasury is working with SWFs to formulate governance-principles including: (i) SWF investments should be commercially-motivated, (ii) SWFs should disclose purpose and objectives, (iii) SWFs should install governance structures, internal controls, and risk management systems, (iv) SWFs should compete fairly with the private sector, and (v) SWFs should comply with host-country regulatory and disclosure requirements.3
Some researchers argue that the World Trade Organizaton (WTO) and the International Monetary Fund (IMF) can work together in monitoring SWFs.4 Others suggest that a vote suspension for SWF equity investments will allay political fears.5 At the international level, the IMF is taking a lead role in identifying best practices for SWFs in areas like governance, transparency, and accountability (see Badian and Harrington).6 Establishing an IMF-led code of best corporate governance practices will offer an international “baseline” of responsible SWF managerial practices; yet it will be voluntary in nature.
VII. THEOUTLOOK FOR SWFS
The primary driving force behind the growth in SWFs is the increase in commodity prices, in particular oil. As Figure 10 demonstrates, high oil prices have given oil-exporting countries (also referred to as the Petro Power) new financial heft.7 Hence, SWFs are primed to promote the international flow of capital.
Lately, the Petro Power has been targeting U.S. firms, especially big ones.8 It is possible that they want to invest in markets that rate highly on corporate
Surendranath JORY, Mark PERRY, Thomas A. HEMPHILL 122
governance, shareholder rights, and financial regulations, and will therefore continue to show a preference for big U.S. corporations.
Figure 10The Wealth Power of Oil-producing Nations
Source: Gerald F. Seib, “Pump-Price Shock Blurs National Security Issue,” The Wall Street Journal, July 8, 2008, p. A2. Reproduced with permission from Gerald F. Seib. [Insert Figure 3 here]
La Porta et al. show how investors prefer markets that provide better protection for their rights.9 Institutional investors around the world prefer to invest in stocks of large firms (to mitigate concerns about liquidity and transaction costs) that are located in markets with high disclosure.10 In particular, non-U.S. institutional investors prefer to invest in stocks that comprise the MSCI World Index (a leading index used in international asset management). Such stocks have worldwide recognition and are followed by many analysts. Furthermore, foreign institutions prefer non-dividend paying stocks perhaps because of tax withholding concerns,11 and Warnock and Cai find that foreign institutional investors prefer U.S. firms with global operations.12
Using the Ferreira and Matos classification of institutional owners, we classify SWFs as “Grey Institutional” owners, alongside bank trusts, insurance companies, pension funds and endowments. Grey Institutional owners tend to be passive (unlike independent institutional owners that include mutual fund managers
and investment advisers) and are less likely to react when management actions are not necessarily maximizing shareholders’ wealth.13 We also note that some SWFs are investing to gain access to new skills and technology. For example, the Dubai Group invested in NASDAQ, partly so that NASDAQ could take a stake in the Dubai exchange, and enable the latter to use the NASDAQ brand and the OMX trading technology.14
VIII. CONCLUSION
Since the summer of 2007, Middle East and Asian SWFs have received heightened media attention and public policy scrutiny in the U.S., since they have been involved in the purchase of minority equity positions in major U.S. public corporations. These concerns arise because of a perceived lack of transparency of SWF operations and their corporate governance structures, and the fear that a rival nation could use SWF capital to acquire strategic corporate assets and turn them into geo-political “weapons” against the host country. However, the controversial issues of SWF transparency and corporate governance are being actively addressed by the U.S. government and international economic and finance organizations.
In this paper, we argue that SWFs can supply funds at a lower required rate-of-return compared to non-government-owned funds. This, in turn, increases the net worth of the projects for which the investments were sought. Moreover, recent experience in the U.S. suggests that SWFs can mitigate the adverse effects of a liquidity crisis. While depressed security prices during a liquidity crisis afford SWFs an opportunity to invest cheaply, they adopt a prudent approach by investing in minority stakes and/or preferred stocks and/or fixed income convertible securities. On a larger scale, SWFs facilitate the global allocation of capital from countries with excess capital to firms that need the capital.
We also focus on two empirical questions of research interest. First, how does the market react to announcements of SWF investment in U.S. companies? Second, what is the short- to medium-term performance of these companies post-SWF investment? We run an event study parameter approach whereby the market model is augmented by a dummy variable representing the announcement to answer the first question, and we calculate short- to medium-term buy-and-hold returns to answer the second question. The statistical results show that the market reaction is statistically insignificant in 11 out of 12 cases during an event window that includes the day prior to, the day, and the day following the announcement of a
Surendranath JORY, Mark PERRY, Thomas A. HEMPHILL 124
SWF investment. We also find that in the eleven months following an SWF investment, the target’s stock price declines by 63.77 percent on average, and underperforms both the S&P500 (-21.49 percent) and the Dow Jones Financial
Services Index Fund (-42.85 percent) over the corresponding period. Therefore,
SWF investments did not halt the downturn in the target financial firm’s stock price caused by the U.S. liquidity crisis in 2007-2008.
1
Wall Street Journal, June 06, 2008.
2
R. Gilson and C. Milhaupt, “Sovereign Wealth Funds and Corporate Governance: A
Minimalist Response to the New Merchantilism,” Stanford Law and Economics Olin
Working Paper, No. 355, (March 2008).
3
U.S. Department of the Treasury, “Treasury Reaches Agreement on Principles for
Sovereign Wealth Fund Investment with Singapore and Abu Dhabi (HP-881),” Press
Release, Washington D.C. (March 20, 2008).
4
A. Mattoo and A. Subramanian, “Currency Undervaluation and Sovereign Wealth Funds: A New Role for the World Trade Organization,” Working Paper, The Peterson Institute for International Economics Working Paper (2008).
5
R. Gilson and C. Milhaupt, “Sovereign Wealth Funds and Corporate Governance: A
Minimalist Response to the New Merchantilism,” Stanford Law and Economics Olin
Working Paper, No. 355, (March 2008).
6
L. Badian and G. Harrington, “The Politics of Sovereign Wealth: Global Financial
Markets Enter a New Era,” The International Economy: The Magazine of International
Economic Policy, pp. 52-55, (2008).
7
Wall Street Journal, July 8, 2008.
8
The Economist, January 17, 2008.
9
R. La Porta, F. Lopez-de-Silanes, A. Shleifer, and R. Vishny, “Law and Finance,” Journal of Political Economy, Vol. 106, pp. 1113–1155, (1998).
10
M. Ferreira and P. Matos, “The Colors of Investors’ Money: The Role of Institutional Investors Around the World,” Journal of Financial Economics, Forthcoming.
11
M. Dahlquist, and G. Robertsson, “Direct Foreign Ownership, Institutional Investors, and
Firm Characteristics,” Journal of Financial Economics, Vol. 59, pp. 413–440, (2001),
and J. Ammer, S. Holland, D. Smith and F. Warnock, “Look at Me Now: What Attracts U.S. Shareholders?” Federal Reserve Board of Governors Working Paper (2005).
12
F. Warnock and F. Cai, “International Diversification at Home and Abroad," International Finance Discussion Paper No. 793, http://ssrn.com/abstract=509743 (December 2004).
13
A. Almazan, J. Hartzell and L. Starks, “Active Institutional Shareholders and Cost of Monitoring: Evidence from Executive Compensation,” Financial Management Vol. 34, pp. 5–34, (2005), and J. Brickley, R. Lease, and C. Smith, “Ownership Structure and
Voting on Antitakeover Amendments,” Journal of Financial Economics, Vol. 20, pp.
267–292, (1988).
14