Measuring the Banking Performance Based on Balanced
Scorecard for Conventional (State) Banks in Indonesia
Amrizal Mohammad Sumun, PhD candidate
Faculty Economics and Muamalat, Universiti Sains Islam Malaysia & Lecturer, Economic Faculty of Ahmad Dahlan College
Associate Professor Dr Zurina Shafii
Faculty of Economics and Muamalat & Research Fellow, Islamic Finance and Wealth Management Institute (IFWMI), Universiti Sains Islam Malaysia, Nilai, 71800, Negeri Sembilan
Dr. Nurul Aini Mohamed, Senior Lecturer
Faculty of Economics and Muamalat, Universiti Sains Islam Malaysia, Nilai, 71800, Negeri Sembilan
Abstract
This study, we measured of banking performance based on four perspectives balanced scorecard namely job satisfaction, internal business process, customer satisfaction and financial, where each variable is affected by the five indicators as follows: (1) Job satisfaction is affected by indicator achievement, recognition, work It’s self, responsibility and advancement. (2) Internal business process is affected by the operating indicator of queuing systems, speed and responsiveness staff, staff skills and competence, customer complaints and self services technology. (3) Customer satisfaction is influenced by the indicator tangible, reliability, responsiveness, assurance, and empathy.(4) Perspective financial consists of capital adequacy ratio, productive asset quality, earnings, liquidity and sensitivity. Research result the performance of conventional bank as follows: Firstly, partially that job satisfaction, internal business process and customer satisfaction has a very strong relationship and its positive direction. Secondly, conventional bank simultaneously is proven a significant relationship between the variables of job satisfaction, internal business process and customer satisfaction towards financial perspective. Structure Equation Model (SEM) was obtained as follows: financial = 0,308 JS + 0,519 IBP + 0,197 CS.
Keywords: Balanced scorecard, State Banks , Performance
1. Introduction
Banking industry is one of the institutions thatplay an important role in running of economic activity of a state. The bad governance of the banking industry makes banking performance fell considerably, and created a crisis of confidence in the banking system. Consequently, many customers withdrew their money, which caused some rush massively. According to (Bank Indonesia, 1999) as a manifestation of a crisis of confidence, as a result of the crisis, there are many banks have difficulties in liquidity (mismatch) which is followed by liquidity crunch. This situation was aggravated by raising interest rates interbank in money market that reached 300% pa.
The banking practises in Indonesia is not professionally managed, due to a lot of financing to customers done incorrectly (collusion) in management level, such as financing to customers over limit, financing to customers due to recommendation of certain official authority, so that bank managers do not give credit basing on procedures yet it is based on corruption, collusion, and nepotism. (Aziz.A, Monday, 24 June 2013 lipotan 6 http://bisnis.liputan6.com) Bank Mega, constituting a dispute regarding the case of the loss of the funds belonging to, respectively, PT. Elnusa and the Batu Bara District Government of North Sumatra, meanwhile the banks owned by the businessman,Tanjung.C was discovered as facing up to the claim to Rp 111 billion submitted by PT Elnusa, and another Rp 80 billion claim by Batu Bara District Government against the Bank Mega.
That statement can be proved from the financial services authority (FSA) of 2012 as (Setiadi.E, 26 September 2012,http://www.republika.co.) states that there are 47 banks whose licenses have been revoked for seven years. This revocation was all due to the problem of fraudulence (fraud) committed by the owner or management of the banks. In 2013 a case-by-case event occurred as quoted by MetroTV interview held with (Aziz.A Deputy Chairman of House of Representatives Commission XI, Repulic Indonesia http://bisnis.liputan6.com 24/06/2013), saying there were four troubled banks: Bank Mega, Bank Jabar Banten, Bank Panin and Bank Mestika Dharma.
Based on the above facts, researcher is interested in doing the research based on balanced scorecrad. This research is not only to evaluate the financial performance, but also the wider aspects related to it, such as aspects of internal business process, employees and customers.
Based on the facts above, the compiled research purposes as follows: 1) To determine the factors that effect of job satisfaction of conventional in Indonesia. 2) To determine the factors that influence of Internal
business process of conventional banking in Indonesia. 3) To determine the factors that influence of customer satisfaction conventional banking in Indonesia. 4) To determine the effect job satisfaction, Process business internal toward customer satisfaction of conventional bank in Indonesia. 5) To determine the effect job satisfaction, Process business internal and customer satisfaction toward Banks soundness of conventional bank in Indonesia.
2. Theoretical Banckround and Hypothesis 2.1 Stakeholder Theory
The stakeholder theory was for the first time conceived by (Charles F et al, 2006) the traditional definition of a stakeholder is any group or individual who can affect or is affected by the achievement of the corporation’s objectives. Base on the definition, it means a group or an individual capable of affecting or being affected by the organization or corporation in their effort to achieve the corporation’s objective.
A stakeholder is an individual or a group who has a direct interest in the organization, such as an investor, shareholder or a creditor, however such paradigm has changed in line with the business development which is very complex and in the cut-throat business competition.
In the modern management view, an organization should not be focused in the interest of shareholders or investors in order to seek maximal profit, but there are many other parties that need attention to make organization gain the maximum long-term profit.
In one of the latest definitions, cited (Charle F et al, 2006) defines stakeholders as those groups who are vital to the survival and success of the corporation. According to Irawan (2009) who says that Stakeholder constitutes an individual, a group of men, community and their interest to the corporation.
From the above-mentioned definition, it can be underlined that stakeholder is any individual or group who has interest in the corporation. The key word is “having interest”. If such word is further described, a stakeholder consists of employees, management, shareholders, board of commissioners, audit committee, consumers, community living near the corporation, non-governmental organizations, press, and government. The interest of such parties in the corporation is not equal. Such interest and concern can be classified by direct and indirect interest, internal and external interests, primary and secondary interest.
Gray et al cited by Chariri (2012) says that the viability of a corporation considerably much depends on the stakeholder’s support, and such support should be sought. It is task for the corporation to seek for such support. The more powerful the stakeholder is, the greater the effort of the corporation in its adaptation. Social disclosure is regarded as a part of dialogue between the corporation and the stakeholders.
In Clarkson’s opinion, as contained in centre for business ethics (1999) quoted by Irawan (2009) stakeholders of a corporation are divided into two main forms; they are primary and secondary stakeholders. Primary stakeholders constitute the parties who economically have interest in the corporation and who bear the risk, such as investors, creditors, employees, local communities. But, on other hand, the government is also included in the primary stakeholder group even though it does not directly and economically have relationship. Nevertheless, the relationship between both of them is non-contractual in nature. The second form is secondary stakeholders where the nature of their relationship is mutually affecting, but the corporation viability is not economically determined by this type of stakeholder.
Stakeholder theory is in line with balanced scored card that the corporation’s performance is measured based on so many perspectives. Stakeholder theory can be measured with balanced scorecard as both have the same views Chariri (2012) Stakeholder Theory says that a corporation is not an entity that operates just for its own interest, instead it must provide benefits to its stakeholders (shareholders, consumers, suppliers, government, community, analysts and other parties).Chapra and Ahmed, 2002) in their research on corporate governance of IFIs emphasize on the notion of equitably protecting the rights of all stakeholders irrespective of whether they hold equity or not
2.2 Hypothesis Development 2.2.1 Job Satisfaction
Job satisfaction as construct variable or latent independent variable consists of five indicator variables, they are: (1) achievement, (2) recognition, (3) work itself, (4) responsibility, (5) advancement. To respond the problem formulation written in the first chapter,”What are the factors that effect job satisfaction toward Islamic and convenstional banks in Indonesia?, the researchers develop a hypothesis of employee’s satisfaction as follows:
H1: There is a positive relationship between achievement, recognition, work itself, responsibility, advancement toward job satisfaction
2.2.2 Internal Business Process
Queuing problem is a serious thing to get the attention of management, because if the customers have to wait in a long time it will be a disappointment. Customer disappointment can be fatal to the bank, so the customer may be transferred to another bank. However, if the bank provides the infrastructure that many, if not balanced by the
number of customers, the bank is not efficient. Sometimes customers only crowded on certain days or at certain hours. Therefore, banks need to consider how much counter to be opened and how many facilities and infrastructure that have to be provided
Understanding of waiting lines and learning, how to manage them is one of the most important areas in banking operations management. Quoted (Davis M.M and Maggard.M.J, 1990) The central problem in virtually every waiting line situation is a trade-off decision. The manager must weigh the added cost of providing more rapid service (more traffic lanes, additional landing strips, more checkout stands) against the inherent cost of waiting.Frequently; the cost trade-off decision is straightforward. For example, if we find that the total time our employees spend in the line waiting to use a copying machine would otherwise be spent in productive activities; we could compare the cost of installing one additional machine to the value of employee time saved. The decision could then be reduced to dollar terms and the choice easily made.
Quoted (Davis M.M and Maggard.M.J, 1990) the shows arrival at a service facility (such as a bank) and service requirements at that facility (such as tellers and loan officers). One important variable is the number of arrivals over the hours that the service system is open. From the service delivery viewpoint, customers demand varying amounts of service, often exceeding normal capacity. We can control arrivals in a variety of ways. For example, we can have a short line (such as a drive-in at a fast-food restaurant with only several spaces), we can establish specific hours for specific customers, or we can run specials. For the server, we can affect service time by using faster or slower servers, faster or slower machines, different tooling, different material, different layout, faster setup time, and so on.
H2: There is a positive relationship between operating of queuning system, staff speed and responsiveness, staff skill and competence, customer complain, self services technoloy toward internal business process
2.2.3 Customer Satisfaction
According to (Kotler, 2002) there are some method that can be used in ach company to measure or monitor customer satisfaction. They are: (1) Complain and suggestion system. Each customer oriented organization has to provide the opportunity, easy and convenient access for its customers to provide complain and suggestion. The media usually used include suggestion box placed in the strategic places, comment card, special free telephone line, etc. Information gathered by these methods can give the company ideas and new valuable colour. (2) Ghost shopping. This method is implemented by employing some people (ghost shoppers) to take a part or place themselves as potential product buyers of the competitor company. Then ghost shopper informs findings of the strength and weakness of the company or competitor company based on their experience in buying the products. (3) Lost customer analysis. The company is expected to contact its customer who leaves the company or those who has changed the vendor. They are expected to give information of the cause of their dissatisfaction towards the company. (4) Survey of customer satisfaction. The customer satisfaction can be identified by a survey, either by post, telephone or personal interview.
By using the survey, the company will obtain the response and feedback directly from the customers as well as the positive sign that the company gives special attention to their customers.This research uses the survey method of customer satisfaction through the submission of questionnaires to the bank customers. There are five variables of customer satisfaction, the tangible, reliability, responsiveness, assurance and empathy. So, the problem formulation designed is how they affect the customer satisfaction in Islamic and conventional banks in Indonesia. To answer this question, the researcher designs five research hypotheses as follows:
H3: There is a positive relationship between tangible, reliability, assurance. responsivess emphaty
toward customer satisfaction 2.2.4 Bank Soundness
How to increase the soundness of conventional and syariah banking based on financial ratio of capital, assets, equity, liability and sensitivity (CAELS)? Banking performance can be evaluated from several aspects, one of which is based on financial aspect that is financial statements of the bank. Based on the financial statement, we can count number financial ratios which can be used as a base of measurement of bank soundness levels. Ratio analysis enables the management to identify the main changes in value trend, the relationship and the reason of those changes. The result of financial statement analysis will help interpret various key relationships and the tendency that can give basic consideration over the potential success of company in the future.
CAMEL model ratio consists of capital, asset quality, management, earning and liquidity. Based on the (Bank Indonesia regulation no.6/10/PBI/2004) about the assessment system of conventional bank soundness levels and the regulation of (Bank Indonesia No.9/1/PBI/2007) about assessment system of syariah bank soundness level, the capital component used to evaluate the bank equity adequacy ratio in safeguarding risk exposure and anticipate risk exposure that may happen.
The component of asset quality used to evaluate the bank asset condition, including anticipation of failing-to-pay risk from credit risk. The component of management is used to evaluate the managerial performance of the bank executives in running the business against the general principles of management,
adequacy of risk management and bank compliance over conditions related to prudent principle and syariah principle and its commitment to Bank Indonesia.
The component of earnings is used to evaluate the ability of the bank in generating profit, whereas liquidity component is used to anticipate the risk of liquidity that may occur. For this research, modification of items is needed, that is, to remove
H4: There is a positive relationship between Job satisfaction, Internal business process toward
customer satisfaction.
H5: There is a positive relationship between Job satisfaction, Internal business process, and customer satisfaction toward banks soundness.
3. Methodology
This research is conducted from 2012 up to 2014. Population in this reseacrch is conventional banking in Indonesia, and selected samples are based on purposive sampling. Conventional bank selected is Bank Mandiri, Bank Negara Indonesia, Bank Rakyat Indonesia.
Instruments used in this research consists of three kinds: Firstly, questionnaire. It is used to get data of job satisfaction and customer satisfaction. Secondly, observation. It is used to observe the services to customers as internal business process in the bank. Thirdly, documentation of monthly financial statement which is downloaded from the site of Bank Indonesia from January 2002 until June 2014. There are 450 respondents involved in the questionnaire instrument and for observation.
Data analysis in this research used structural equation model-path least square (SEM-PLS) which consists of outer and inner models. The test conducted over outer model is average variance extracted (AVE) and composite reliability. Whereas, the inner model test used estimate for path coefficients. According to (Ghozali, 2011) Path least square (PLS) approach is distribution free (not assuming certain distributive data. It can be nominal,category, ordinal, interval and ratio). Quote (Monecke.A and Leisch.F, 2012) The partial least squares (PLS) approach to SEM an alternative to covariance-based SEM, which is especially suited for situations when data is not normally distributed.
Operational steps SEM using PLS as follows:
1) Outer models (Model Measurement), this model specifies the relationship between latent variables with their indicators. or it can be said that the outer model defines how each indicator relates to latent variables. Tests conducted on outer models:
a. Composite Reliability. Data that has composite reliability> 0.8 has high reliability. b. Average Variance Extracted (AVE). AVE expected value> 0.5.
2) Inner Model (Model structural) Structural model test conducted to test the relationship between latent constructs. There are several tests for the structural model, namely:
a. R Square on endogenous constructs. R Square value is coefficient of determination on endogenous constructs. According to (Chin, W. W.and Dibbern. J, 2009) R square value of 0.67 (strong),0:33, (moderate) and 0:19 (weak).
b. Estimate for Path Coefficients, is a path coefficient value or magnitude of the relationship / influence latent constructs. Conducted with Bootrapping procedure.
Prediction relevance (Q square) or known as the Stone-Geisser's. This test is done to determine the predictive capabilities with blinfolding procedure. If the value obtained 0:02 (minor), 0:15 (medium) and 0:35 (large). Can only be done for endogenous constructs with reflective indicators.
4. Research Result
Quote (Wong .K.K, 2013)There are two submodels in a structural equation model; the inner model specifies the relationships between the independent and dependent latent variables, whereas the outer model specifies the relationships between the latent variables and their observed indicators. In SEM, a variable is either exogenous or endogenous. An exogenous variable has path arrows pointing outwards and none leading to it. Meanwhile, an endogenous variable has at least one path leading to it and represents the effects of other variable
4.1 Outter Model
Outer models (Model measurement), this model specifies the relationship between latent variables with their indicators. or it can be said that the outer model defines how each indicator relates to the latent variables. In this study, there are three constructs that need to analyze second order, namely job satisfaction, internal business processes and customer satisfaction
4.2 Square Root of Average Variance Extracted(AVE).
The method discriminant validity to justify discriminant validity is by seeing its square root of average variance extracted (AVE). According (Wong.K.K, 2013) to check convergent validity, each latent variable’s. Average
variance extracted (AVE) is evaluated., it is found that all of the average variance extracted values are greater than the acceptable, threshold of 0.5, so convergent validity is confirmed. Here are the average variance extracted values in this study,as follows:
Table 1: Average Variance Extracted (AVE) Construct of Job Satisfaction, Internal Business Process and Customer Satisfaction.
Job satisfaction Internal business process Customer satisfaction
Constructs AVE Constructs AVE Constructs AVE
JS 0.4044 IBP 0.5556 CS 0.5388 JS1 0.5785 IBP1 0.6652 CS01 0.6495 JS2 0.6825 IBP2 0.6794 CS02 0.7275 JS3 0.6099 IBP3 0.6820 CS03 0.7659 JS4 0.7189 IBP4 0.6086 CS04 0.7365 JS5 0.7066 IBP5 0.7374 CS05 0.6722
The above table shows the value of average variance extracted (AVE) over 0.5 for all dimensions (indicators) which is derived from the model of this research. It means all indicators are confirmed as valid.
4.3 Composite Reability Test
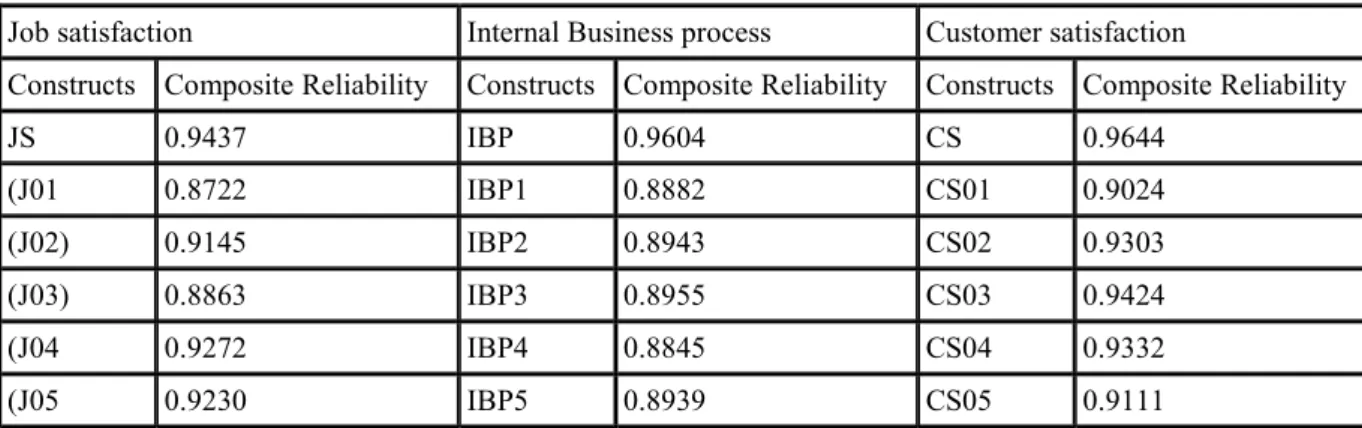
According to (Hair et all, 2013) composite reliability, that is, the measurement of reliability of scale, the reliability of composite is used to justify internal consistency. Test of reliability is conducted by seeing the composite reliability from block of indicators used to measure the constuct. The result of composite reliability will show the satisfactory vakue if it is over 0.7. The following is the value of composite reliability of output smart-Pls version 2.0:
Table 2: Constructs of Composite Reliability of The Job Satisfaction, Internal Business Process and Customer Satisfaction
Job satisfaction Internal Business process Customer satisfaction
Constructs Composite Reliability Constructs Composite Reliability Constructs Composite Reliability
JS 0.9437 IBP 0.9604 CS 0.9644 (J01 0.8722 IBP1 0.8882 CS01 0.9024 (J02) 0.9145 IBP2 0.8943 CS02 0.9303 (J03) 0.8863 IBP3 0.8955 CS03 0.9424 (J04 0.9272 IBP4 0.8845 CS04 0.9332 (J05 0.9230 IBP5 0.8939 CS05 0.9111
The table above shows that the value of composite reliability for all constructs is above 0.7 which shows that all constucts at the estimated model have met the criteria of composite reliability
4.4 Inner Model
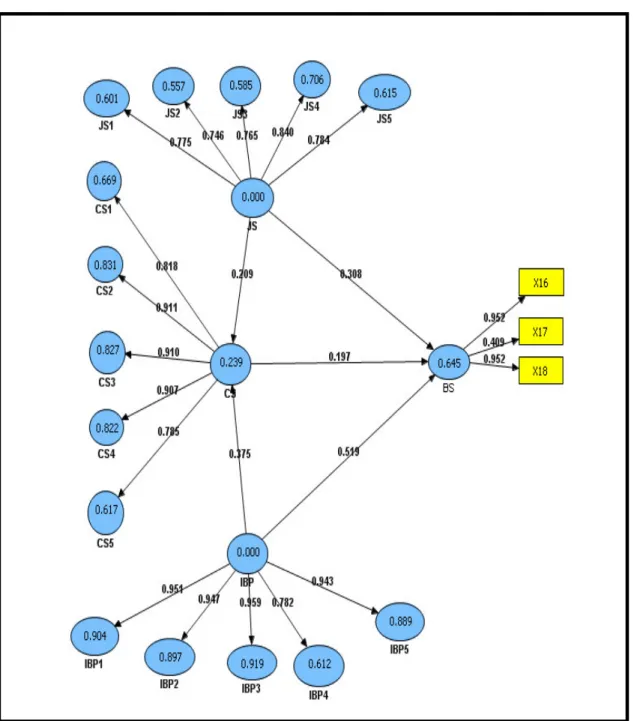
As written above that outer model is used to see whether indicator used in the research is valid and reliable or not. After the estimated model meets the criteria of outer model, the next step is to test the structural model (Inner model). Estimate for path coefficients is the line coefficient value or the impact of relatioship of latent construct. It is conducted by using the bootrapping procedures. The complete path diagram model used in the research of conventional bank is as follows:
Figure 1 : Full Model Structural Modeling Equation of State Banks
The picture above is full model picture after taking out loading factor X19 and X20 because it’s value is under 0.4 or invalid. The result of hypothesis test over full model of conventional bank is based on the output smartpls version 2.0 as follows:
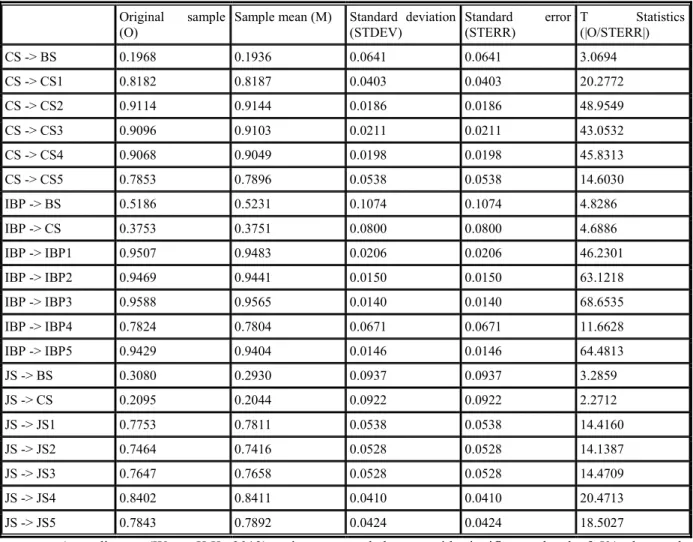
Table 3: Test of Full Model of Conventional Bank
Original sample
(O)
Sample mean (M) Standard deviation
(STDEV) Standard error (STERR) T Statistics (|O/STERR|) CS -> BS 0.1968 0.1936 0.0641 0.0641 3.0694 CS -> CS1 0.8182 0.8187 0.0403 0.0403 20.2772 CS -> CS2 0.9114 0.9144 0.0186 0.0186 48.9549 CS -> CS3 0.9096 0.9103 0.0211 0.0211 43.0532 CS -> CS4 0.9068 0.9049 0.0198 0.0198 45.8313 CS -> CS5 0.7853 0.7896 0.0538 0.0538 14.6030 IBP -> BS 0.5186 0.5231 0.1074 0.1074 4.8286 IBP -> CS 0.3753 0.3751 0.0800 0.0800 4.6886 IBP -> IBP1 0.9507 0.9483 0.0206 0.0206 46.2301 IBP -> IBP2 0.9469 0.9441 0.0150 0.0150 63.1218 IBP -> IBP3 0.9588 0.9565 0.0140 0.0140 68.6535 IBP -> IBP4 0.7824 0.7804 0.0671 0.0671 11.6628 IBP -> IBP5 0.9429 0.9404 0.0146 0.0146 64.4813 JS -> BS 0.3080 0.2930 0.0937 0.0937 3.2859 JS -> CS 0.2095 0.2044 0.0922 0.0922 2.2712 JS -> JS1 0.7753 0.7811 0.0538 0.0538 14.4160 JS -> JS2 0.7464 0.7416 0.0528 0.0528 14.1387 JS -> JS3 0.7647 0.7658 0.0528 0.0528 14.4709 JS -> JS4 0.8402 0.8411 0.0410 0.0410 20.4713 JS -> JS5 0.7843 0.7892 0.0424 0.0424 18.5027
According to (Wong K.K, 2013), using a two-taled t-test with significance level of 5%, the patch coefficient will be significant if the T-statistic is larger than 1.96. The table above shows that the value of T score CS against BS is 3.0694 > 1.96. Therefore, it can be concluded that there is a significant influence of CS over BS. Coefficient or original sample estimate is also positive, which means the influence is positive. Another value of t score is significant (J.Gaskin, 2012), PLS can calculate –values through a technique called bootstrapping if the data are normally distributed and samples are independent. If data distributions are not normal or samples are not independent, PLS can calculate -values with a technique called jackknifing
Hypothesis Test
H1 There are significant relationship between the variables of achievement (T-Value) 14.416, recognition (T-Value) 14.138 , work itself (T-Value) 14.470, responsibility (T-Value), advancement (T-Value) toward Job Satisfaction. Where relationship and the direction are positive.
H2 There are significant relationship between the variables of Operating of queuing systems (T-Value) 46.230, Staff speed and responsiveness (T-Value) 63.121, Staff skill and competence (T-Value) 68.653, Customer complain (T-Value) 11.662, Self services technology (T-Value) 64.481 toward internal business process. Where relationship and the direction are positive..
H3 There are significant relationship between the variables of tangible Value) 20.277, reliability (T-Value) 48.954, responsiveness (T-(T-Value) 43.053, assurance (T-(T-Value) 45.831, empathy (T-(T-Value) 14.603 toward customer Satisfaction. Where relationship and the direction are positive.
H4 There is a significant relationship between the variables of Job Satisfaction (JS) and Internal Business Process (IBP) toward Customer satisfaction (CS). CS is influenced by two variables: JS and IBP with koefisisen of 0.209 (JS) and 0.375 (IBP). Thus the equation is CS = 0,209 JS + 0,375 IBP
H5 There is a significant relationship between the variables of Job Satisfaction (JS) Internal Business Process (IBP) and Customer satisfaction (CS) toward Banks Soundness. BS is influenced by three variables: JS, IBP and CS with koefisisen of 0,308 (JS), 0,519 (IBP) and 0,197 (CS). Thus the equation is BS = 0,308 JS + 0,519 IBP + 0,197 CS
5. Banking Performance of Balanced Scorecard Perspective
To obtain the maximum result, the researcher also conducted the indeep interview with the bank officers related to four perspectives of balance scorecards. Besides that, the research also explore the information from the progress report of conventional bank. The result of statistical data is elaborated and cross-checked with qualitative data.
5.1 Job Satisfaction
Based on statistical test toward job satisfaction perspective in conventional banks can be proven that job satisfaction is significantly affected by the five indicators, five indicators are composed of Achievement (JS1), Recognition (JS2), Work It self (JS3), Responsibility (JS4) and Advancement (JS5). Each value of the indicator is: JS=>JS1 = 0.7753, JS=>JS2 = 0.7464, JS=>JS3 = 0.7647, JS => JS4 = 0.8402 and JS => JS5 = 0.7843. The average correlation of job satisfaction toward their indicator is 0.7822, meaning that the strong correlation between job satisfaction towards indicator. Job satisfaction is a perspective that needs to be a concern for the bank manager.
Results of statistical test are relevant to in-depth interviews and progress report obtained from Bank Mandiri, Bank Negara Indonesia and Bank Rakyat Indonesia as follows: Progress report (Bank Mandiri, 2014) Our vision of being the best bank in ASEAN by 2020 requires reliable human resources that are capable of competing with the human resources of other banks in the region. Managing our human resources, which consist of 34,696 employees, 60% of whom are members of Gen-Y, requires holistic and systematic strategies. Along with the preparation of the Bank’s 2020 business strategy, human resources management strategies were also prepared in collaboration with global consultants.
Through our Human Capital Strategy 2020 and the Mandiri People Management Framework, the competencies and characteristics of the human resources required by Mandiri will be developed in stages, including the involvement of hiring managers in the recruitment process, assessments that are aligned with the strategic directions of the Bank, the long-term development program by Mandiri University, and competitive compensation and talent development for succession and business development. To maintain operational continuity, all aspects of human capital management must be based on the values of the organization and effective leadership.
5.2 Internal Business Process
Based on statistical test towards internal business process in conventional banks can be proven that internal business process is significantly influenced by the the five indicators, They are consists of operating of queuing systems (IBP1), staff of speed and responsiveness (IBP2), Staff skill and competence (IBP3), customer complaints (IBP4), Self-services technology (IBP5). Each indicator value is IBP IBP1 = 0.9507, IBP IBP2 = 0.9469 IBP IBP3 = 0.9588, IBP IBP4 = 0.7824 and IBP IBP5 = 0.9429. The average value of five variable correlation is 0.91634, meaning that the correlation is very strong.
If observed almost all the banks in Jakarta has similar service standards, banks are not simple and slow service, so customers easily move to another bank. The first consideration for prospective customers choose a bank is a service, and facilities such as the availability of ATM transactions in public places such as supermarkets, hotels, etc
Statistical test result is relevant to the in-depth interview and progress report obtained from Bank Mandiri, Bank Negara Indonesia and Bank Rakyat Indonesia as follows.
Progress report (Bank Mandiri, 2014) The development of Information Technology (IT) in the banking industry has changed the business strategies of banks by requiring them to position technology as a key element in the process of product and service innovation. Likewise in Bank Mandiri, our information technology platform serves as a key enabler in the realization of our business strategy.
The course of our IT development is guided by our application architecture, information architecture, infrastructure architecture and security system architecture, back by IT governance that is designed in accordance with industry standards. Through the existing architecture, information technology has become a key enabler that permits the expansion of our business in an integrated and aggressive manner through the harnessing of technology for purposes such as business analysis, network communication, transaction processing, business solution of integration, reporting and monitoring, and sales and marketing. In line with the preparation of our corporate plan 2015 - 2020, in 2014 we also adopted our IT Strategy & Execution Plan 2015-2020, which provides a blueprint for the long term development of IT in the Mandiri Group so as to support the business strategies set forth in the Corporate Plan 2015-2020. Through our IT Strategy & Execution Plan 2015-2020, Bank Mandiri aspires to be a world-class IT entity.
5.3 Customer Satisfaction
customer satisfaction is significantly influenced by the fifth indicator, is consists of five indicators: Tangible (CS1), Reliability (CS2), Responsive (CS3), Assurance (CS4) and Empathy (CS5). Statistical test result toward five variables is as follows: CS CS1 = 0.8182, CS CS2 = 0.9114, CS CS3 = 0.9096, CS CS4 = 0.9068 and CS CS5 = 0.7853. The average value of the correlation of five variable customer satisfaction is 0.8662, meaning that the correlation is very strong.
Statistical test results relevant toward customer satisfaction with in-depth interview and progress report of Bank Mandiri, Bank Rakyat Indonesia and Bank Negara Indonesia, below are presented the results of in-dept interview and progress report as follows: Bank Mandiri always provides the best products and services so as to satisfy and maintain the trust and loyalty of our customers. Bank Mandiri sees its customer as external stakeholders that are at the forefront in ensuring the sustainability of the Company’s operations.
To maintain and increase the number of our customers, Bank Mandiri must provide appropriate products and services. Maintaining a comprehensive range of products and facilities customer complaints based on (Bank Indonesia Regulation No. 7/7 / PBI / 2005) on the resolution of customer complaints, as amended by (regulation No. 10/10 / PBI / 2008) on the protection of customers, Bank Mandiri has formulated comprehensive guidelines for the management of customer complaints in the form of Standard Operating Guidelines (SPO) for the Management of Customer Complaints.
5.4 Banks Soundness
Based on statistical test to aspects of the bank's soundness conventional banks that consists of five aspects, namely: Capital adequacy ratio (X16), Asset quality productive = X17, Earning = X18, Liquidity = x19, and Sensitivity = X20 . From five variables only 3 variables that are qualified or that have significant relationship towards banks soundness perspective.
Three variables are eligible BS X16 = 0.952 BS X17 = 0.409 and BS X18 = 0.952, while two variables that unqualified are BS X19 and BS X20. Variables that are not eligible have to remove from models. The average correlation banks soundness towards indicator is 0.771, meaning that the correlation banks soundness towards three variables is strong.
The statistical tests have relevance to the in-depth interview and progress report of Bank Mandiri, Bank Negara Indonesia and Bank Rakyat Indonesia. Progress report (Bank Mandiri, 2014) In general, Bank Mandiri achieved its targets in 2014. The financial ratios pertaining to Asset Quality and Profitability exceeded the set targets:
1) Non Performance Loans on consolidated basis amounted to Rp11.4 trillion, and Rp7.9 trillion on a bank only basis, compared with the target of Rp9.9 trillion, with the consolidated gross Non Performance Loan ratio standing at 2.15%, and 1.66% on a bank only basis, compared with the target 2.08%, and the consolidated net Non Performance Loan ratio coming in at 0.81%, and 0.44% on a bank only basis, compared with the target of 0.59%.
2) Provision-to-Non Performance Loan on a consolidated basis stood at 157.11%, and 201.43% on a bank only basis, compared with the target of 200.01%.
3) Consolidated Retrun on assets reached 3.39%, and 3.57% on a bank only basis, compared with the target of 3.21%.
4) Consolidated Retrun on Equity an average equity basis stood at 20.95%, and 22.02% on a bank only basis, compared with the target of 19.88%. Meanwhile, Consolidated ROE on an average core capital basis stood at 24.52%, and 25.81% on a bank only basis, compared with the target of 23.22%.
5) Consolidated Net interest margin stood at 5.97%, and 5.94% on a bank only basis, compared with the target of 5.97%.
6) Consolidated BOPO stood at 70.02%, and 64.98% on a bank only basis, compared with the target of 68.63%, while the Efficiency Ratio reached 36.47%, compared with the target of 39.11%.
6. Conclution
Based on the above explanation we can conclude as follows: 1) There is positive relationship between the achievement, recognition, work itself, responsibility and advancement towards customer satisfaction. 2)There is positive relationship between the queuing systems, speed and responsiveness of staff, staff skills and competency, customer complaints and self services technology towards Internal business process. 3) There is positive relationship between the tangible, reliability, responsiveness, assurance, and empathy toward customer satisfaction by conventional Banks. 4) There is a significant relationship between the variables of job satisfaction and internal business process toward customer satisfaction by conventional banks. Customer satisfation is influenced by job satisfaction and intenal business process. Thus the equation of conventional banks is CS =0.209 (JS) + 0.375 (IBP) and Islamic banks is CS = 0.209 JS + 0.375 IBP. 5)There is a significant relationship between the variables of job satisfaction internal business process and customer satisfaction toward banks soundness. BS is influenced by three variables: job satisfaction internal business process and customer
satisfaction. The equation of conventional banks is BS = 0.308 JS + 0.519 IBP + 0.197 CS.
References
Aziz.A Senin, 24 Juni 2013 1 Lipotan 6 http://bisnis.liputan6.com /read/ 621345/4-bank- bermasalah-bi-jamin-tak-ada-yang-diawasi-intensif.
Bank Indonesia, 1999, Sejarah perbankan Indonesia 1997-1999 unit khusus museum bank Indonesia.p2 Bank Indonesia, 2007, Peraturan Bank Indonesia the assessment system of conventional bank soundness levels Bank Mandiri 2014, Progress report financial statement http: Bank Mandiri.com
Chapra, M.U. and Ahmed, H. 2002, Corporate Governance in Islamic Financial Institutions, IRTI, Jeddah Chariri.A 2012 bahan kuliah School of Accounting, Faculty of Economics Diponegoro University
http://staff.undip.ac.id.
Charles F et al ,2006 Stakeholder Theory of the MNC , paper unpublish Desember 2006
Chin, W. W., & Dibbern, J. (2009). A permutation based procedure for multi-group (PLS) analysis: Results of tests of differences on simulated data. In: V. Esposito Vinzi
Davis, M. M., and M. J. Maggard, “An Analysis of Customer Satisfaction with Waiting Times in a Two-Stage Service Process.” Journal of Operations Management 9, no. 3 (August 1990), pp. 324–34.
Ghozali, 2011, Structural Equation Model Metode Alternatif dengan Partial Least Square, Universitas Diponegoro
Hair et all 2013, A Primer on Partial Least Squares Structural Equation Modeling (PLS-SEM) SAGE Publications, Inc
Irawan.D 2009, pengukuran kinerja perbankan berdasarkan analisis balanced scorecard pada pt.bank mandiri, jurnal tidak di publikasikan
J. Gaskin, (2012) "SmartPLS formative second-order constructs," Gaskination's Statistics,[online]. Available: http://youtube.com/Gaskination, Date accessed: August 1, 2013.
Kotler, Philip, (2002), Marketing management: analysis, planning,implementation, and control 9th Ed., Englewood Cliffs, NJ: Prentice Hall,Inc
Monecke.A,Leisch.F, 2012, semPLS: Structural Equation Modeling Using Partial Least Squares, Journal of Statistical Software May 2012, Volume 48, Issue 3. http://www.jstatsoft.org/
Setiadi.E (Rabu, 26 September 2012, http://www.republika.co.id) /berita/ekonomi/ keuangan /12/09/26/may1qr-lps-47-bank-bermasalah-karena-ulah-pemilik
Wong .K.K 2013,Partial Least Squares Structural Equation Modeling (PLS-SEM) Techniques Using SmartPLS, Marketing Bulletin, 2013, 24, Technical Note 1