SOCIAL SCIENCES & HUMANITIES
Journal homepage: http://www.pertanika.upm.edu.my/
Article history: Received: 20 December 2012 Accepted: 31 July 2013 ARTICLE INFO E-mail address: [email protected] (Cheng, F. F.) * Corresponding author
Effect of Risks on Earnings and the US Bank Share Valuation
Cheng, F. F.1*, Shamsher, M.2 and A. Nassir1
1Department of Accounting and Finance, Faculty of Economics and Management,
Universiti Putra Malaysia, 43400 Serdang, Selangor, Malaysia
2INCEIF University, Lorong Universiti A, 59100 Petaling Jaya, Selangor Malaysia
ABSTRACT
The financial crisis of 2008 had a great impact on the banking industry of the United States. This paper looks at the impact of the financial risks on the share revaluation of commercial banks in United States. It is expected that the earnings announcements will affect investors’ decisions to trade in bank shares. The Earnings Response Coefficients (ERCs) are applied in this paper to ascertain whether the estimated financial risks have incremental information content beyond the reported earnings. The findings support the notion that investors in the United States do look beyond the reported numbers and look for credit, market and price risk significantly in the earnings response valuation among other financial risks variables.
Keywords: Bank earnings, financial risks, market risks, price risks, abnormal returns
INTRODUCTION
There are about 150 top financial institutions in the United States of America, of which
50 play an important role in facilitating economic growth. This is in line with
the long-established theory that financial
intermediation plays a critical role in the allocation of resources, mobilisation of savings, and diversification of risk and, therefore, has an important impact on the
economy (Francis & Hunter, 2004). The previous “credit crunch” of 2006 and the
more recent 2008 financial crisis caused a serious problem for the US economy and seriously affected its banking sector’s
net income, market valuation, shareholder equity and capital market liquidity.
This paper investigates the impact of the risk structure of commercial banks on share
revaluation in the United States and uses the Earnings Response Coefficients (ERC)
to measure the impact from changes to the
financial risk and market and price risks of
these banks.
Credit risk, interest risk, solvency risk and liquidity risk are used as measurements
of financial risk with the addition of a market
and price risk. The analysis uses abnormal
returns and the unexpected annual earnings
model.
Credit risk is the probability of not
receiving cash flows from assets (loans and
investments) as promised. Interest rate risk refers to the negative impact on the net cash
flows and the values of assets and liabilities
originating from changes in interest rates, while liquidity risk indicates the ability of
a banking institution to fund its financial
needs. Liquidity risk is actually the by-product of the aforementioned risks since liquidity problems originate from credit and interest rate risks. Finally, solvency risk relates to the capital cushion that the bank has to offer to protect its depositors and borrowers from declines in assets values.
There is no question that some risks have to be taken to gain adequate returns. The trade-off between risks and returns is an important decision in the assets-liabilities management of banks. Managers may
sacrifice risks to gain better performance.
The big question is: How much risk should
the bank take in order to gain extra earnings?
Additionally, how much value is in the
earnings per risks trade-off?
In the past, banks have developed risk-return models that allow more sensitive assessment of the relationship between risk
and earnings/profit that leads to shareholder
value in terms of share price. One of the models is the risk adjusted returns model. Therefore, this study tries to link the traditional earnings response model to returns to measure investors/shareholders valuation on assets. The earnings response
measures the magnitude and direction of the valuation. This study includes risks as the additional control variables.
This study, hence, is an extension of
many previous studies on ERC which aims to investigate the earnings response query to
banks in the US. It follows the established
risk-adjusted returns and regression methodology in measuring the effect of
financial risk on shares revaluation for
US-based banks. The assessment summarises the
impact of risks on US banking institutions on
different levels before crisis that indirectly
reflect the recovery ability of these banks after the US financial crisis.
The paper is divided into five sections. The section that follows this first section
or the Introduction is Literature Review, which reviews literature on the risks-and-returns relation. Section Methodology deals with the research design, hypotheses and methodology employed in this study. The findings of this study are presented in Findings while this paper ends with conclusions and limitations in Conclusion.
LITERATURE REVIEW
Many studies in the past have documented that earnings levels and earnings changes are associated with positive abnormal returns
(Latane & Jones, 1979; Foster et.al, 1984;
Bernard & Thomas, 1989). Furthermore,
Ariff and Cheng (2011) state that there is strong evidence that the earnings response
coefficients (ERC) are highly significant in
several investigations over 40 years on the relation between abnormal returns of stocks and accounting earnings.
Two latest studies on stock price reaction to earnings announcements are Iqbal and Farooqi (2011) and Johnson and Zhao (2011). Iqbal and Farooqi (2011) study the stock price reaction to public announcement of quarterly earnings after
tax profit by listed firms on an emerging market, namely the Karachi Stock Exchange
(KSE). The magnitude and timing of the announcements related to earnings provide useful information to investors regarding the
financial soundness of the firms. Conducting
event studies on emerging markets is
quite challenging due to their excessive
price volatility which is a consequence of the relatively unstable political and macroeconomic conditions.
Johnson and Zhao (2011) study contrarian share price reactions to earnings surprises. The stock prices tend to rise
as the effect from unexpected surprises
caused by positive earnings. Moreover, the credibility of analysts and investors increases, hence, share prices either also increase or are maintained, while negative earnings surprises, on the other hand, are believed to evoke a severe share price penalty because the failure to at least meet
the market’s expectation raises doubt among investors about the firm’s underlying
strength. Firms tend to fall on impact from a negative earnings surprise. Earnings surprise persistence is obtained from a time-series regression model that controls for the presence of contrarian returns. The results find that contrarian share price responses to earnings surprises are a prevalent (but overlooked) feature of
quarterly earnings announcements of stock return distributions. The direction and magnitude of the earnings surprise are not a reliable indicator of the market reaction to the earnings announcements. The research
concludes about factors that influence the
incidence of contrarian returns in negative earnings surprise deciles are unchanged by the sample restrictions. But the above studies
show only the existence of ‘information content’ of the earnings announcement.
This study attempts to measure the impact
in change in the risk structure of the firm on
share valuation. Therefore, we proposed to include risk variables in our model.
Several findings of the past show that
the ERC is volatile when affected by some
factors. For example, Miller and Rock (1985) examine the unexpected earnings and
returns affected by the information. Soh et
al. (2009) defines ERC as the coefficient that
measures unexpected accounting earnings
in regressions of abnormal share market returns on that and other variables. The ERC
is influenced by other financial risks factors as well. Therefore, some research findings point to an increase in significance of the relationship between unexpected earnings
and returns in the middle of time periods. Myring (2006) uses the earnings-returns
relationship to examine how market reaction
to earnings varies across countries, and the stability of this relationship over time as
well as the factors that influence market
response to earnings.
The newly raised question is: Can the
above ERC studies be extended to US banks with the incorporation of risks factors? The
US subprime crisis that happened at the
end of 2007 eventually affected the global economy in the following year. The global crisis started with the collapse of Lehman Brothers. The result of it was a large decline
in the capital of many banks, and the US
government had to sponsor enterprises, tightening credit around the world. The main issue was about an increase in mortgage rate and loan incentives and the value of the house mortgage that began to dip in
2006 and 2007. Thus, refinancing became more difficult. As a result, most financial
institutions as well as the stock market reported huge losses.
The US banking industry has undergone
considerable changes over the last two decades in response to major deregulation, financial innovation and technological advancement. The well-known Riegle-Neal Act of 1994 allowed banking and branching on a nationwide scale. Strahan (2003) summarises the fundamental changes in bank operation as an effect of the deregulation period which altered the competitive dynamics of the industry and directly impacted economic outcomes
across US states.
One of the effects of deregulation pointed out in prior literature was an increased bank risk which can be mitigated with better risk management (Houston & Stiroh, 2006). In another sense, though, deregulation will increase competition, causing increased bank risks as banks seek out more risky high-yielding investments in
order to maintain profit margins (Bundt et al.,
1992; Park, 1994; Galloway et al., 1997). It
may also allow banks to diversify, resulting in reduced risks (Craigh & Santos, 1997). Having an integrated financial structure among the European banks may have resulted in reduced operating risk through
decreased foreign exchange risk exposures,
decreased differences in legislation and
accounting and in regulation simplification.
The recent Greek Sovereign Crisis, however, highlights another contagion effect of this
risk diversification as risk is being shared among the European Union countries.
Therefore, this paper concentrates on
the six types of risk in the banking industry.
The first four types of financial risk are credit risk, interest risk, solvency risk and liquidity risk and the other two are market risk and price risk. This study first tests
whether there exists a relationship between
stock pricing and returns from banks, and
then extends the study to risks factors.
Bystrom, Worasinchai and Chongsithipol (2005) study the relationship between
default risk and firm size, book-to-market
ratio and stock returns during a severe crisis.
They find a significant increase in
market-based default probabilities around the crisis and a fairly slow return to pre-crisis levels.
The first sector to suffer deterioration in
creditworthiness was the sector of banking,
finance and securities institutions. However,
they conclude that default risk is
non-systematic. Cheng and Ariff (2007) examine whether four financial risk factors correlated
with the abnormal returns of bank shares, while Wong (1997) shows that the optimal bank interest margin reacts positively to the increase in credit risk and interest rate risk.
Finally, Hartmann (2010) reviews five new
research papers, which shed light on various aspects of the relationship between market and credit risk and illustrate why they matter, particularly for risk management, and also for financial supervision and regulation. He further recommends future research in bilateral interaction between market and credit risk to other trilateral interaction.
METHODOLOGY Research Design
This study examines the impact of
several risk factors on the performance of commercial banks by using ratios computed
from the financial statements of 122 selected
banks from the period 2004 to 2009. The
first four types are financial risks such as
credit risk, interest risk, solvency risk and liquidity risk. The other two are market risk
and price risk. The ratios are defined in Table
1. The reason is that we wanted to determine whether these factors would impact the
selected banks’ shares in terms of direction
and magnitude and the revaluation effect from earnings changes during that period.
There are two main ways to calculate
unexpected returns, which are:
i. The return series is regressed against the lagged return series. The residual is
then used as an unexpected return. This
method is commonly used in economics
and finance.
ii. The difference in accounting returns between current year and previous year, which is commonly used in accounting literature
In this study, the second method was adopted.
Analysis of Abnormal Returns
Sharpe Market Model (1963) as a standard general equilibrium relationship for asset returns was used. The Abnormal Returns (AR):
ARit = Rit - ( α + βi Rmt ) (1)
where,
Rit =Ln(Pit/Pit-1)and,
Rmt = (Ln It/It- ).
In addition to the terms already defined,
Ln is natural logarithm and i refers to
markets composite index. Hence, we took
the changes in bank share prices as Rit and
changes in market index as indicating the
Rmt. We regressed the Rit and Rmt to compute
the beta (β) and alpha (α) to complete the
model for each bank. We also computed Cumulative Abnormal Return (CAR) from the summation of Abnormal Return (AR) for the period of 12 months.
Analysis of Unexpected Annual Accounting Earnings
Unexpected annual earnings were computed using the naive expectation model, which assumes that the next period’s expectation is simply the current period’s annual earning.
This is also consistent with the design of the study to analyse the contemporaneous effect of price at a point in time.
Unexpected annual earnings (UEs) were
UEit = (EPSit – EPSi(t-1))/ EPSi(t-1) (2)
We computed the unexpected earnings
from annual earnings per share of each sample bank as shown above in equation (2).
However, only five years’ annual earnings
per share were available for the selected banks, thus allowing us to compute only
four years of UEit. The UEit depends on
earnings per share of the bank. Therefore,
the individual bank’s profit and performance
determine the movement of its share prices, and are directly related to earnings per
share1.
Risk Determinant Factors
In this study, four financial risk factors were
considered. We included two additional risk factors as mentioned above. They were price
risk and market risk. The financial risks and
their ratios are stated in Table 1, which gives
the financial risk factors and their ratios.
This study used four financial ratios calculated from the balance sheets sourced from Bankscope. The additional two risk variables were added according to price risk (P) as derived from the yearly standard
deviation (σt) of the bank share price
from 2005 to 2009. The market variable was computed from the yearly standard
deviation (σi) of the share market index.
Relationship Between Abnormal Returns, Unexpected Earnings and Risk Factors
The relationship between abnormal returns
as dependent variable and unexpected earnings and the six risk factors, namely,
1Earnings per share computed by net income /
number of the shares outstanding
interest rate risk, liquidity risk, credit risk, solvency risk, market risk and price risk as independent variables was tested in the regression:
CARi
= δ1 + δ2 UEI + δ3 Mri + δ4 Pri + δ5 Sri
+ δ6 Iri + δ7 Lri + δ8 Cri + εi (4)
where,
CARi = Cumulative abnormal return over a
12-month window
UEi = Unexpected Annual Earnings,
Mr = Market risk factor,
Pri = Price risk,
Sri = Solvency risk factor,
Iri = Interest risk factor,
Lri = Liquidity risk factor, and
Cri = Credit risk factor
Eight regressions were performed
according to the following specification:
CARi = δ 1 + δ 2 UEi + ε Model 1 CARi = δ 1 + δ 2 UEi + δ 3 Mri + ε Model 2 CARi = δ 1 + δ 2 UEi + δ 4 Pri + εi Model 3 CARi = δ 1 + δ 2 UEi + δ 5 Sri + εi Model 4 CARi = δ 1 + δ 2 UEi + δ 6 Iri + εi Model 5 CARi = δ 1 + δ 2 UEi + δ 7 Lri + εi Model 6 CARi = δ 1 + δ 2 UEi + δ 8 Cri + εi Model 7
CARi = δ 1 + δ 2 UEI + δ 3 Mri + δ 4 Pri
+ δ 5 Sri + δ 6 Iri + δ 7 Lri + δ 8 Cri + εi
Model 8 We examined whether these four identified “accounting –financial factors”
had information content over and above the
information from unexpected earnings (UE) in the US banking industry. Additionally, we examined whether the two new risk factors would have an impact on the US
banks earning response. The regressions used the panel Ordinary Least Square regression following Wooldridge (2001). A
priori, we expected some of the key factors to significantly add more information to the
price determinants.
OBJECTIVES
This paper examines the relationship
between risk-adjusted abnormal returns and
the unexpected annual earnings changes. It also ascertains whether six factors i.e.
market risk, price risk, interest rate risk, liquidity risk, credit risk, and solvency risk affect the return-to-earnings relationship.
Data
The data set initially contained 132 US
commercial banks from the Bankscope
financial database. A final sample of 122
banks was available for analysis for the period 2005 to 2009. Table 2 shows the summary of the statistics related to the 122 sampled banks in terms of their total assets, total equity, total loans, total deposit and total income in 2009.
The difference between the largest and the smallest bank in terms of total
assets of the banks is USD11,056 million.
Wilmington Trust Corporation had the highest assets value. MB Financial Inc. was the second largest bank in assets, followed by Virginia National Bank. The smallest bank was Bank Reale, which had the lowest asset, equity and loan and deposit value.
The data above show that US banks
had more deposits compared to loans in the
year 2008. This indicated that US banks
were giving attractive interest rates to the public, which resulted in an increase of bank savings deposits. The banks had a good cash management policy of managing the amount
of money inflow and outflow. These banks TABLE 1
Financial Risk Factors and Ratios
Label Financial Risk Factors Financial Ratios
Iri Interest risk Loan / Deposit
Cri Credit risk Non-performing loans / Total assets
Lri Liquidity risk Liquid assets / Total deposit
Sri Solvency risk Equity / Deposit and short-term funding
**Additional Risk
Pri * Price risk Yearly Standard deviation of P (σt)
were holding cash more than giving out loans to avoid insolvency risk in times of
recession. So the total loan of USD46,668.2
million compared to a total deposit of
USD59,271.was at a ratio of 1:1.13. This
means that 1 % of loans given out were covered with 1.13 deposits. Hence, during
the recession period, US citizens preferred
traditional savings than investment in other
financial investment instruments. This was
encouraged by an attractive deposit interest rate by the banks.
FINDINGS Descriptive Data
Data such as earnings per share, interest risk (Loan / Deposit), Credit risk (Net loans / Total assets), Liquidity risk (Liquid assets / Total deposit) and Solvency risk (Equity / Deposit and short-term funding) were
extracted from Bankscope. Capital IQ was used to extract monthly data such as the banks’ share price data and S&P500 index
to complete the data set.
Table 3 shows the descriptive statistics of the dependent and independent variables.
The average CAR and UE are negative; this
indicates that the banks were not doing well in the preceding few years. The SD values
for these bank share prices and market index
were 9.3% and 5 % respectively. This means that these banks were more risky than the
market index.
Returns–to–earnings relationhip between UE and CAR
The regression results are summarised in Table 4. Model 1 indicates that the
coefficient for Unexpected Earnings (UE) is positively and significantly related with
CAR at a value of 0.050 and with a t-statistic
of 5.38. The R-Squared in Model 1 was
0.066, which is the range that was obtained
in other studies (Lev 1985). The findings show that US commercial banks had a
strong returns-earnings relationship.
The six risk factors were subsequently
added one by one into regression of risk adjusted cumulative abnormal returns
(CAR) and unexpected annual earnings (UE). Table 3 has all the regression results
for the remaining seven models. Initially, the risk factor was regressed one at a time and all the risk factors were then combined in the last regression.
TABLE 2
The Total Assets, Shareholder Equity, Loans and Deposit of Selected Commercial Banks (in USD million) in 2008
Bank Asset Equity Loans Deposit Income
Mean 586.3 66.3 382.5 485.8 -0.4 Standard Deviation 1,435.1 174.8 1,045.6 1,154.7 12.9 Range 11,056.0 1,303.3 8,699.9 8,967.6 147.5 Minimum 41.1 3.8 15.8 27.1 -104.6 Maximum 11,097.1 1,307.1 8,715.7 8,994.7 42.9 Sum 71,524.3 8,084.0 46,668.2 59,271.1 -49.5 Count 122 122 122 122 122
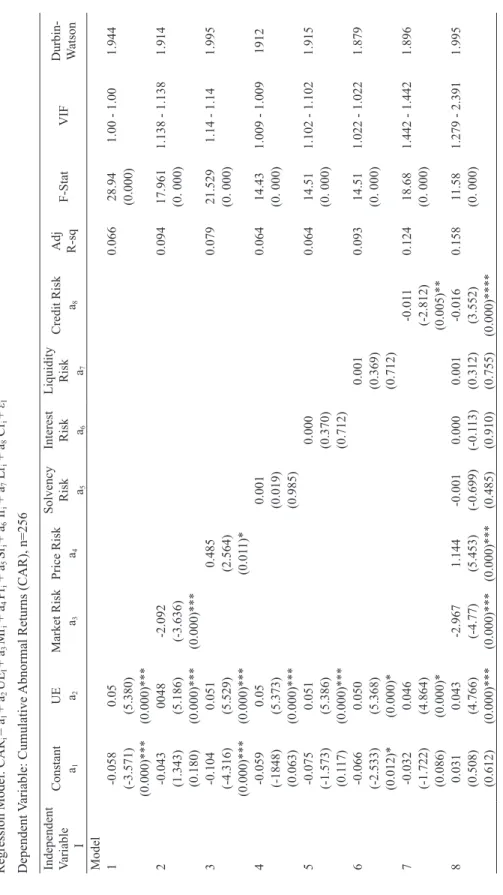
Each model exhibited a coefficient for UE variables which were significantly
and positively related to CAR. All the
risk models were insignificant except
for market risk, price risk and credit risk factor. The market risk model indicated
that the coefficient for share market risk
was negatively and significantly related at a value of -2.092 and with a t-statistic of -3.636. The price risk model indicated
that the coefficient for share price risk was positively related at a value of 0.485 and
with a t-statistic of 2.564, and the credit risk
model indicated that the coefficient credit
risk was negatively related at a value of
-0.011 and with a t-statistic of -2.812. Other
risk factors such as interest risk, solvency
risk and liquidity risk were all insignificant
with the CAR. This is because the above
stated risks dealt with the internal financial performance of the banks except for market
risk and price risk, which are the returns
expected from taking external risks. In terms of credit risks, the finding is consistent with
Cheng and Ariff (2007). The changes in the
banks’ share price were affected negatively
by the amount of non-performing loans in the loan portfolios of the banks. The higher the nonperforming loans, the lower the
share price reaction to the same amount of earnings.
Where credit risk was concerned, three
factors drove the expected and unexpected losses in the UE: (1) The customer default rate given the risks level. (2) The exposure
in the loans that is technically at risk, and (3) The potential loss, given default, after allowances were made for security. The non-performing loans that measured the credit risks encompassed all these factors. Therefore, an investor would view the magnitude of earnings with the same level of credit risk as more valuable, or the same level of earnings but lower credit risks as more valuable. With this model investors would measure the credit risk as -0.011 times for the equivalent in credit risk, whereas the ERC is in the magnitude of
0.043 of unexpected earnings. The ratio
of differences of credit risks is about one quarter of the ERC.
CONCLUSION
This paper examines the effect of financial risks on the earnings response coefficients
for a selected number of 122 commercial
banks in the US and focuses on the abnormal returns performance in US banks.
TABLE 3
Descriptive Statistics of the Dependent and Independent Variables
CAR UE Price
Risk Market Risk Solvency Risk Interest Risk Liquidity Risk Credit Risk
Mean -0.072 -0.222 0.093 0.050 13.95 90.5 10.93 2.08
S. Deviation 0.309 2.247 0.084 0.028 8.64 33.2 8.95 2.61
Minimum -0.944 -13.29 0.008 0.014 0.04 28.5 0.55 0.01
Maximum 1.582 17.19 0.944 0.100 89.2 385.9 51.7 9.29
TABLE
4
Regression Results for Returns-to-Earnings Relation for Selected Banks in the US from Period 2005 to 2009 Regression Model: CAR
i = a 1 + a 2 UE I + a 3 Mri + a 4 Pri + a 5 Sri + a 6 Iri + a 7 Lr i + a 8 Cr i + εI Dependent Variable: Cumulative
Abnormal Returns (CAR), n=256
Independent Variable I Constant a1 UE a2 Market Risk a3 Price Risk a4 Solvency Risk a5 Interest Risk a 6 Liquidity Risk a7 Credit Risk a8 Adj R-sq F-Stat VIF Durbin- Watson Model 1 -0.058 0.05 0.066 28.94 1.00 - 1.00 1.944 (-3.571) (5.380) (0.000) (0.000)*** (0.000)*** 2 -0.043 0048 -2.092 0.094 17.961 1.138 - 1.138 1.914 (1.343) (5.186) (-3.636) (0. 000) (0.180) (0.000)*** (0.000)*** 3 -0.104 0.051 0.485 0.079 21.529 1.14 - 1.14 1.995 (-4.316) (5.529) (2.564) (0. 000) (0.000)*** (0.000)*** (0.01 1)* 4 -0.059 0.05 0.001 0.064 14.43 1.009 - 1.009 1912 (-1848) (5.373) (0.019) (0. 000) (0.063) (0.000)*** (0.985) 5 -0.075 0.051 0.000 0.064 14.51 1.102 - 1.102 1.915 (-1.573) (5.386) (0.370) (0. 000) (0.1 17) (0.000)*** (0.712) 6 -0.066 0.050 0.001 0.093 14.51 1.022 - 1.022 1.879 (-2.533) (5.368) (0.369) (0. 000) (0.012)* (0.000)* (0.712) 7 -0.032 0.046 -0.01 1 0.124 18.68 1.442 - 1.442 1.896 (-1.722) (4.864) (-2.812) (0. 000) (0.086) (0.000)* (0.005)** 8 0.031 0.043 -2.967 1.144 -0.001 0.000 0.001 -0.016 0.158 11.58 1.279 - 2.391 1.995 (0.508) (4.766) (-4.77) (5.453) (-0.699) (-0.1 13) (0.312) (3.552) (0. 000) (0.612) (0.000)*** (0.000)*** (0.000)*** (0.485) (0.910) (0.755) (0.000)****
Note: Number in each bracket is t-statistic and p-value, signifi
cant at (*) 0.01 level.
The findings suggest that accounting
earnings is a price relevant variable for banks and earnings has a contemporaneous impact
on share prices for banks in the US market. All the risk factors were insignificant except
for market risk, price risk, and credit risk. The CAR depended on the earnings of the
banks’ share price, which was determined by the profit the banks were making at the
end of the day.
The profit of the banks was affected by the performance of the banks internally
and externally. The internal factors were
factors specifically related to the firms such as assets liabilities management. The
external factors included the monetary policy executed by the government. The
major income of the banks came from the differences in borrowings interest rate
and depositing interest rate. For example,
the discount rate, interest or bank lending
rate which was fixed or imposed by the
Federal Reserves on all banks required that each bank had a certain percentage of cash reserved in the Federal Reserves. These factors affected money circulation in the financial market. Therefore, market risk
factor was significant in Model 2 and Model 8, which means that the earnings of the bank
directly related to economic conditions, historical events, government policies and other macroeconomic factors.
However, the banks realised losses during the recession period due to non-performing loans from high defaults. Therefore, credit risk factor shows up as another risk factor that can affect share price revaluation due to earnings surprises.
This study unearthed no evidence that the other risk factors, namely, interest rate risk, liquidity risk and solvency risk,
had information beyond earnings for US
commercial banks. This could be due to the fact that these banks had managed this risk well following the BASEL Accords.
Overall, this study has shown a positive returns-to-earnings relationship for banks. The market, price and credit risks have information content beyond earnings changes in the returns-to-earnings relationship. These risk factors are to be
cautiously interpreted after the unexpected
earnings variables. The other three risk
factors were not significant probably due to the fact that firstly, the investors were
not concerned with the other factored risk variables, and secondly, the banks were very well managed by their managers so that the
other financial risk variables did not vary too much to be significant.
ACKNOWLEDGEMENTS
The authors wish to thank the class in Portfolio theory research for their contribution
REFERENCES
Ariff, & Cheng, F. F. (2011). Accounting earnings
response coefficient: An extension to banking
shares in Asia Pacific countries. Advances in Accounting, Incorporating Advances in
International Accounting, 27, 346–354.
doi:10.1016/j.adiac.2011.08.002
Berger, A. N., DeYoung R., Genay, H., & Udell, G. F.
(2000). Globalization of Financial Institutions: Comments and Discussion Evidence from
Cross-Border Banking Performance,
Brookings-TABLE
4
Regression Results for Returns-to-Earnings Relation for Selected Banks in the US from Period 2005 to 2009 Regression Model: CAR
i = a 1 + a 2 UE I + a 3 Mri + a 4 Pri + a 5 Sri + a 6 Iri + a 7 Lr i + a 8 Cr i + εI Dependent Variable: Cumulative
Abnormal Returns (CAR), n=256
Independent Variable I Constant a1 UE a2 Market Risk a3 Price Risk a4 Solvency Risk a5 Interest Risk a 6 Liquidity Risk a7 Credit Risk a8 Adj R-sq F-Stat VIF Durbin- Watson Model 1 -0.058 0.05 0.066 28.94 1.00 - 1.00 1.944 (-3.571) (5.380) (0.000) (0.000)*** (0.000)*** 2 -0.043 0048 -2.092 0.094 17.961 1.138 - 1.138 1.914 (1.343) (5.186) (-3.636) (0. 000) (0.180) (0.000)*** (0.000)*** 3 -0.104 0.051 0.485 0.079 21.529 1.14 - 1.14 1.995 (-4.316) (5.529) (2.564) (0. 000) (0.000)*** (0.000)*** (0.01 1)* 4 -0.059 0.05 0.001 0.064 14.43 1.009 - 1.009 1912 (-1848) (5.373) (0.019) (0. 000) (0.063) (0.000)*** (0.985) 5 -0.075 0.051 0.000 0.064 14.51 1.102 - 1.102 1.915 (-1.573) (5.386) (0.370) (0. 000) (0.1 17) (0.000)*** (0.712) 6 -0.066 0.050 0.001 0.093 14.51 1.022 - 1.022 1.879 (-2.533) (5.368) (0.369) (0. 000) (0.012)* (0.000)* (0.712) 7 -0.032 0.046 -0.01 1 0.124 18.68 1.442 - 1.442 1.896 (-1.722) (4.864) (-2.812) (0. 000) (0.086) (0.000)* (0.005)** 8 0.031 0.043 -2.967 1.144 -0.001 0.000 0.001 -0.016 0.158 11.58 1.279 - 2.391 1.995 (0.508) (4.766) (-4.77) (5.453) (-0.699) (-0.1 13) (0.312) (3.552) (0. 000) (0.612) (0.000)*** (0.000)*** (0.000)*** (0.485) (0.910) (0.755) (0.000)****
Note: Number in each bracket is t-statistic and p-value, signifi
cant at (*) 0.01 level.
Wharton Papers on Financial Services, 2000, pp. 23-120.
Bernard, V. L., & Thomas, J. K. (1989).
Post-earnings-announcement drift: Delayed price response or
risk premium? Journal of Accounting Research
(Supplement) 27, 1–36.
Bundt, T., Cosimano, T., & Halloran, J. (1992). DIDMCA (Depository Institutions Deregulation
and Monetary Control Act (of 1980)) and market
risk: Theory and evidence. Journal of Banking
and Finance, 1179–1193.
Bystrom H., Worasinchai L., & Chongsithipol S. (2005). Default risk, systematic risk and Thai
firms before, during and after the Asian crisis.
Research in International Business and Finance 19, 95–110.
Cheng F. F., & Ariff, M. (2007). Abnormal Returns
of Bank Stocks and Their Factor-Analyzed
Determinants. Journal of Accounting – Business
& Management April 2007. Vol 14, 1-16.
Craig, B. & dos Santos J. C. (1997). The Risk Effects of Bank Acquisitions, Economic Review, Federal
Reserve Bank of Cleveland, issue Q II, 25-35. Foster G., Olsen, C., & Shevlin, T. (1984). Earnings
Releases, Anomalies, and the Behaviour of Security Returns. The Accounting Review,59, 574–603.
Francis, B. B., & Hunter, D. M. (2004) The impact of
the Euro on risk exposure of the world’s major
banking industries. Journal of International
Money and Finance23, 1011-1042.
Galloway, T., Lee, W., & Roden, D. (1997). Banks’
changing incentives and opportunities for risk taking. Journal of Banking and Finance, 509-527.
Hartmann, P. (2010). Editorial, Interaction of market and credit risk. Journal of Banking & Finance. 34, 697-702.
Houston, J., & Stiroh, K. (2006). Three decades of
financial sector risk. New York: Federal Reserve
Bank of New York. Issue 134. 45-78.
Iqbal, J., & Farooqi, F. (2011). Stock price reaction to earnings announcement: The case of an emerging market. Munich Personal Repec Archive. Online
at http://mpra.ub.uni-muenchen.de/30865/ MPRA Paper No. 30865.
Johnson, B., & Zhao, R. (2011). Contrarian share price reactions to earnings surprises. Journal of Accounting Auditing and Finance, (Forthcoming). Available at SSRN: http://ssrn.
com/abstract=990078.
Miller, M. &Rock, K. (1985). Dividend policy under
asymmetric information. Journal of Finance 40, 1031-52.
Myring, M, (2006). The relationship between returns
and unexpected earnings: A global analysis by
accounting regimes. Journal of International
Accounting, Auditing and Taxation, 15, 92-108.
Latane, H. A., & Jones, C. P. (1979). Standardized unexpected earnings 1971–1977. Journal of
Finance, 34, 717–724.
Park, S. (1994). Explanations for the increased riskiness of banks in 1980s. Federal Reserve
Bank of St. Louis, 3-23.
Soh, W. N., Cheng, F. F., & Annuar, M. N. (2009). The
effect of financial risk on the earnings response in Thailand bank’s stock. International Research
Journal of Finance & Economics, 2009, Issue
31, p 55-65.
Wooldridge, J. M. (2001). Econometric analysis of
cross section and panel data. The MIT Press.