Neural models of modulation
frequency analysis in the auditory
system
Von der Fakult¨at f¨ur Mathematik und Naturwissenschaften der Carl von Ossietzky Universit¨at Oldenburg
zur Erlangung des Grades, Titels und der W¨urde einer
Doktorin der Naturwissenschaften (Dr. rer. nat.)
angenommene Dissertation
Ulrike Dicke
geb. am 22. Mai 1972 in Bremerhaven
Pongileoni’s blowing and the scraping of the anonymous fiddlers had shaken the air in the great hall, had set the glass of the windows looking on to it vibrating; and this in turn had shaken the air in Lord Edward’s apartment on the further side. The shaking air rattled Lord Edward’s membrana tympani; the interlocked malleus, incus and stirrup bones were set in motion infinitesimal storm in the fluid of the labyrinth. The hairy endings of the auditory nerve shuddered like weeds in a
rough sea; a vast number of obscure miracles were performed in the brain, and Lord Edwards ecstatically whispered ’Bach’ !
CONTENTS
1 GENERAL INTRODUCTION 7
2 A FUNCTIONAL POINT-NEURON MODEL SIMULATING
COCHLE-AR NUCLEUS OI-UNIT RESPONSES 11
2.1 INTRODUCTION . . . 12
2.2 MODEL STRUCTURE. . . 16
2.2.1 Auditory periphery . . . 16
2.2.2 Model dynamics . . . 17
2.3 SIMULATIONS AND DATA ANALYSIS . . . 19
2.3.1 Pure-tone stimuli. . . 20
2.3.2 Current stimulation . . . 22
2.3.3 Amplitude modulated stimuli . . . 25
2.3.4 Harmonic tone complexes . . . 27
2.4 DISCUSSION . . . 28
2.4.1 Alternative mechanisms suggested to account for octopus cell response properties. . . 28
2.4.2 Intracellular properties of octopus cells . . . 29
2.4.3 Simplifications made in the present model . . . 30
2.5 SUMMARY AND CONCLUSION . . . 33
3 A NEURAL CIRCUIT OF MODULATION BANDPASS FILTERS IN THE IC BASED ON OI-UNIT RESPONSES OF THE CN: PROCES-SING OF SAM TONES 35 3.1 INTRODUCTION . . . 37
3.2 MODEL STRUCTURE. . . 41
3.2.1 Auditory periphery . . . 43
3.2.2 Neuron dynamics. . . 44
3.3 SIMULATIONS AND DATA ANALYSIS . . . 48
3.3.1 EN unit responses . . . 48
3.3.5 Simulation of amplitude modulation filters . . . 54
3.3.6 Level dependence and modulation depth . . . 55
3.4 DISCUSSION . . . 57
3.4.1 Biological plausibility of the present model . . . 57
3.4.2 Alternative mechanisms . . . 58
3.4.3 Implications of the present model . . . 59
3.5 SUMMARY AND CONCLUSION . . . 61
4 AN ADVANCED NEURAL MODEL FOR THE PERIODICITY ANALY-SIS OF COMPLEX SOUNDS 63 4.1 INTRODUCTION . . . 65
4.2 MODEL STRUCTURE. . . 68
4.2.1 Auditory periphery and Neuron dynamics . . . 70
4.3 SIMULATIONS AND DATA ANALYSIS . . . 72
4.3.1 The EN model units . . . 73
4.3.2 Characteristics of bandpass modulation filters . . . 75
4.3.3 Coding of modulation depth . . . 76
4.3.4 Processing of complex envelope waveforms . . . 77
4.3.5 Processing of two-component AM . . . 78
4.3.6 Processing of narrowband noise . . . 80
4.3.7 Processing of iterated rippled noise . . . 82
4.4 DISCUSSION . . . 84
4.4.1 The model EN units . . . 84
4.4.2 The modulation filters of the present model. . . 85
4.4.3 Restrictions of the present model . . . 86
4.4.4 Suggestions for physiological experiments . . . 88
4.5 SUMMARY AND CONCLUSION . . . 89
5 SUMMARY AND CONCLUSION 91
REFERENCES 95
CURRICULUM VITAE 103
DANKSAGUNG 105
CHAPTER
1
GENERAL INTRODUCTION
The mammalian auditory system is a highly complex processing pathway that ex-tracts perceptually relevant information from acoustic signals in order to achieve a meaningful representation of the acoustic environment. Periodic amplitude modula-tions (AM) are a physical sound feature produced by many natural sound sources. They can be used by the auditory system in a variety of higher-order auditory tasks, including speech perception (e.g.Rosen,1992), pitch perception (e.g.Schoutenet al.,
1962;De Boer,1976) and auditory scene analysis (Bregman, 1990). Thus, knowled-ge about how the auditory system extracts, encodes and processes AM information would allow for a better understanding of such complex auditory processes. Electro-physiological recordings and psychophysical experiments represent two fundamen-tally different approaches towards an understanding of how acoustic information is processed by the auditory system. While electrophysiological recordings provide detailed information about the responses of distinct neuron types to AM stimuli, psychophysical experiments reveal information about possible functional AM pro-cessing strategies of the auditory system. The gap between experimental findings from these two approaches might be bridged by neural models that employ biolo-gically motivated neural response types in order to perform a functional processing of perceptually relevant information. The present modeling study may thus help to characterize the information processing strategies of the auditory system.
Besides gaining further insight into how the auditory system extracts and en-codes perceptually relevant information, biologically motivated models might also supply future architectures for technical applications as, for example, speech reco-gnition systems, digital hearing aids, or audio coding schemes. Since there is no man–made system performing auditory processing more successfully and robustly than the auditory system, it presumably provides the best target system for deve-loping technical solutions for the processing of acoustic information.
The present modeling study suggests a biologically motivated neural mechanism of how amplitude modulation information might be extracted and encoded by the auditory system. The model is motivated by findings from electrophysiological ex-periments suggesting that AM information is encoded temporally by neural activity patterns at early processing stages and transformed into a rate-based representation of AM information at higher processing stages. Auditory-nerve (AN) fibers are not selective to a certain modulation frequency in terms of their spike rate (e.g.Rose and Capranica,1985;Joris and Yin,1992). Instead, AM information is inherent in their interspike intervals (ISI) (Rose, 1970; Evans, 1978) and thus encoded in temporal activity patterns at this stage. Neurons at the level of the cochlear nucleus (CN) ex-hibit a similar AM information encoding strategy. While the majority of neurons in the CN display flat or low-pass shaped rate modulation transfer functions (rMTF), reflecting the spike rate as a function of the stimulus modulation frequency (e.g.
Kimet al., 1990;Backoff et al.,1999), the temporal synchronization of CN neurons to AM stimuli even exceeds that of AN fibers. Thus, while CN neurons are not selective to a certain modulation frequency in terms of their spike rate, the tempo-ral AM information present in the AN activity patterns seems to be enhanced by CN neurons (e.g. Frisina et al., 1990; Kim et al., 1990). This temporal periodicity code is assumed to be transformed into a rate-based representation of periodicities between the level of the CN and the inferior colliculus (IC) based on the following observations: (i) While AN fibers and CN neurons have been found to synchronize to modulation frequencies as high as 1 kHz (e.g.Javel,1980;Frisinaet al.,1990), there is general agreement among authors, that the ability of neurons to synchronize to fast amplitude modulations decreases along the ascending auditory pathway (Rees and Møller,1983; Langner and Schreiner,1988). (ii) At the level of the IC, neurons have been found that exhibit bandpass shaped rMTFs (e.g. Langner and Schreiner,
1988; Rees and Palmer, 1989). Thus, these neurons are selective to a certain mo-dulation frequency and respond with a maximum spike rate when stimulated with their so-called best modulation frequency (BMF). (iii) Neurons with different BMFs have been found to be topographically organized in the central nucleus of the IC (Schreiner and Langner, 1988,1997).
Such a rate-based representation of AM information is also motivated by the psychophysical concept of amplitude modulation filters (Dau et al., 1997a,b; Ewert and Dau, 2000). This concept has been suggested to account for the modulation frequency selectivity observed in masking experiments in the modulation-frequency domain (Bacon and Grantham, 1989; Houtgast, 1989; Dau et al., 1997a,b).
The main goal of the present thesis is to develop a neural model that transforms temporal periodicity information into a rate-based representation between the level
9
of the CN and the IC. Previous neural models of periodicity coding in the auditory system, as suggested byLangner(1981) andHewitt and Meddis(1994), are limited in their ability to account for the effects of modulation frequency selectivity when tested with complex stimuli. The present neural model provides a mechanism that allows for the psychophysically observed modulation frequency selectivity while employing unit responses and a neural connectivity that correspond to electrophysiological recordings. The model is thus the first neural periodicity model that aims at bridging the gap between electrophysiological and psychophysical descriptions by suggesting a mechanism of how linear amplitude modulation filters could be shaped by the highly nonlinear auditory system.
In Chap.2of the present thesis a new functional point-neuron model is developed that simulates the responses of cochlear nucleus ideal onset (OI) units.
Electrophy-siological recordings reveal thatOI units, morphologically associated with octopus
cells, entrain to low-frequency pure tones, click trains and AM stimuli presented at repetition/modulation rates<800 Hz (e.g. Rhode and Smith,1986;Rhode,1994a). Since the robust synchronization of OI units to AM stimuli is presumably the best
among all major cell types in the CN (Frisinaet al.,1990;Rhode,1994a;Winter and Palmer, 1995), these units are assumed to play a functional role in the processing of AM information (Golding et al., 1995; Evans and Zhao, 1997; Cai et al., 2001). By using a biphasic postsynaptic potential in combination with a dynamic spike-blocking mechanism, the new functionalOI-unit model allows for simulatingOI-unit
entrainment to a wide range of AM frequencies. TheOI-unit model that follows an
integrate-to-threshold dynamic and requires only the small set of 7 parameters also allows for simulating recordedOI-unit responses to a large set of different stimuli.
In Chap. 3, a neural circuit is described that transforms temporal periodicity information into a rate-based periodicity code between the CN and the IC. In ad-dition to well established peripheral processing stages describing basilar membrane filtering (Pattersonet al.,1988) and inner hair cell transduction (e.g. Meddis,1986), the neural circuit consists of a CN and an IC stage. The CN stage of the model con-tains two different unit types, an entrainment unit, represented by the functional
OI-unit model developed in Chap. 2, and a set of units revealing flat rMTFs. Due
to the neural response properties of the CN model units and the neural connectivity within the model bandpass shaped rMTFs are obtained in units of the IC model stage. Different BMFs hereby result from varying the number of CN model units projecting onto different IC model units. This mechanism fundamentally differs from the mechanisms suggested in previous neural models describing periodicity coding (Langner, 1981; Hewitt and Meddis, 1994) all of which employ systematically va-rying temporal parameters among different model units in order to reveal different
BMFs. In contrast to previous models the range of modulation frequencies encoded by the present neural model is not limited by the biological relevance of the range of its temporal parameters.
In Chap. 4 an extended version of the neural model of periodicity coding is presented which is based on the neural circuit presented in Chap. 3. The model alterations are motivated by the limited dynamic range of modulation depths enco-ded by the original neural circuit which does not allow for a correct description of the processing of more complex stimuli than SAM tones. In order to allow for the increased dynamic range, a set of entrainment units is introduced whose threshold potentials are systematically varied. These threshold variations result in differences in sensitivity for entrainment model units to different modulation depths. Due to this extension, a linear dependency of the output spike rate on the modulation depths of SAM stimuli is obtained within the modulation filters of the model. Simulated responses to complex envelope waveforms are compared to results according to the psychophysically motivated envelope-power spectrum model (EPSM) that explains are large set of psychophysical findings in the modulation frequency domain (Dau et al.,1999;Ewert and Dau,2000). These comparisons reveal that the neural model accounts for a modulation frequency selectivity to complex envelope waveforms as observed in psychophysical experiments.
CHAPTER
2
A FUNCTIONAL POINT-NEURON
MODEL SIMULATING COCHLEAR
NUCLEUS
O
I
-UNIT RESPONSES
ABSTRACT
Cochlear nucleus neurons revealing ideal onset OI-type peri-stimulus time
histo-grams (PSTH) encode temporal features of acoustic stimuli with very high precision. These neurons may therefore be involved in the recognition of natural sounds with temporally strongly varying envelopes such as speech. A new functional point-neuron model is presented here for the simulation of OI-unit responses. The model
inclu-des an integrate-to-threshold dynamic, an “effective” postsynaptic potential (PSP) revealing a biphasic shape, and a dynamic spike-blocking mechanism. The model is tested and compared to recordings from the literature using a variety of stimuli, including pure tones at low and high frequencies, amplitude modulated stimuli co-vering a wide range of modulation frequencies and levels, harmonic tone complexes, as well as depolarizing and hyperpolarizing current pulses. The model can account for the main characteristics in the data using the same small set of 7 parameters for each experimental condition. In particular, it is shown that the biphasic shape of the “effectivePSP allows for a description of the main characteristics of OI-unit
responses that can not be accounted for if coincidence detection is assumed as the basis for the observed onset response properties. The presented functional model can be used as a processing module within more complex models of auditory processing and provides a means of investigating the role of OI units in higher-order auditory
2.1
INTRODUCTION
The cochlear nucleus (CN) is the first nucleus along the ascending auditory pathway in mammals, where the auditory-nerve (AN) fibers synapse on a variety of neurons with different response properties. Cochlear nucleus onset units reveal temporal re-sponse properties that differ remarkably from their auditory-nerve input. While all onset units exhibit a strong response at stimulus onset, their sustained response dif-fers among the different unit types. Thus, onset units of the ventral cochlear nucleus (VCN) are commonly divided into three groups based on their peri-stimulus time histograms (PSTH) in response to high-frequency tone bursts: onset with late or long-lasting activity (OL), onset with chopping (OC), revealing two or more onset
peaks, and ideal onset (OI) (Godfrey et al., 1975; Rhode and Smith, 1986; Winter
and Palmer, 1995). Despite the ongoing stimulation provided by the AN fibers, OI
units show one precisely timed action potential at the tone onset followed by no or little (< 10 spikes/s) subsequent activity when stimulated at their characteri-stic frequency (CF) (e.g. Godfrey et al., 1975; Rhode and Smith, 1986). Another remarkable feature of OI units is their entrainment, i.e., the generation of exactly
one spike per stimulus period, in response to low-frequency pure tones, click trains and amplitude modulated (AM) stimuli presented at repetition/modulation rates
<800 Hz (e.g. Rhode and Smith, 1986; Rhode, 1994a; Oertelet al., 2000). The ro-bust synchronization ofOI units in response to AM stimuli is presumably the best
among all major cell types in the CN (Frisina et al., 1990; Rhode, 1994a; Winter and Palmer, 1995). OI-type PSTHs are associated with octopus cells (Kane, 1973;
Godfrey et al., 1975), that occupy a distinct region in the posteroventral cochlear nucleus (PVCN), called the octopus cell area. The general ability of these cells to entrain to periodic stimuli has led to the assumption that octopus cells may play an important role in the processing of amplitude modulation and pitch information (Frisina et al., 1990; Goldinget al., 1995; Evans and Zhao, 1997; Cai et al., 2001). Moreover, since octopus cells emphasize transient stimulus features like gaps and onsets, known to be important in speech processing (e.g. Stevens, 1995) as well as in auditory binding (e.g. Bregman, 1990), it has been suggested that they are also involved in these auditory tasks.
Previous models simulating octopus cell response properties suggested a number of different mechanisms that might account for octopus cell response properties.Cai et al.(1997,2000,2001) suggested a compartmental octopus cell model, that focuses on a detailed description of individual ion conductances, including a low-threshold potassium conductance as well as an inward rectifying mixed cation conductan-ce. Both conductances have been observed in octopus cells (Golding et al., 1999) and are presumed to shape their response properties. However, as mentioned by
2.1. INTRODUCTION 13
Kalluri and Delgutte(2003b), the model appears hard to evaluate because its ent-rainment has not been tested in detail. Another compartmental octopus cell model, suggested by Levy and Kipke (1997) (see also Kipke and Levy, 1997; Levy and Kipke, 1998), includes morphological and electrophysiological octopus cell proper-ties in order to investigate their role in shaping octopus cell responses. They found two inherent features dominating their model’s onset response: dynamic changes in synaptic effectiveness and a dynamically changing spike threshold. Although such detailed biophysical models, with a sufficiently large number of parameters, may allow for investigating the possible mechanisms that shape the responses of octopus cells, their ability to entrain to periodic stimuli or to simulate octopus cell responses to complex stimuli is limited. Also, due to their very complex dynamics and the extensive computational load, they can probably not easily be integrated in more general auditory processing models.
In contrast to compartmental neuron models that include detailed descriptions of biophysical cell properties, the class of point-neuron models provides a more abstract description of biological neurons.Kalluri and Delgutte (2003a,b) recently presented a point-neuron model where possible common properties among neurons with OI,
OL and OC types of onset responses were investigated. Their model is compatible
with a coincidence detector across the respective AN input fibers as it is based on short time constants together with a large number of weak synaptic inputs. Viewing octopus cells as coincidence detectors across AN input fibers became popular (i) due to the large number of high-spontaneous rate AN fibers (Liberman, 1993) that pro-vide across-frequency excitatory AN input to octopus cells and (ii) due to their rapid membrane time constant (< 200µs) (Golding et al., 1995, 1999). Moreover, it has been found that an octopus cell is activated only, if a sufficient number of AN fibers, causing small and rapid excitatory postsynaptic potentials (EPSP), are activated within a small time window of approximately 1 ms (Oertelet al.,2000).Kalluri and Delgutte (2003a) found that their point-neuron coincidence-detector model produ-cesOL and OC responses, depending on the choice of particular model parameters,
while OI unit responses can not be accounted for. In particular, the entrainment
to low frequencies found in octopus cells can not be described by using a coinci-dence detector model, as hyper-entrainment (i.e, the generation of more than one spike per stimulus cycle) can not be avoided. In order to avoid hyper-entrainment, Kalluri and Delgutte extended their coincidence detector model by a spike-blocking mechanism (Kalluri and Delgutte, 2003b). Such a mechanism was originally sugge-sted by Romand (1978) as a possible mechanism to account for OI responses. The
spike-blocking mechanism developed by Kalluri and Delgutte is activated after each spike of the neuron, preventing the generation of further spikes. This blocked state
lasts until the membrane potential (which is modeled without including a refracto-ry potential) falls below a so-called reactivation threshold and releases the neuron from spike blocking. Kalluri and Delgutte (2003b) showed that their point neuron coincidence detector in combination with a spike-blocking mechanism accounts for most of the temporal discharge patterns for tones inOI units, indicating that many
response properties can be understood from relatively simple principles. However, pure tones probably do not reveal the true extent to which OI units are capable
of entraining to, for example, low-frequency modulations of stimuli with a broader spectrum. Thus, click trains, AM tones or harmonic tone complexes may be a better choice than pure tones for revealing the capacity for entrainment in OI units.
Mo-reover, due to the fixed reactivation threshold of the model by Kalluri and Delgutte, problems are likely to occur if the same range of frequencies and levels are used with these more complex stimuli.
The functional point-neuron model presented here is similar to the model by
Kalluri and Delgutte (2003b) as it also uses a spike-blocking mechanism (Romand,
1978) with a fixed spike blocking release threshold. In contrast to the model by
Kalluri and Delgutte (2003b), however, the model assumes a biphasic postsynap-tic potential, referred to here as the “effective” PSP. Due to the effective PSP the stimulus is essentially high-pass filtered by the model, i.e., stimulus transients are enhanced and sustained stimulus portions are attenuated. Due to the high-pass filte-ring of the stimulus the model membrane potential essentially acts on the stimulus slope. In response to an AM stimulus, for example, the model membrane potential is driven towards the (fixed) spike blocking release threshold within each period of the stimulus, even if high stimulus frequencies and high levels are used. This is in contrast to a coincidence detector in combination with a spike-blocking mechanism, where the membrane potential mimics the stimulus waveforms itself, such that high stimulus frequencies or high levels might prevent the membrane potential from fal-ling below its spike blocking release threshold within each stimulus period. However, the shape of the effective PSP is not motivated by biophysical octopus cell proper-ties, instead it is suggested to allow for the simulation of a large variety of different
OI-unit responses.
In contrast to the octopus cell models that focus on possible biophysical me-chanisms underlying the octopus cell responses, the modeling approach presented here reflects a much less detailed functional description. As the model by Kalluri and Delgutte(2003a,b), it reflects an abstract model with no direct correspondence to biophysical processes. Nevertheless, the present model attempts to cover the ex-perimental results obtained for a variety of simple and complex stimuli that will be shown to be accounted for by the shape of the effective PSP. In the first part
2.1. INTRODUCTION 15
of the present paper, the structure of the model and its dynamics are described. It follows an analysis of the model’s capabilities when tested with pure tones, po-larizing current pulses, amplitude modulated tones and harmonic tone complexes. The simulated results are compared with corresponding experimental data from the literature.
2.2
MODEL STRUCTURE
A schematic visualization of the model is shown in Fig. 2.2.
2.2.1
Auditory periphery
Basilar-membrane filtering is simulated using a bank of 128 fourth-order gammatone filters (Pattersonet al.,1988), with center frequencies ranging from 80 Hz to 25 kHz spaced according to the equivalent rectangular bandwidth (ERB) scale. The output of each gammatone filter serves as input to Meddis’ hair-cell model (Meddis, 1986,
1988; Meddis et al., 1990) that computes deterministic spike probability functions for the corresponding AN fibers in response to arbitrary stimuli1. The current model
assumes a large - but limited - number of stochastically firing AN fibers to converge on anOI unit. Such a convergent input from a large number of AN fibers has been
reported by Liberman (1993) and Oertel et al. (2000). The time-dependent AN input to the model is obtained from the deterministic hair-cell probability function for computational reasons. While the hair-cell probability function is assumed to reflect the summed spike activity of aninfinitenumber of AN fibers a more realistic model input is obtained from applying noise to hair cell spike probability. Thus, the hair-cell probability function was multiplied, on a sample by sample basis, by a random variable equally distributed in the range [0.5...1.5]2. In order to account for
the wide range of across-frequency input that octopus cells receive, the simulated AN activity is summed across a range of cochlear frequency channels, such that each model unit receives equally weighted input from a frequency range spanning about half an octave around the unit’s CF. The exact choice of the input frequency range is not critical for the model performance (see below).
1Despite the existence of a revised version of Meddis’ hair-cell model (Sumneret al.,2002,2003),
the original model was chosen here because of its well known structure. However, the peripheral preprocessing steps of this model can easily be exchanged by arbitrary peripheral neural models, that provide a means of reproducing the basic features of cochlear and inner hair cell filtering.
2An analysis of the mean spike rate and the variance in the activity of individual AN fibers
(CF = 10.08 kHz) stimulated with a 10-kHz tone burst revealed that the assumed noise would cor-respond to a number of approximately 5000 statistically independent AN fibers. Simulation results assuming a physiologically more realistic total number of 700 AN fibers, whose spike trains are simulated individually, have been obtained using low and high-frequency pure tones. A comparison between these results and those obtained from using the hair-cell probability function revealed that although the assumed noise is too small to describe the variance of 700 independently spiking AN fibers, the simulation results are in good qualitative agreement.
2.2. MODEL STRUCTURE 17 0 1 2 0 1 Time (ms) Postsynaptic potential (mV )
FIG. 2.1: The effective postsynaptic po-tential (PSP) used in the present model.
2.2.2
Model dynamics
The functional octopus cell module is modeled as a point neuron, with an integrate-to-threshold model dynamic. Compared to compartmental octopus cell models (Cai et al., 1997, 2000, 2001; Levy and Kipke, 1997; Kipke and Levy, 1997; Levy and Kipke, 1998), a point neuron does not consider any spatial properties of the neu-ron, i.e., it assumes the same membrane potential everywhere inside the cell. Each presynaptic spike that is delivered to an integrate-to-threshold unit causes a postsyn-aptic potential that contributes to the unit’s membrane potential. The postsynpostsyn-aptic potential, caused by a presynaptic spike at timet= 0, is chosen as
(t) = ( the(−τat )−ce(− t τb) i for t >0 0 otherwise (2.1) with τa and τb being time constants and c denoting a constant factor. Figure 2.1
shows the postsynaptic potential, in the following referred to as the “effective PSP”. The shape of the effective PSP is assumed to be identical at all synapses in the present model.
Each presynaptic spike i arriving at a time ti causes a postsynaptic potential
that contributes to the membrane potential Vm(t) of the model unit. The model
unit is modeled as a leaky-integrator with time constantτm
τm dVm(t) dt =−Vm(t) + X ti (t−ti). (2.2)
Finally the output potentialV(t) of the unit is expressed with respect to its resting potential Vrest
V(t) =Vrest +Vm(t). (2.3)
The latter term in equation 2.2 essentially represents the convolution sum of the presynaptic spike train with the postsynaptic potential(t). While the cell’s
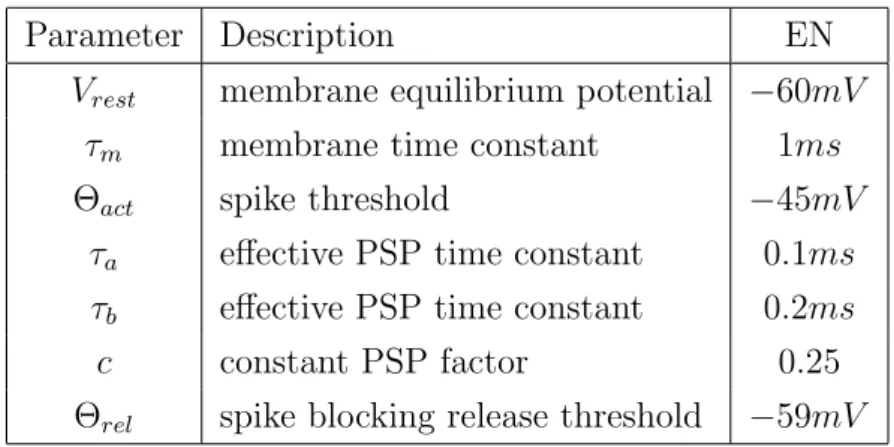
poten-TABLE 2.1: Simulation parameters.
Parameter Description EN
Vrest membrane equilibrium potential −60mV
τm membrane time constant 1ms
Θact spike threshold −45mV
τa effective PSP time constant 0.1ms
τb effective PSP time constant 0.2ms
c constant PSP factor 0.25
Θrel spike blocking release threshold −59mV
tial, V(t), is below its spike threshold Θact, the unit’s state variables is set to zero.
If the membrane potential of the model unit exceeds the unit’s spike threshold, the neuron emits a spike, i.e., its state variable is set to one:
s=
(
0 : V(t)≤Θact
1 : V(t)>Θact
After the neuron has emitted a spike it remains in an absolute refractory period with a duration of 0.8 ms, preventing it from emitting further action potentials (s = 0). In addition, a spike-blocking mechanism is activated following each spike, which also prevents the unit from emitting further spikes unless its membrane potential falls below the release potential Θrel. All simulations of the present study were performed
2.3. SIMULATIONS AND DATA ANALYSIS 19
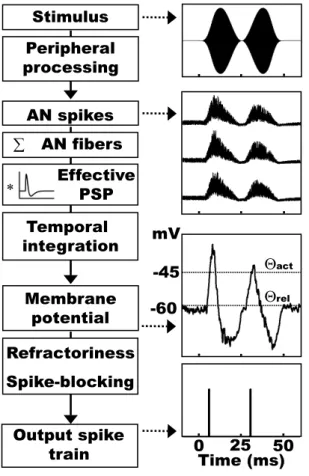
FIG. 2.2: Model processing scheme: An acou-stic stimulus (right panel, top) traverses the peripheral processing models resulting in si-mulated AN activity (the corresponding ac-tivity of three exemplary AN fibers is shown in the upper middle of the right panel). AN activity is summed across peripheral filters and convolved with the effective PSP to de-scribe the synaptic input provided to the model unit. The model integrates its synap-tic input and generates a spike, if its mem-brane potential exceeds its spike threshold Θact(right panel, lower middle). Following a spike the model enters its refractory period and its spike-blocking mechanism becomes activated. The spike-blocking mechanism re-mains active until the model membrane po-tential falls below the model’s spike-blocking release threshold Θrel. The model’s output spike train in response to the acoustic stimu-lus (right panel, top) is shown at the bottom of the right panel.
2.3
SIMULATIONS AND DATA ANALYSIS
The presented octopus cell model is tested using a variety of stimuli. Results from the simulations are compared to literature data from octopus cell recordings, if available. Stimuli include pure tones, polarizing currents, amplitude modulated (AM) tones, and harmonic tone complexes. Model responses to pure-tone stimuli are analyzed in terms of their peri-stimulus time histograms (PSTH). An interspike interval (ISI) histogram is used in the case of the harmonic tone complex. If not stated otherwise, histograms are gained from 250 repetitions of a 50-ms stimulus with 10-ms ramps, using a bin width of 0.2 ms. The degree of synchronization of the model response to AM stimuli is analyzed using the synchronization coefficient (SC) (Goldberg and Brown,1969), computed as the vector strength of the distribution of spikes. SC=1 indicates perfect synchronization to the stimulus modulation while SC=0 repres-ents no synchronization at all. Additionally, the rate modulation transfer function (rMTF), where the spike rate is plotted as a function of the modulation frequency, is computed in response to AM stimuli. AM stimuli are presented with a duration of 1.05 s with the first 50 ms being excluded from the analysis in order to avoid onset effects. Stimulus levels are given in dB above the model’s individual CF pure-tone response threshold (mTh).
0 10 20 30 40 50 0 200 Time (ms) Spikes 0 10 20 30 40 50 0 200 Time (ms) Spikes
FIG. 2.3: Left: PSTH of a model unit (CF=3.98 kHz) in response to a 4-kHz tone presented at 50 dB (mTh). Right: PSTH of the same model unit in response to a 500-Hz tone presented at 50 dB (mTh). Note that the same model unit reveals both, an onset response when stimulated with high-frequency tones and entrainment when stimulated with low-frequency tones.
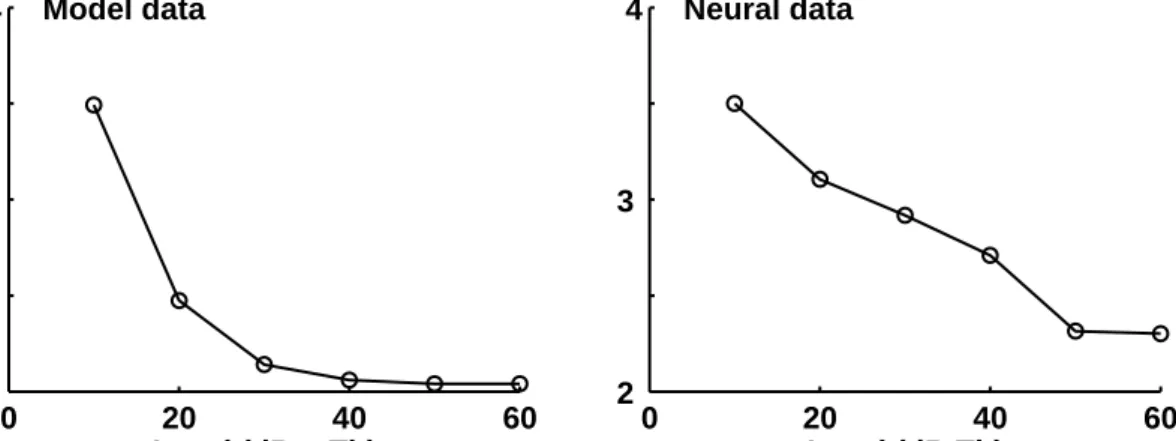
0 20 40 60 2 3 4 Model data Level (dB mTh) FSL (ms) 0 20 40 60 2 3 4 Neural data Level (dB Th)
FIG. 2.4: Left: FSL of the model unit (CF=3.98 kHz) as a function of different stimulus levels. Right: Recorded FSL of an octopus cell (CF=7.96 kHz) when stimulated with pure tones at CF presented at different levels (stimulus level is given with respect to the unit’s pure-tone threshold). Replot with permission fromWinter and Palmer(1995).
2.3.1
Pure-tone stimuli
Godfrey et al. (1975) found that octopus cells in cats respond to pure-tone stimuli (f > 2 kHz) revealing one sharply timed action potential at stimulus onset followed by no or little (< 10 spikes/s) subsequent activity during the sustained portion of the tone. Such anOI-type response was confirmed in a number of subsequent studies
(e.g.Rhode and Smith,1986;Winter and Palmer, 1995) investigating the responses of PVCN octopus cells. The first spike latency (FSL) of octopus cells ranges from 2-4 ms at intermediate stimulus levels and decreases with increasing stimulus level (Rhode and Smith, 1986; Winter and Palmer, 1995). In contrast to their onset response at high stimulus frequencies, octopus cells can entrain to low-frequency pure tones (f <800 Hz), where they emit exactly one spike at each stimulus cycle
2.3. SIMULATIONS AND DATA ANALYSIS 21
(e.g. Rhode and Smith, 1986), if the stimulus frequency is included in the cell’s frequency-response area. The synchronization coefficient of low-frequency pure-tone entrainment lies between 0.9 and 0.99 (Rhode and Smith,1986), indicating a nearly perfect synchronization of the cell’s response to the stimulus frequency.
The left panel of Fig. 2.3 shows, as an example, the PSTH of a model cell (CF=3.98 Hz) in response to a 4-kHz pure tone presented at 50 dB (mTh). Such reliable onset responses are produced by the model for all tested stimulus levels. Due to the spike-blocking mechanism, multiple spikes do not occur at stimulus onset, even not at the highest stimulation level tested (90 dB (mTh)). The right panel of Fig.2.4
displays the recorded FSL of an octopus cell (CF=7.96 kHz) when it is stimulated with pure-tones at its CF as a function of the stimulus level, replotted fromWinter and Palmer (1995). The FSL decreases from 3.5 to 2.3 ms as the stimulus level is increased from 10 to 60 dB (level above the unit’s threshold). The left panel of Fig. 2.4 displays the FSL of the same model cell (CF=3.98 kHz) as shown in Fig. 2.3, as a function of the stimulation level of a 4-kHz pure tone. The simulated FSL decreases from 3.4 to 2.0 ms when the stimulus level is increased from 10 to 60 dB (mTh), which is is in good agreement with the recorded octopus cell data. If the same model unit is stimulated with a low-frequency pure tone it entrains to the stimulus frequency. This is shown in the right panel of Fig. 2.3 where the simulated PSTH of the model unit (CF=3.98 kHz) is given in response to a 500-Hz tone presented at 50 dB (mTh). The synchronization coefficient, calculated from the model PSTH, is 0.99, thus being in good agreement with recorded octopus cell synchronization coefficients.
A more general view is obtained from the frequency-response area of a neuron where the spike rate of the neuron is computed in response to pure-tones presented at different frequencies and levels. The right panel of Fig. 2.5 shows a recorded frequency-response area of an octopus cell (CF=2.2 kHz, CF pure-tone threshold 30 dB, stimulus levels are increased in 10dB steps from 30 to 90 dB SPL), replotted from Rhode and Smith (1986). The frequency-response area is broad, due to the wide across-frequency range spanned by the AN fibers that terminate on an octopus cell, and reveals an asymmetric shape with respect to the unit’s CF. The simulated frequency-response area of a model neuron with CF = 1.96 kHz in response to pure tone stimuli presented at 10, 20, 30 and 60 dB (mTh) is shown in the left panel of Fig.2.5. The simulated frequency-response area agrees with the recorded data in its broad shape and in its asymmetry. The asymmetric shape of the frequency response area is a particular feature of octopus cells that receive AN input coming from low-frequency cochlear filter channels. This can be understood from the pure-tone PSTHs shown in Fig.2.3. While the simulated cell reveals purely an onset response
0 1000 2000 3000 4000 0 200 400 600 800 1000 Spike rate (Hz) Frequency (Hz) 0 1000 2000 3000 4000 0 200 400 600 Spike rate (Hz) Frequency (Hz) 30dB 40dB 50dB 60dB 70dB 80dB 90dB 10dB(mTh) 20dB(mTh) 30dB(mTh) 60dB(mTh)
FIG. 2.5: Left: Frequency-response area of a model unit (CF=1.96 kHz) for different stimulus presentation levels of 10, 20, 30 and 60 dB (mTh) (100 stimulus repetitions). Right: RecordedOI -unit response area (CF=2.2kHz, response threshold at CF=30 dB SPL, stimulus duration 25 ms, 250 stimulus repetitions). Replot with permission fromRhode and Smith(1986).
at high stimulus frequencies (left panel of Fig.2.3) it entrains to low-frequency pure tones (right panel of Fig.2.3) with a spike rate that reflects the stimulus frequency. The cell’s entrainment leads to an enhanced spike rate in response to low-frequency tones, in contrast to the onset spike the cell exhibits in response to high-frequency tones and thus causes the asymmetric shape of the frequency-response area. The left panel of Fig.2.5also indicates that when the stimulus frequency equals the neuron’s CF (1.96 kHz), essentially no changes occur in its spike rate when the stimulus level is varied within 10 to 60 dB (mTh). This indicates that the dynamic range of the model neuron (at CF) must be smaller than 10 dB. Such a small dynamic range is in good agreement with experimental octopus cell data, revealing a dynamic range of only 10 dB to 25 dB (Rhode and Smith,1986). However, at stimulus frequencies at which entrainment occurs, the dynamic range increases. This is due to the basal spread of excitation, that causes an increasing number of AN fibers to follow the stimulus.
2.3.2
Current stimulation
The right panel of Fig. 2.6 shows recorded octopus cell data in response to steps of current between 5 and -3.5 nA in 0.5 nA increments, reprinted from Oertel et al. (2000). When stimulated with depolarizing currents of sufficient magnitude, octopus cells exhibit an action potential at stimulus onset that is followed by a low sustained depolarization during the sustained portion of the stimulus. Moreover, Golding et al.(1999) reported that repetitive firing is never observed even if very high current pulses are used. After the depolarizing current has terminated the cell becomes hyperpolarized, i.e., the membrane potential falls below its resting value. When stimulated with hyperpolarizing currents of sufficient magnitude, octopus cells are
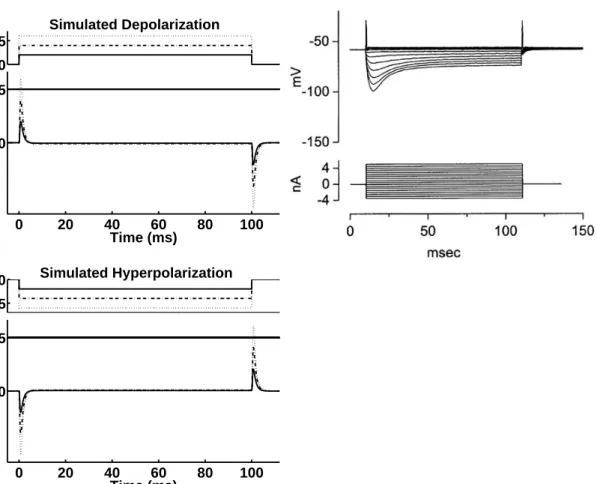
2.3. SIMULATIONS AND DATA ANALYSIS 23 0 0.005 Simulated Depolarization 0 20 40 60 80 100 −60 −45 Time (ms) Potential (mV) −0.005 0 Simulated Hyperpolarization 0 20 40 60 80 100 −60 −45 Time (ms) Potential (mV)
FIG. 2.6: Upper left panel: Simulated depolarizing currents of different strengths (top) and the corresponding model membrane potential (bottom). Lower left panel: Simulated hyperpolarizing currents of different strengths (top) and the corresponding model membrane potential (bottom). The solid line in the bottom panel of each figure indicates the spike threshold of the model unit. Right: Recorded octopus cell potentials (top) in response to current steps between 5 and -3.5 nA in 0.5 nA increments (bottom). The cell evokes an action potential at the onset and offset of large depolarizing and hyperpolarizing currents, respectively. Reprint from Oertel et al. (2000) (Copyright (2000) National Academy of Sciences, U.S.A.).
hyperpolarized throughout the whole stimulus and generate an offset action potential after the hyperpolarizing current has terminated.
Simulation results are shown in the left panel of Fig. 2.6. The simulated depo-larizing stimulus is presented at three different magnitudes (upper left panel, top). The corresponding model membrane potential, shown in the bottom panel, only exceeds the model spike threshold (solid line), when the strongest stimulus is pre-sented. Following the onset depolarization the membrane potential remains at a low sustained depolarization and finally becomes hyperpolarized after the depolarizing stimulus has terminated. The lower left panel of Fig. 2.6 displays the simulated hyperpolarizing stimulus presented at three different magnitudes (top) and the cor-responding model membrane potential (bottom). The strong hyperpolarization of the model membrane potential at stimulus onset is reduced during the sustained
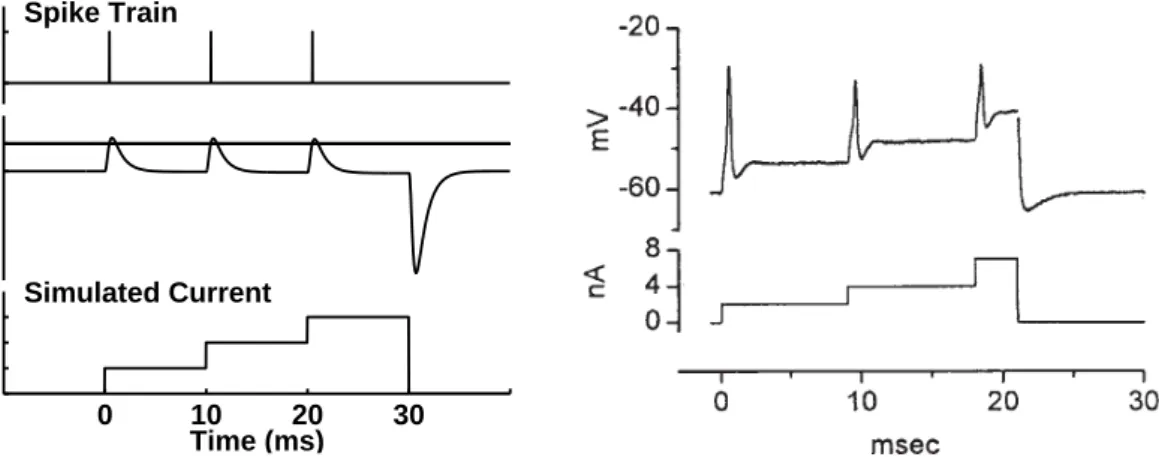
0 1 Spike Train −60 −45 Potential (mV) 0 10 20 30 0 0.006 0.012 0.018 Simulated Current Time (ms)
FIG. 2.7: Left: Model output spike train (top) and the corresponding model membrane potential (middle). The vertical line indicates the spike threshold of the model unit. The simulated staircase current stimulus is shown at the bottom. Right: Recorded octopus cell data. The octopus cell potential is shown in the top panel and the staircase current stimulus in the bottom panel. Both, the recorded and the simulated, data reveal that if the cell is depolarized with increasing current steps it emits an action potential with each current increment. At the offset of the current pulse the cell potential falls below its resting potential. Reprint from Oertel et al. (2000) (Copyright (2000) National Academy of Sciences, U.S.A.).
stimulus portions. In case that the hyperpolarization is strong enough, the membra-ne potential exceeds its spike threshold after the stimulus has ended, such that an offset action potential is generated. Thus, the model responses to depolarizing and hyperpolarizing stimuli show the main characteristics of the recorded cell potentials. The right panel of Fig.2.7shows recorded octopus cell data in response to incre-asing current steps, reprinted fromOertelet al.(2000). When the cell is depolarized with a current pulse of 2 nA it generates an action potential at the onset of the current pulse and remains at a low depolarization during the sustained portion of the current. Further increments of the depolarizing current pulse from 2 to 4 nA and from 4 to 7 nA cause the octopus cell to exhibit further action potentials. After the current stimulus has ended a hyperpolarization of the octopus cell is observed. The left panel of Fig. 2.7 shows the model membrane potential (middle) and the corresponding output spike train (top) in response to a simulated staircase stimulus, increased in three steps (bottom). The model membrane potential exceeds its spike threshold at the beginning of each step, thus emitting a spike with each increment, while it approaches its resting potential during the sustained stimulus portions. Even though the simulated membrane potential differs from the recorded octopus cell po-tential, in that the low sustained depolarizaton of the recorded potential increases with each current increment, it resembles the latter in its key features including the strong hyperpolarization occurring after stimulus offset.
2.3. SIMULATIONS AND DATA ANALYSIS 25
Due to the shape of the effective PSP within the present model it allows for simulating the recorded octopus cell data shown in the right panels of Fig. 2.6
and Fig. 2.7. Octopus cell responses to current stimuli would not be obtained if coincidence detection was used as a mechanism for modeling an octopus cell, which would imply the use of a monophasic PSP. This is further discussed in Sec. 2.4.1.1.
2.3.3
Amplitude modulated stimuli
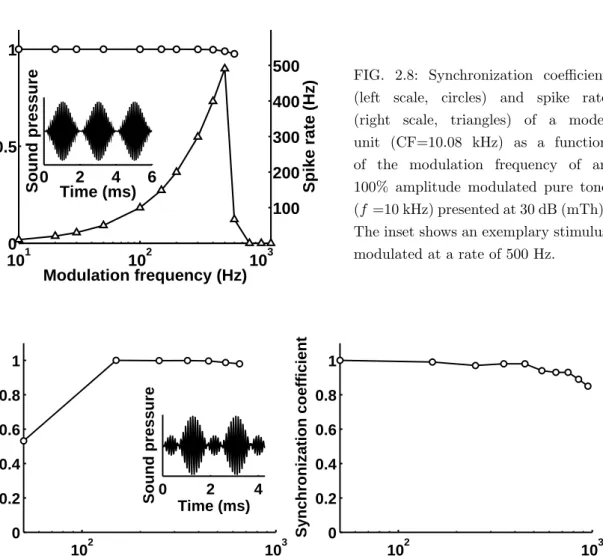
Octopus cells are presumably the best AM encoders among all major CN cell ty-pes (Frisina et al., 1990; Rhode, 1994a; Winter and Palmer, 1995). Entrainment of a model unit (CF=10.08 kHz) to 100% amplitude modulated stimuli can be seen in Fig. 2.8, where the synchronization coefficient (left scale, circles) is plotted ver-sus modulation frequency in response to an 10-kHz SAM tone presented at 30 dB (mTh). An example stimulus with a modulation frequency of 500 Hz is shown in the inset of Fig.2.8. The resulting synchronization coefficients have values between 0.98-1.0. Since the synchronization coefficient does not reveal whether the cell fires at each stimulus cycle, or misses out some cycles, the corresponding rate modulation transfer function (rMTF) is also shown in Fig. 2.8 (right scale, triangles). A spike rate approximately equaling the modulation frequency and a high vector strength indicate a nearly perfect entrainment of the model unit to the AM stimulus. At a modulation frequency of 500 Hz, for example, the cell exhibits 502 spikes/s and a synchronization coefficient of 0.98 thus revealing nearly perfect entrainment. At a modulation frequency of 600 Hz, the rate is strongly decreased, as the cell can not follow the fast fluctuations of the modulated input anymore. However, since the re-maining spikes are still phase-locked to the stimulus modulation the synchronization coefficient remains at a high value (SC=0.98). If the stimulus modulation frequency exceeds 800 Hz, the cell exhibits an onset response instead of entraining to the sti-mulus. A direct comparison of simulated and experimental 100% AM responses for
OI units is not possible due to the paucity of recorded data for these units.
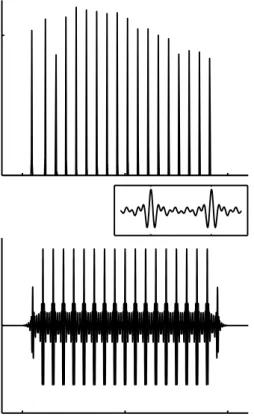
Although recorded data from octopus cells are limited, responses to 200% am-plitude modulated tones have been investigated relatively extensively, since they resemble natural vocalizations more closely than 100% SAM tones (Rhode, 1994a). The right panel of Fig. 2.9 shows recorded data of an OI unit with CF=6.7 kHz
(pure-tone threshold at CF is 13 dB SPL) in response to a 200% amplitude mo-dulated carrier, replot from Rhode (1994a). The stimulus was presented at 50 dB SPL and the carrier frequency of the 200% amplitude modulated tone was chosen to equal the unit’s CF. The left panel of Fig.2.9 shows the synchronization coefficient of the model unit (CF=10.08 kHz) in response to a 200% amplitude modulated 10-kHz tone presented at 20 dB (mTh). The stimulus corresponding to the modulation
101 102 103 0 0.5 1 Synchronization coefficien t Modulation frequency (Hz) 100 200 300 400 500 Spike rate (Hz) 0 2 4 6
Sound pressure Time (ms)
FIG. 2.8: Synchronization coefficient (left scale, circles) and spike rate (right scale, triangles) of a model unit (CF=10.08 kHz) as a function of the modulation frequency of an 100% amplitude modulated pure tone (f =10 kHz) presented at 30 dB (mTh). The inset shows an exemplary stimulus modulated at a rate of 500 Hz. 102 103 0 0.2 0.4 0.6 0.8 1 Modulation frequency (Hz) Synchronization coefficien t 0 2 4
Sound pressure Time (ms)
102 103 0 0.2 0.4 0.6 0.8 1 Modulation frequency (Hz) Synchronization coefficien t
FIG. 2.9: Left: Synchronization coefficient of the model unit (CF=10.08 kHz) as a function of the modulation frequency of a 200% amplitude modulated 10-kHz tone presented at 20 dB (mTh). The inset displays an exemplary stimulus modulated at a rate of 550 Hz. Right: Recorded synchroniza-tion coefficient of an octopus cell in response to 200% amplitude modulated pure tones presented at 37 dB above the unit’s pure tone threshold. The stimulus carrier frequency was chosen to equal the unit’s CF (stimulus duration 100 ms). Replot with permission fromRhode(1994a).
frequency of 550 Hz is shown as an example in the inset of Fig.2.9(left). The model entrains to the stimulus modulation revealing synchronization coefficients that lie between 0.98-0.99, being in good agreement with the recorded data shown in the right panel of Fig. 2.9. However, at the lowest modulation rate, 50 Hz, the simu-lation results deviate from the recorded data, in that the model entrains not only to the center peak, but also to the small lobe of the 200% AM stimulus (see exam-ple stimulus in the inset of Fig. 2.9 (left)). This results in a doubled model spike rate and thus to a synchronization coefficient that is reduced compared to the syn-chronization coefficients obtained at higher modulation frequencies. Thus, at this low modulation frequency the model is more sensitive to onset transients than the octopus cell used in the recordings.
2.3. SIMULATIONS AND DATA ANALYSIS 27 0 10 20 0 2000 Time (ms) ISI 0 200 PSTH 0 10 50 0 Stimulus Time (ms)
FIG. 2.10: PSTH (left panel, top) and ISI histogram (right panel) of a model unit (CF=2.04 kHz) in response to a harmonic tone complex consisting of 6 components equally spaced between 1 kHz and 2 kHz presented at 20 dB (mTh). The stimulus shown in the lower left panel is presented for 100 ms (the inset displays a magnified version of one stimulus period). The PSTH shows that the model responds with each stimulus cycle such that the ISI histogram exhibits a peak at interspike intervals (5 ms) that correspond to the missing fundamental of the tone complex (200 Hz).
2.3.4
Harmonic tone complexes
Octopus cells are found to entrain to the fundamental frequency of a harmonic tone complex, even if the fundamental frequency itself is missing (Caiet al.,2001; Evans and Zhao,1998;Palmer and Winter, 1993).
Figure2.10shows the PSTH (left panel, top) and ISI histogram (right panel) of a model unit (CF=2.04 kHz) in response to a harmonic tone complex with a (missing) fundamental frequency of 200 Hz consisting of six frequency components spaced between 1 kHz and 2 kHz. The simulation level was 20 dB (mTh). The temporal waveform of the harmonic tone complex is shown in the lower left panel of Fig.2.10
and the inset shows one magnified period of the stimulus. The simulated PSTH shown in Fig.2.10 (left panel, top) reveals that the model responds at each cycle of the harmonic tone complex. This results in interspike intervals that correspond to the period time of the missing fundamental frequency of the harmonic tone complex (5 ms). Thus, the simulated responses correspond well to the responses reported from octopus cells (Cai et al., 2001; Evans and Zhao, 1998).
2.4
DISCUSSION
2.4.1
Alternative mechanisms suggested to account for octopus
cell response properties
2.4.1.1 Coincidence detection
Even though octopus cells are often assumed to act as coincidence detectors, coinci-dence detection itself is not sufficient to account for the entrainment found in these cells, as has been recently shown in Kalluri and Delgutte (2003a). Two additional features observed in octopus cell recordings using depolarizing and hyperpolarizing current pulses (Goldinget al., 1999) also indicate that coincidence detection is not sufficient for modeling an octopus cell: the offset action potential observed in respon-se to hyperpolarizing currents of sufficient strength (Fig. 2.6, right) and the hyper-polarization of the cell following a depolarizing current (right panels of Fig.2.6 and Fig.2.7). As a pure coincidence detector uses a monophasic PSP, such that its mem-brane potential mimics the stimulus waveform, it lacks a mechanism that allows for detecting a stimulus offset as well as a hyperpolarizing mechanism, that is not rela-ted to its refractoriness. Even if combined with a spike-blocking mechanism (Kalluri and Delgutte,2003b) coincidence detection is not appropriate to model octopus cell responses, a conclusion that can be drawn from octopus cell recordings in response to increasing current steps (Fig.2.7, right). If a coincidence detector in combination with a spike-blocking mechanism was stimulated by a simulated staircase current, it would only generate one action potential at the stimulus onset. After emitting the initial action potential, the spike-blocking mechanism would be activated and remained activated throughout the entire stimulus, as the membrane potential did not fall below the release threshold, that releases the cell from spike blocking.
In contrast, the simulation results of this study reveal that,if a biphasic PSP is used instead of a monophasic PSP, octopus cell responses can be simulated using a variety of stimuli, including current steps. The shape of the effective PSP used in this study essentially represents a high-pass filtering process of the stimulus, i.e., it enhances stimulus transients and attenuates sustained stimulus portions. Thus, when stimulated with a staircase current, the membrane potential of the present model falls below the release threshold during the sustained stimulus portions, such that the cell is released from spike blocking and can generate further action potentials (left panel of Fig. 2.7).
The present model corresponds to all previous octopus cell models in terms of its fast time constants. However, the fast time constants in the present model are
2.4. DISCUSSION 29
not associated with a coincidence detection mechanism, but are required to allow for an entrainment to high input frequencies.
2.4.1.2 Dynamic changes in synaptic effectiveness and inhibitory mechanisms
Dynamical changes in synaptic effectiveness, suggested to account for octopus cell responses in the model by Levy and Kipke (1997) (see also Kipke and Levy, 1997;
Levy and Kipke,1998), could not be confirmed in octopus cell recordings. Although signs of depression, possibly indicating a decreased synaptic effectiveness, were ob-served in octopus cell recordings (Golding et al., 1995; Oertel et al., 2000), their effects were small and occurred only under unphysiological stimulus conditions.
Inhibitory circuits or inhibitory interneurons, suggested to account for octopus cell responses (Godfrey et al., 1975;Kane,1973), are unlikely to shape the response properties of octopus cells for several reasons. Inhibitory interneurons are unlikely to be involved in octopus cell responses due to the short FSLs observed in octopus cells (2-4 ms) (Rhode and Smith, 1986;Winter and Palmer,1995). Moreover, while blocking inhibition by applying a GABAA receptor antagonist largely affects the responses ofOL and OC units, it does not affect the response properties of OI units
(Palombi and Caspary,1992;Evans and Zhao, 1998). Additionally, immunostaining studies revealed only a weak influence of inhibition on octopus cells compared to other CN cell types (Wenthold et al., 1986, 1987). Thus, it can be assumed that neither dynamic changes in synaptic effectiveness nor inhibitory mechanisms play a critical role in shaping octopus cell response properties.
2.4.2
Intracellular properties of octopus cells
Recent studies focusing on the intracellular properties of octopus cells revealed two voltage-sensitive conductances inherent in octopus cells: an outward rectifying low-threshold, depolarization-activated potassium conductance and an inward rectifying hyperpolarization-activated mixed-cation conductance (Golding et al., 1995,1999). The inward rectifying current is found to act mainly in the hyperpolarized voltage range, having no major effect on the response properties of octopus cells. However, blocking the outward rectifying conductance leads to repetitive firing and broadened action potentials (Goldinget al.,1999), indicating that the low-threshold potassium conductance plays a critical role in shaping octopus cell response properties. The octopus cell model byCai et al.(1997,2000,2001), that includes these two conduc-tances, thus presumably employs a biologically plausible mechanism for simulating octopus cell responses. However, entrainment of their model has not been tested using a wide range of frequencies and levels. Thus, the usability of their model
ap-pears limited in this respect. It is not possible to correlate the shape of the effective PSP used in this model with distinct ion conductances. However, the effective PSP reflects an intracellular model property that might result from combined fast in-wardly directed currents and slower outin-wardly directed currents, in response to a presynaptic spike. Whether these outwardly directed currents reflect the effective contribution of the low-threshold potassium conductances can not be decided here. Since the different types of onset units differ in both their morphological and their physiological properties, the present model exclusively focuses onOI-unit responses.
While OC responses have been associated with multipolar stellate cells (Rhode et
al.,1983;Smith and Rhode,1989) andOI responses with octopus cells (Kane,1973;
Godfreyet al.,1975), the morphological basis ofOLunits is uncertain. FewOLunits
have been identified as octopus cells (Rhodeet al.,1983;Winter and Palmer,1995), but OL responses are also associated with bushy cells. Beside these morphological
differences, onset units also differ in their physiological properties, for example, in terms of their dynamic ranges, frequency selectivity, and ISI histograms (Rhode et al., 1983; Winter and Palmer, 1995). Moreover, the responses of OL and OC
units are strongly affected if inhibition is blocked by applying a GABAA receptor antagonist, while responses ofOI units are not (Palombi and Caspary, 1992; Evans
and Zhao,1998). The strong influence of inhibition on the responses of OL and OC
units indicates that their responses result from inhibitory mechanisms, in contrast to the responses of OI units that are assumed to be shaped by membrane-based
mechanisms (Evans and Zhao,1998). Due to these fundamental differences between the different types of onset units, we decided to model exclusivelyOI-unit responses,
in contrast to the coincidence detector model byKalluri and Delgutte (2003a,b).
2.4.3
Simplifications made in the present model
2.4.3.1 The model membrane potential
A number of simplifying assumptions have been made in order to limit the model’s complexity. The membrane potential of the presented model differs from recorded octopus cell potentials in that it is not affected by refractoriness. Refractoriness is implemented in the presented model by preventing the cell from generating action potentials during its refractory period, without being reflected in the cell’s membrane potential. Otherwise the spike-blocking mechanism, that is driven by the membrane potential, would be disturbed by the refractoriness of the cell. If the spike-blocking mechanism would be driven by an internal copy of the membrane potential, that is not affected by refractoriness, the model membrane potential could be simulated having a biologically more plausible shape. However, we decided not to implement
2.4. DISCUSSION 31
such an extra “spike-blocker potential” as the structure of the present model was intended to be as simple as possible and as it does not affect any other model response property except the shape of its membrane potential.
The model membrane potential also differs from recorded octopus cell potenti-als in that the strength of its hyperpolarization following a depolarizing stimulus exceeds the hyperpolarization observed in octopus cell recordings (see for example Fig.2.7). However, the model hyperpolarization can be reduced by including an in-ward rectifying mixed cation current. Such a current has been found in octopus cells to act in the hyperpolarization range, without revealing a strong influence on the shape of octopus cell PSTHs (Goldinget al.,1995,1999). An inward rectifier current is not included in the model as it does not affect the basic response properties of the model. If the presented model, which is attempted to possess an as simple as possible structure, was supposed to simulate octopus cell potentials in detail, this could be obtained by introducing both, an extra membrane potential driving the spike-blocking mechanism as well as an inward rectifying mixed cation conductance that acts in the hyperpolarization range.
2.4.3.2 The spike-blocking mechanism
The spike-blocking mechanism of the present model resembles the one implemented by Kalluri and Delgutte (2003b). Although little is known about the biophysical basis of such a mechanism, it might be associated with an inactivation of Na+ chan-nels, as these channels are among the principal channels underlying fast spiking in neurons. The inactivation of Na+ channels (depolarization block) has been original-ly suggested byRomand(1978) as a mechanism shaping onset responses. However, in contrast to the model byKalluri and Delgutte (2003b), where the spike-blocking mechanism is driven by the stimulus, the mechanism used in the present model is effectively driven by the stimulus slope since the effective PSP yields the slope of the stimulus. Thus, the present model allows, for example, to account for octopus cell responses to increasing current steps (Fig.2.7), which can not be obtained when the spike-blocking mechanism is driven by the stimulus itself (Kalluri and Delgutte,
2003b). However, since little is known about the biophysical properties that might reflect such a mechanism, we can not clearly associate the spike-blocking mechanism with distinct octopus cell properties.
2.4.3.3 The input provided by AN fibers
Although the actual number of high-spontaneous rate (> 60spikes/s) AN fibers projecting onto an octopus cell is difficult to quantify, Liberman (1993) estimated that approx. 63 AN fibers project onto the soma of an octopus cell. This is less
than the number of AN input used in this model. However, the total number of AN fibers terminating on an octopus cell is presumably several times that high as AN fiber synapses are also located on the dendrites of octopus cells (Kane, 1973;
Smith and Rhode, 1989; Oertel et al., 2000). Based on the fraction of the somatic and dendritic surface area of octopus cells that is covered by synaptic terminals and the average size of synaptic terminals on octopus cells, Kalluri and Delgutte
(2003a,b) estimated a number of up to 600 AN fiber synapses per octopus cell. The large number of inputs that is simulated by the noisy version of the hair-cell spike probability in the present study is thus justified by the large number of AN synapses observed on octopus cells.
Although the actual frequency range of AN fibers providing input to one octopus cell is also not known so far, the present model unit presumably receives input from a smaller frequency range than octopus cells. Extending the across frequency range of the model input, especially for units having a low CF, is restricted by the different traveling wave delays on the basilar membrane. Large differences in the traveling wave delays between channels that provide input to the same octopus cell disturb the input shape and thus might lead to inappropriate model responses. However, octopus cells are found to receive input from AN fibers that encode low frequencies near the cell body and from those that encode higher frequencies progressively more distally on their dendrites (Oertelet al.,2000). This ordered spatial arrangement has been suggested to compensate for the traveling wave “distortion” along the cochlea and to increase the synchronization of across-frequency input (Goldinget al.,1999). Extending the present model by such a traveling wave compensation would provide a simple way of extending the across frequency range of AN inputs, without disturbing the input shape by the differences in basilar membrane delays.
2.5. SUMMARY AND CONCLUSION 33
2.5
SUMMARY AND CONCLUSION
A functional point-neuron module was presented that allows for simulatingOI-unit
responses found in cochlear nucleus octopus cells. The PSTH of OI units reveals
one single spike at the onset of a high-frequency tone burst and no further activity during the ongoing stimulus. Thus, short ISIs do not occur in the responses of OI
units to high-frequency tones. In contrast, the same units entrain to a wide range of low-frequency tones, revealing exactly one spike per stimulus cycle and thus exhibit ISIs that are in the range of 1 ms. The present model accounts for this diversity of
OI unit’s pure-tone responses by using a biphasic “effective” PSP in combination
with a spike-blocking mechanism. The same model was also tested using more com-plex stimuli, including depolarizing and hyperpolarizing current steps, amplitude modulated stimuli and harmonic tone complexes. It accounts for the main response characteristics ofOI-unit responses found in the recorded data (from the literature).
Thus, the present model actually provides a useful means of simulatingOI-unit
re-sponses without the need of describing the dynamic properties of octopus cells in detail. Moreover, it was shown that the model can account for OI-unit responses
that can not be simulated if a coincidence-detector model was used instead. Due to its plain structure and the small set of simulation parameters, the present functional model can easily be integrated in complex models of higher auditory function, in order to investigate the role of octopus cells in higher-order auditory processing.
CHAPTER
3
A NEURAL CIRCUIT OF
MODULATION BANDPASS
FILTERS IN THE IC BASED ON
O
I
-UNIT RESPONSES OF THE CN:
PROCESSING OF SAM TONES
ABSTRACT
Periodic amplitude modulations (AM) of an acoustic stimulus are presumed to be encoded in temporal activity patterns of neurons at the early stages of the auditory system. Physiological recordings indicate, that this temporal AM code is transfor-med into a rate-based periodicity representation at the higher auditory processing stages. Especially, the bandpass shaped rate modulation transfer functions (rMTF) found in neurons at the level of the inferior colliculus (IC) (Rees and Møller, 1983;
Langner and Schreiner, 1988; Rees and Palmer, 1989; Krishna and Semple, 2000) can be assumed to represent a rate-based code of AM information, arising between the level of the cochlear nucleus (CN) and the IC. The assumption that AM informa-tion is represented by a rate-based code at the higher auditory processing stages is also supported by the psychophysical concept of amplitude modulation filters (Dau et al., 1997a,b; Ewert and Dau, 2000). The present model provides a neural circuit that transforms temporal periodicity information, provided by ideal onset OI units
in the CN, into a rate-based periodicity representation at the level of the IC. Due to the neural connectivity of the present model, bandpass shaped rMTFs with diffe-rent best modulation frequencies (BMF) are obtained that correspond to recorded rMTFs of IC neurons. The suggested neural circuit thus offers a possible neural
cor-relate to the psychophysically postulated AM filters. The model may also explain how rMTFs with a region of suppression, a further rMTF-type observed in the IC (Krishna and Semple,2000), result from neural connectivity within the auditory sy-stem. In contrast to previous modeling studies describing the formation of bandpass modulation filters in the IC, the present neural circuit employs no temporal delay lines, as well as no other continuously changing temporal parameter.
3.1. INTRODUCTION 37
3.1
INTRODUCTION
Periodic amplitude modulations are a common physical feature of sounds produced by many natural sound sources, among which are vocal chords, strings, pipes and tubes. Amplitude modulation (AM) information is utilized by the auditory system in a variety of complex auditory tasks, including speech perception (e.g.Rosen,1992), pitch perception (e.g. Schouten et al., 1962; De Boer, 1976) and auditory scene analysis (Bregman,1990). Thus, knowledge about how the auditory system extracts, encodes and processes AM information would provide an important step towards a better understanding of the higher-order auditory processes listed above. While AM information is encoded in temporal activity patterns of neurons at the early stages of the auditory system, it is generally believed that this temporal periodicity code is transformed into a rate-based code at some higher stage of auditory processing. Such a rate-based periodicity code would correspond to the psychophysical concept of amplitude modulation filters suggested to account for the frequency selectivity in the modulation domain observed in psychophysical experiments (Bacon and Grantham,
1989; Houtgast, 1989; Dau et al., 1997a,b; Ewert and Dau, 2000). However, while psychophysical experiments may provide a way of characterizing effective amplitude modulation filters, the question how such filters are represented neurally in the auditory system remains.
Physiological experiments reveal that the average spike rates of auditory-nerve (AN) fibers are largely independent of stimulus modulation (Rose and Capranica,
1985; Joris and Yin, 1992; Rhode and Greenberg, 1994b), such that AN fibers are not selective to certain modulation frequencies in terms of their spike rate. The temporal modulation transfer functions (tMTF) of AN fibers, where modulation gain is computed in response to different modulation frequencies, have a low-pass shape with cutoff frequencies below 1 kHz (Javel, 1980; Palmer, 1982; Kim et al.,
1990;Joris and Yin,1992;Rhode and Greenberg,1994b). Moreover, AM information is inherent in the interspike intervals (ISI) of AN fibers (Rose, 1970; Evans, 1978), indicating that AMs are encoded in the temporal activity patterns of AN fibers. The majority of neurons in the cochlear nuclei (CN) are found to display flat or low pass rate modulation transfer functions (rMTF), where spike rate is computed in response to different stimuli (Kim et al.,1990; Rhode, 1994a; Backoff et al.,1999). Since the temporal synchronization of CN neurons to AM stimuli exceeds that of AN fibers, temporal AM information present in the activity patterns of AN fibers seems to be enhanced by CN neurons (Frisinaet al.,1990; Kimet al.,1990;Rhode,
1994a; Rhode and Greenberg, 1994b). Thus, since CN neurons are not selective to a certain modulation frequency in terms of their spike rate, AM information can be assumed to be encoded in their temporal pattern. While AN fibers and CN
neurons have been found to synchronize to modulation frequencies as high as 1 kHz (Javel, 1980; Frisina et al., 1990; Rhode and Smith, 1986; Backoff et al., 1999), the highest modulation frequency for which temporal synchronization is observed in the auditory midbrain differs from below 120-150 Hz (Rees and Møller, 1983;
Krishna and Semple, 2000) up to 1000 Hz (Langner, 1981). Despite this diversity, which presumably results from differences in the experimental conditions of the studies, there is general agreement among authors, that the ability of neurons to synchronize to fast amplitude modulations decreases along the ascending auditory pathway (Rees and Møller,1983;Langner and Schreiner,1988). Thus, if the temporal information about fast AMs is not lost as it ascends the auditory pathway, it needs to be transformed into some other kind of representation. At the level of the IC, neurons have been found that exhibit bandpass shaped rMTFs (Rees and Møller,
1983; Langner and Schreiner, 1988; Rees and Palmer, 1989; Krishna and Semple,
2000). Thus, in contrast to CN neurons, these neurons are selective to a certain modulation frequency and respond with a maximum spike rate when stimulated with their so-called best modulation frequency (BMF). Moreover, rate BMFs have been found to be topographically organized in the central nucleus of the IC and cover a BMF range of 10-1000Hz (Schreiner and Langner, 1988, 1997). Based on these findings it can be assumed that temporal information about AMs present in the activity of CN neurons is transformed into rate-based information represented by bandpass shaped rMTFs with different BMFs between the level of the CN and the IC. Such a rate-based representation of AM information is also motivated by the psychophysical concept of amplitude modulation filters (Dau et al., 1997a,b; Ewert and Dau,2000).
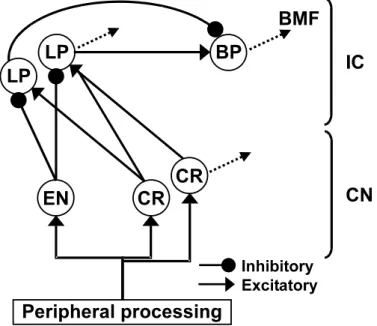
Two biologically motivated models have been suggested previously, both sug-gesting a mechanism of how temporal AM information can be transformed into a rate-based representation between CN and IC. The neural circuit suggested by
Langner(1981) (see alsoLangner and Schreiner,1988;Langner,1997a,b) consists of three functional units at the model CN stage, a trigger unit, a buildup circuit and an oscillator circuit, with each of these units being associated with a neural response type in the CN. At the model IC s