Division of Science Resources Statistics
Directorate for Social, Behavioral, and Economic Sciences
National Science Foundation
DECEMBER 2009
SpECial
REpoRt
Doctorate Recipients
from U.S. Universities
Summary Report 2007–08
Do
cto
ra
te
R
ec
ipie
nts
fro
m
U
.S
. U
niv
ers
itie
s: S
um
m
ary
R
ep
ort
2
00
7–
08
NSF 10-309
NSF 10-309
Doctorate Recipients from U.S. Universities:
Summary Report 2007–08
Special Report
Mark K. Fiegener, Project Officer
Division of Science Resources Statistics
Directorate for Social, Behavioral, and Economic Sciences
National Science Foundation
Arden L. Bement, Jr.
Director
Directorate for Social, Behavioral, and Economic Sciences
Myron P. Gutmann
Assistant Director
Division of Science Resources Statistics
Lynda T. Carlson
Mary J. Frase
Division Director
Deputy Director
Stephen Cohen
Chief Statistician
Human Resources Statistics Program
Emilda B. Rivers
Program Director
Division of Science Resources Statistics
The Division of Science Resources Statistics (SRS) fulfills the legislative mandate of the National Science Foundation Act to
provide a central clearinghouse for the collection, interpretation, and analysis of data on scientific and
engineering resources and to provide a source of information for policy formulation by other agencies of the
federal government
To carry out this mandate, SRS designs, supports, and directs periodic surveys as well as a variety of other data collections and
research projects. These surveys yield the materials for SRS staff to compile, analyze, and disseminate quantitative information
about domestic and international resources devoted to science, engineering, and technology.
If you have any comments or suggestions about this or any other SRS product or report, we would like to hear from you. Please
direct your comments to
National Science Foundation
Division of Science Resources Statistics
4201 Wilson Blvd., Suite 965
Arlington, VA 22230
Telephone: (703) 292-8780
Fax: (703) 292-9092
E-mail: [email protected]
DECEMBER 2009
Information and data from the Division of Science Resources Statistics are available on the Web at http://www.nsf.gov/statistics/.
To request a printed copy of this report go to http://nsf.gov/publications/orderpub.jsp or call (703) 292-PUBS (7827). For NSF’s
Telephonic Device for the Deaf, dial toll-free (800) 281-8749 or (703) 292-5090.
NSF 10-309
iii
Preface ... vi
Acknowledgments ... vii
Introduction ... viii
Organization of the Report ... viii
Data Availability and Related Publications ... viii
Key Findings: 2008 ... 1
Trends in the Numbers of New Research Doctorate Recipients ... 1
Financial Resources and Indebtedness ... 1
Postgraduation Plans, Employment, and Location ... 1
Trends among Doctorate Recipients ... 2
Overall Trends and Rates of Change ... 2
Doctorate-Granting Institutions ... 2
Field of Study ... 4
Demographic Characteristics ... 6
Sex ... 6
Race/Ethnicity of U.S. Citizens and Permanent Residents ... 6
Citizenship ... 10
Parental Education Background ... 11
Educational History of Doctorate Recipients ... 11
Time to Degree ... 13
Baccalaureate to Doctorate ... 13
Graduate School to Doctorate ... 14
Age at Doctorate ... 14
Doctorate Recipients with Disabilities ... 15
Financial Support and Education-Related Debt of Doctorate Recipients ... 16
Sources of Financial Support ... 16
Levels of Education-Related Debt ... 16
Postgraduation Plans, Employment, and Location ... 19
Definite Commitments ... 19
Employment and Employment Sector ... 19
Postdoctoral Training or Study ... 20
Sources of Financial Support for Postdoctoral Appointments ... 21
Postgraduate Location of Temporary Visa Holders ... 21
Data Tables: 2008... 23
2007 SED Data Supplement ... 151
Appendix A. Technical Notes ... 277
Survey Eligibility ... 277
Survey Universe ... 277
Data Collection ... 278
Survey Response Rates ... 279
Disclosure Protection ... 279
Changes to Survey Variables ... 282
Citizenship ... 282
Debt ... 282
Median Computation ... 282
Postdoctoral Plans to Stay in the United States ... 286
Race and Hispanic Ethnicity ... 286
Research Doctoral Degree ... 286
Definitions ... 286
Appendix B: Survey of Earned Doctorates Questionnaires... 289
Academic Year 2006–07 ... 290
NSF 10-309
v
Figure
Figure 1 Annual rate of change in doctorates awarded by U.S. colleges and universities: 1958–2008 ... 2
Figure 2 Doctorates awarded by U.S. colleges and universities: 1957–2008 ... 3
Figure 3 Doctorates granted, by percentile of doctorate-awarding institutions: 2008 ... 3
Figure 4 Top 20 doctorate-granting states: 2008 ... 4
Figure 5 Science and engineering doctorates awarded, by broad field of study:
Selected years, 1978–2008 ... 5
Figure 6 Doctorates awarded in education, humanities, and other fields: Selected years, 1978–2008 ... 5
Figure 7 Percentage distribution of doctorate recipients, by broad field of study: 1978 and 2008 ... 6
Figure 8 Doctorate recipients, by sex: 1998–2008 ... 7
Figure 9 Female doctorate recipients, by broad field of study: Selected years, 1978–2008 ... 7
Figure 10 Doctorates awarded to U.S. citizen and permanent resident racial/ethnic minorities,
by selected race/ethnicity: Selected years, 1988–2008 ... 8
Figure 11 Doctorates earned by U.S. citizen and permanent resident racial/ethnic minorities,
by selected race/ethnicity: 1988 and 2008 ... 8
Figure 12 Doctorates earned by U.S. citizen and permanent resident racial/ethnic minorities,
by broad field of study: 2008 ... 9
Figure 13 Distribution of doctorates earned by male and female U.S. citizens and permanent
residents, by race/ethnicity: 2008 ... 9
Figure 14 Highest educational attainment of either parent of doctorate recipients: 1978–2008 ... 12
Figure 15 U.S. citizen and permanent resident doctorate recipients who earned a master’s degree,
by broad field of doctoral study and selected race/ethnicity: 2008 ... 12
Figure 16 Median years to doctorate, from baccalaureate award and from graduate school entry,
and age at doctorate: Selected years, 1983–2008 ... 14
Figure 17 Distribution of age at time of doctorate, by broad field of study: 2008 ... 14
Figure 18 Primary source of financial support for doctorate recipients, by broad field of study: 2008 ... 17
Figure 19 U.S. citizen and permanent resident doctorate recipients with levels of graduate
school debt greater than $30,000, by broad field of study and race/ethnicity: 2008 ... 18
Figure 20 Postgraduation plans of doctorate recipients with definite postgraduation commitments,
by broad field of study: 2008 ... 20
Figures
Reporting of Citizenship Status.
In past editions of the
Summary Report, tables reporting citizenship status
have displayed U.S. citizens, permanent residents, and
temporary visa holders as separate citizenship categories.
Beginning with this year’s edition only two citizenship
categories will be reported, and the data of U.S. citizen
doctorate recipients will be combined with that of
permanent resident doctorate recipients.
New Race Category.
Respondents to the SED who indicated
more than one race will now be reported in a separate
“multi-race” category in all Summary Report tables reporting
race/ethnicity data. In previous Summary Reports these
respondents had been grouped into the “Other/Unknown”
race/ethnicity category.
New Publisher.
The SED Summary Report is now published
by the National Science Foundation on behalf of the other
federal sponsors. Previous Summary Reports had been
published by the SED survey contractor.
T
his year’s edition of the Summary Report from the Survey
of Earned Doctorates (SED) reflects six changes from
previous editions.
Multiple Year Format.
Both 2007 and 2008 data are presented
in this report to expedite release of 2 years of data. Only a
few 2007 SED data tables could be released in 2008, pending
development of new data protection procedures. The full
complement of 2007 SED data tables is released in a special
section in this report, without accompanying discussion. The
narrative section of the report discusses the results of the 2008
SED, with figures and 2008 summary and detailed data tables.
Future editions of the SED Summary Report will return to a
single-year format.
Report Organization.
The current-year summary and detailed
data tables now follow the body of the report. The 2007 data
supplement follows the current-year data tables. Locating all
data tables together should make it easier for readers to find
the data they want. Appendix A now provides the technical
notes and includes information for both the 2007 and 2008
SED cycles. Appendix B includes the questionnaires for both
survey years.
New Disclosure Protection Procedure.
A new disclosure
protection procedure has been applied to detailed data tables
36 and 37 (formerly appendix tables A-1 and A-2), resulting
in minor revisions to the tables. In a series of outreach meet
-ings held late in 2008, representatives of the SED data user
community provided important insights that shaped the design
of this new procedure. See “Disclosure Protection,” appendix
A, for further detail.
NSF 10-309
vii
(NEH), Greg Smith (USDA), Mabel Matthews (NASA) and
Mark Fiegener, SED Project Manager (NSF, Division of
Science Resources Statistics), who also oversaw the
prepara-tion of this report. Nancy Leach, Mary Frase, and Stephen
Cohen at NSF/SRS provided additional review and comment.
Reviewers Nathan Bell (Council of Graduate Schools), Ralph
Ferguson (Texas Tech University), and Suzanne Ortega
(University of New Mexico) provided valuable comments.
Staff at the National Opinion Research Center (NORC)
conduct survey operations for the SED and prepared this
report. NORC staff who have played a valuable role in the
SED are Syed Ahsan, Mireya Dominguez, Brianna
Groenhout, Tom Hoffer, Lino Jimenez, Sharnia Lashley,
Mary Ann Latter, Lindsay Virost, Kristy Webber, Vincent
Welch Jr., and Mary Hess.
T
he conduct of the Survey of Earned Doctorates (SED),
the maintenance of the SED, and resulting publications
are funded jointly by the National Science Foundation (NSF),
National Institutes of Health (NIH), U.S. Department of
Education (USED), National Endowment for the
Humani-ties (NEH), U.S. Department of Agriculture (USDA), and
National Aeronautics and Space Administration (NASA).
These federal agencies gratefully acknowledge the support
and assistance of graduate deans and their staff, registrars,
dissertation officers, and other administrators who
partici-pate in the SED effort and contribute to its success. Heartfelt
thanks are extended to the new research doctorate recipients
who completed the 2008 survey.
Representatives from the six sponsoring agencies provided
constructive reviews of the survey design and analysis.
Jennifer Sutton (NIH), Nancy Borkow (USED), Frank Shaw
doctorate recipients take to the research doctorate are reported
for the 2008 cohort, as well as data on the average amount of
time taken to complete the doctoral degree, doctorate
recipi-ents reporting disabilities, sources of financial support during
graduate school, and the postgraduation status and plans of
doctorate recipients.
The data tables follow the main text, beginning with summary
data tables for 2008 (tables 1–35), which display the numbers
and percentages from which the figures and the numbers cited
in the text are drawn. Detailed data tables for 2008 research
doctorate recipients (tables 36–46) and for the previous
10-year period (1998–2008, tables 47–50) follow the summary
2008 data tables.
Data collected by the 2007 SED are presented as a data supple
-ment without accompanying narrative. These supple-mentary
summary and detailed data tables follow the 2008 tables.
Appendix A supplies technical notes, including field of study
classifications, research degree titles included in the SED,
response rates, and other information related to data collection
and tables and figures in the report. Appendix B contains the
SED questionnaires for the 2007 and 2008 academic years.
Data Availability and Related Publications
This report is available on the Web at http://www.nsf.gov/
statistics/doctorates/. The 2007 and 2008 data tables are
available for download in Excel and PDF file formats.
NSF publishes data from the SED annually in the
Science and
Engineering Doctorate Awards
series of detailed statistical
tables and in InfoBriefs and Special Reports that focus on
selected topics. These reports, the annual Summary Report
from recent years, SED questionnaires, and information on
SED methodology are also online at http://www.nsf.gov/
statistics/doctorates/.
A set of detailed statistical tables that reports national-level
counts of doctorate recipients by fine field of doctorate, sex,
D
octorate Recipients from U.S. Universities: Summary
Report 2007–08
is the 41st in a series of reports on
research doctorates awarded by universities in the United
States. Data presented in this report were collected by the
Survey of Earned Doctorates (SED).
1The SED has been
conducted annually since 1957 and is sponsored by six federal
agencies: the National Science Foundation (NSF), National
Institutes of Health (NIH), U.S. Department of Education
(USED), U.S. Department of Agriculture (USDA), National
Endowment for the Humanities (NEH), and National
Aero-nautics and Space Administration (NASA).
The SED is a census of all individuals who receive a research
doctorate from a U.S. academic institution in a given
academic year (1 July through 30 June of the following year).
This report presents data from the 2007 and 2008 SED. The
2008 census covered 48,802 individuals who earned research
doctorates in the academic year ending June 2008; the 2007
census covered 48,112 individuals who earned research
doctorates in the academic year ending June 2007.
All survey responses become part of the Doctorate Records
File (DRF), a cumulative database on research doctorate
recipients from 1920 to 2008. The DRF now contains
1,745,673 records of research doctoral degrees earned over the
last 89 years at U.S. institutions.
Organization of the Report
The body of this report discusses the results of the 2008 SED,
beginning with a summary of key findings. Trends in the
numbers and percentages of doctorate recipients through 2008
are reported by the broad fields in which doctorate recipients
earn their degrees, and by sex, race/ethnicity, and
citizen-ship. Cross-sectional data on the educational pathways that
Introduction
1 The SED collects information on research doctorate recipients only. This survey differs from the U.S. Department of Education’s Integrated Postsecondary Education Data System (IPEDS), which collects the num-ber of doctoral degrees awarded per institution by field of study. For an evaluation of the differences, see National Science Foundation, 1993, Science and Engineering Doctorates: 1960–1991, NSF 93-301, pp. 2–6, Washington, DC.
NSF 10-309
ix
in
Science and Engineering Doctorates: 1960–91
(NSF
93-301). This publication is out of print, but tables from it
are available on request.
Access to restricted data for researchers interested in
analyzing microdata can be arranged through a licensing
agreement (http://www.nsf.gov/statistics/database.
cfm#MICRODATA).
The SED is conducted by the National Opinion Research
Center (NORC) under contract to NSF. The survey contractor
can produce on-demand tabulations of the SED data (at cost),
customized to the data requester’s research specifications.
For more information on additional sources of SED data,
please contact the SED project officer, Mark Fiegener
([email protected]; 703-292-4622).
and race/ethnicity for U.S. citizens and permanent residents—
formerly available through the survey contractor—will also
be published by NSF. These will be available on the Web
beginning early 2010.
SED data are also included in the series
Science and
Engineering Degrees
and
Science and Engineering
Degrees by Race/Ethnicity of Recipients; Science and
Engineering Indicators;
and
Women, Minorities, and
Persons with Disabilities in Science and Engineering.
Survey data from earlier years of the SED are published
in the Special Report
U.S. Doctorates in the 20th Century
(NSF 06-319), which provides an overview of the
develop-ment of the American system of doctoral education from
1900 to 1999. All of these publications are available online
at http://www.nsf.gov/statistics/. SED data are also included
Key Findings: 2008
Trends in the Numbers of New Research
Doctorate Recipients
The 48,802 research doctorates awarded in 2008 is the
highest number in the history of U.S. higher education,
but growth rates have slowed in recent years (table 1).
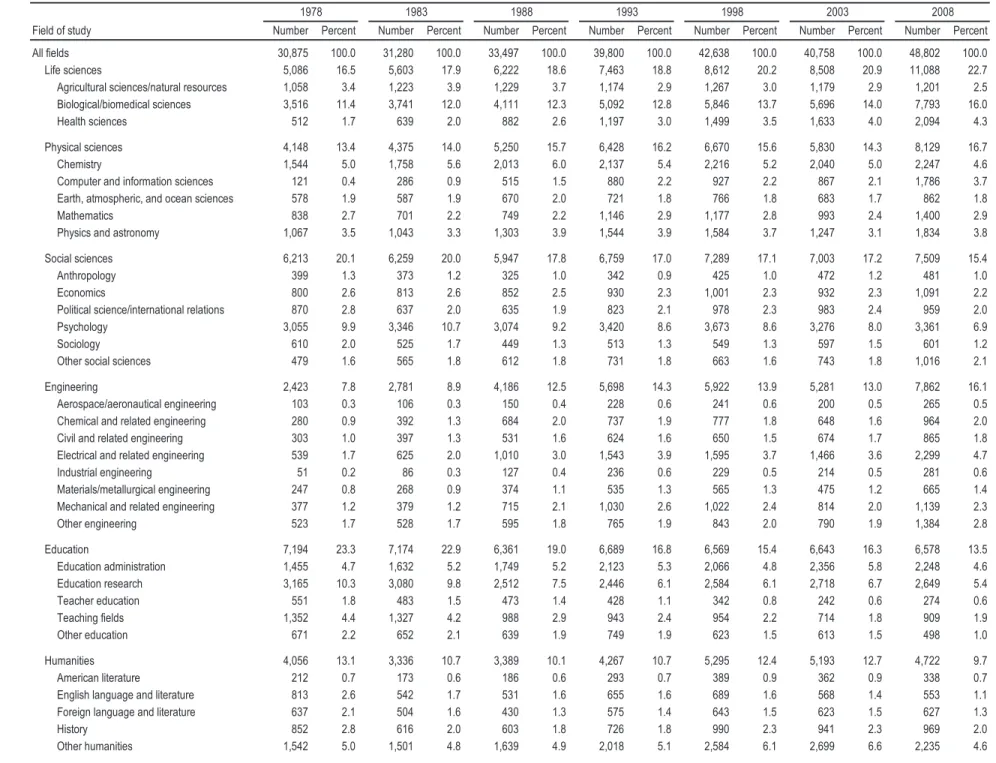
Life sciences accounted for 11,088 research doctorates
awarded in 2008, the largest number by broad field
(table 5).
Women received 46% of all research doctorates awarded
in 2008, the 13th consecutive year in which women
received more than 40% of doctorates awarded (table 7).
A total of 6,981 U.S. citizens and permanent residents
who are members of racial/ethnic minority groups were
awarded research doctorates in 2008—23% of the U.S.
citizens and permanent residents who earned research
doctorates and reported race/ethnicity (table 8).
Asians earned 2,543 research doctorates in 2008, more
than members of any other U.S. racial/ethnic minority
group (table 8).
Of graduates with known citizenship status, 67% were
U.S. citizens or permanent residents and 33% were
non-U.S. citizen temporary visa holders (table 11).
China (including Hong Kong) was the country of origin
for the largest number of non-U.S. graduates in 2008,
with 4,526 (table 12).
The median total time span from baccalaureate to
doctorate among graduates was 9.4 years; median
duration between starting and completing graduate
school was 7.7 years (table 18).
Financial Resources and Indebtedness
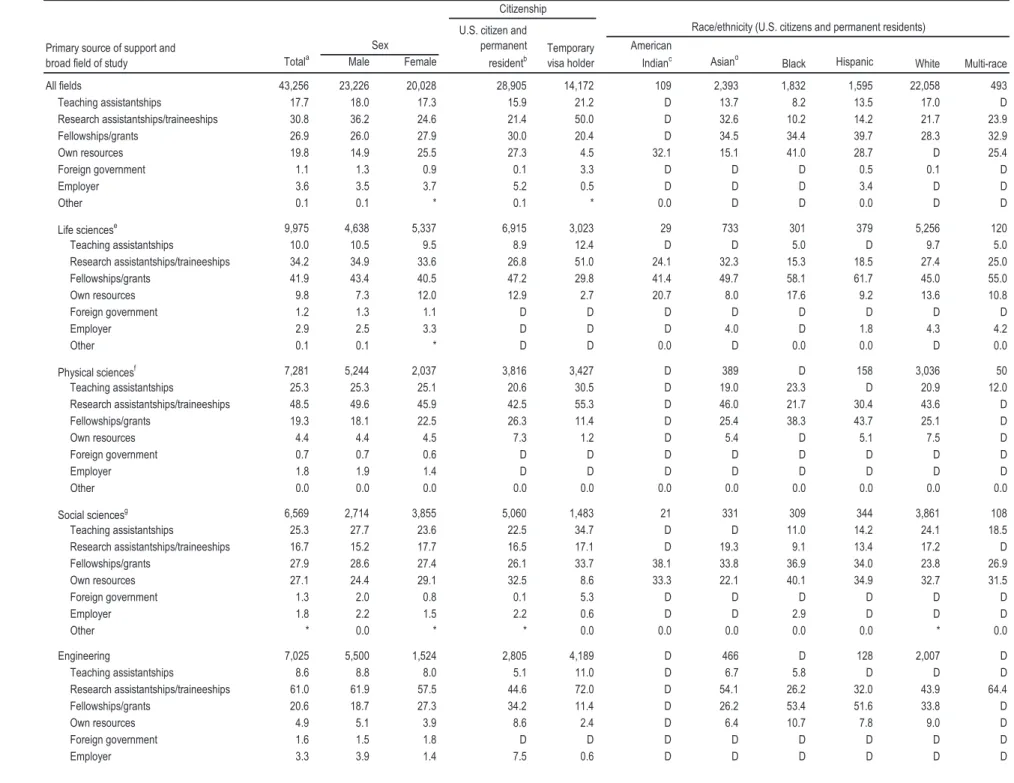
Three fourths of graduates reported teaching
assistantships, research assistantships/traineeships, and
fellowships/grants to be their primary source of support
during graduate school (table 22).
Just over half (53%) of graduates reported having no
graduate or undergraduate education-related debt, 19%
reported cumulative debt of $20,000 or less, and 8%
reported debt over $70,000 (table 23).
Postgraduation Plans, Employment,
and Location
Sixty-nine percent of graduates reported having
definite postgraduation plans (table 27). Of those, 64%
planned to work and 36% planned postdoctoral study,
predominately in the broad fields of life sciences and
physical sciences (table 28).
Of the graduates with firm commitments for U.S.
employment, 51% planned to work in academe, 27%
planned to work in industry or be self-employed, and 6%
planned to work in government (table 29).
I
ndividual research doctorate recipients from U.S.
universities are the primary respondents to the Survey
of Earned Doctorates.
2Throughout this report, the terms
“doctorate” and “doctoral degree” are used to represent any
of the research doctoral degrees covered by the survey.
Overall Trends and Rates of Change
During the 12-month period ending 30 June 2008, U.S.
universities awarded 48,802 research doctoral degrees,
compared with 48,112 in 2007 and 45,615 in 2006 (table 1).
Although the 2008 total is the largest number of research
doctorates awarded in the history of U.S. higher education,
the rate of increase over 2007 was small, 1.4% (figure 1).
The long-term trend in the number of new research doctorates
is characterized by considerable growth. Since the SED began
in 1957, the number of doctorates granted by U.S. universities
has, on average, increased by about 3.5% per year. Between
1961—when the number of annual doctorates awarded
surpassed 10,000 for the first time—and 1971, the number of
doctorates awarded grew at an average annual rate of nearly
12%, and the total almost tripled (31,867). From 1972 to 1985
the growth rate slowed, then declined, and the number of
doctorates awarded annually stabilized at about 31,000. In
1986, a second period of growth began that persisted until
1998, when 42,638 research doctorates were awarded. From
1998 to 2002, the number of doctorates awarded fluctuated,
reaching a low point in 2002. Growth resumed from 2003
to 2008, leading to an all-time high in 2008 for number of
doctorates earned (figure 2, table 1).
Doctorate-Granting Institutions
The SED project closely monitors the universe of institu
-tions that grant research doctorates, and it annually reviews
Trends among Doctorate Recipients
FIGURE 1. Annual rate of change in doctorates awarded by U.S. colleges
and universities: 1958–2008
Annual percentage change
SOURCE: NSF/NIH/USED/USDA/NEH/NASA, 2008 Survey of Earned Doctorates. 1958 1963 1968 1973 1978 1983 1988 1993 1998 2003 2008 –5 0 5 10 15 20
Annual percentage change
Long-term average (3.5%)
all accredited institutions recognized by the U.S.
Depart-ment of Education in its Integrated Postsecondary
Educa-tion Data System (IPEDS). The data-collecEduca-tion contractor
for the SED contacts newly identified institutions,
deter-mines whether those institutions grant research doctorates
(see appendix A), and adds institutions to the SED universe
when they award a qualifying degree. Detailed data tables
45a and 45b display the full list of institutions that granted
research doctorates in 2008.
During the 2008 academic year, there were 421 universities
in the United States and Puerto Rico that awarded at least one
research doctorate. The mean number of doctorates awarded
per institution was 116, and the median was 43 (table 2). As
the substantial difference between the mean and the median
indicates, a relatively small number of institutions award
a disproportionately large number of doctorates. The top
10% of institutions granted nearly half (46%) of all
doctor-ates in 2008, and institutions in the 80th to 89th percentiles
accounted for more than one fifth (22%) (figure 3).
The trend data in table 2 show that the median number of
degrees awarded per institution grew rapidly during the late
2 Doctorates are reported by academic year (from 1 July of one year through 30 June of the following year) and include research doctorates in all fields. Research doctoral programs are oriented toward preparing students to make original intellectual contributions in a field of study and typically entail the completion of a dissertation. Doctoral degrees, such as the PhD, DSc, and research EdD, are covered by this survey; profes-sional degrees (e.g., MD, DDS, DVM, JD, PsyD, DMin) are not. A full list of included degrees is in appendix A. Before 2001, the SED covered only the first research doctorate earned. Since then, the SED has also cov-ered the second research doctorate. In 2008, a total of 109 individuals earned a second research doctorate.
NSF 10-309
3
FIGURE 2. Doctorates awarded by U.S. colleges and universities: 1957–2008
Number of doctorate recipients
See Table 1.
SOURCE: NSF/NIH/USED/USDA/NEH/NASA, 2008 Survey of Earned Doctorates.
19 57 19 58 19 59 19 60 19 61 19 62 19 63 19 64 19 65 19 66 19 67 19 68 19 69 19 70 19 71 19 72 19 73 19 74 19 75 19 76 19 77 19 78 19 79 19 80 19 81 19 82 19 83 19 84 19 85 19 86 19 87 19 88 19 89 19 90 19 91 19 92 19 93 19 94 19 95 19 96 19 97 19 98 19 99 20 00 20 01 20 02 20 03 20 04 20 05 20 06 20 07 20 08 0 5,000 10,000 15,000 20,000 25,000 30,000 35,000 40,000 45,000 50,000
FIGURE 3. Doctorates granted, by percentile of doctorate-awarding institutions: 2008
Percent of doctorates grantedSee table 45.
SOURCE: NSF/NIH/USED/USDA/NEH/NASA, 2008 Survey of Earned Doctorates. 90–100 80–89 70–79 60–69 50–59 Percentile 40–49 30–39 20–29 10-19 0–9 0 5 10 15 20 25 30 35 40 45 50
1960s, from 43 in 1968 to 55 in 1970. Following the end of the
Vietnam War in 1972 and the enrollment boosts that
accom-panied the availability of student deferments from military
service, the median number quickly dropped to 42 in 1973
and has vacillated between 35 and 46 since.
In 2008 the University of California-Berkeley granted the
largest number of doctorates, 856, or 2% of all doctorates
awarded that year, followed by the University of Texas-Austin
(821), the University of Wisconsin-Madison (740), the
Univer-sity of Illinois–Urbana-Champaign (735), and the UniverUniver-sity
of California-Los Angeles (724). In 2008 (as has been the case
for the past several years), the 10 institutions awarding the
highest number of doctoral degrees granted approximately
15% of all doctorates (table 3, detailed data tables 45a, 45b).
Among the states, California universities led the nation by
awarding 5,925 doctorates, or 12% of all doctorates in 2008
(figure 4, table 4). New York institutions followed with 3,986,
then Texas (3,384), Massachusetts (2,591), Pennsylvania
(2,463), Illinois (2,362), Florida (2,018), Ohio (1,921), and
Michigan (1,599). These nine states accounted for 54% of all
doctorates awarded in 2008.
Field of Study
There were 292 fields of specialization into which the SED
classified research doctoral degrees in 2008 (listed in the SED
questionnaire, appendix B). Because fields of specialization are
dynamic entities that reflect the evolving programs of researchers
and their constituencies, the SED list is assessed periodically to
identify emerging fields and is modified, as needed, to
accom-modate changes in the world of doctoral education.
Consistent with past practice in presenting the SED data,
the fields of specialization are grouped into seven broad
FIGURE 4. Top 20 doctorate-granting states: 2008
Number of doctoratesSee table 4.
SOURCE: NSF/NIH/USED/USDA/NEH/NASA, 2008 Survey of Earned Doctorates. CA NY TX MA PA IL FL OH MI NC State GA MD IN VA NJ WI MN AZ MO WA 1,000 0 2,000 3,000 4,000 5,000 6,000
fields: life sciences (including agricultural sciences/
natural resources, biological/biomedical sciences, and
health sciences), physical sciences (including mathematics
and computer and information sciences), social sciences
(including psychology), engineering, education, humanities,
and a heterogeneous group classified as other fields (including
business, communication, social work, and theological
programs). Detailed data tables 36, 37, and 47 report numbers
of doctorate recipients by field of specialization.
The institutions that in 2008 granted the largest numbers of
doctorates in each of the seven broad fields are listed in table
3. The Johns Hopkins University led all universities in life
sciences (235), the University of California-Berkeley granted
the most doctorates in the physical (192) and social sciences
(159), and the Georgia Institute of Technology granted the
most engineering doctorates (319). Teachers College of
Columbia University led all universities in education doctor
-ates awarded (154), Harvard had the highest total in the
humanities (138), and the University of Texas-Austin granted
the most doctorates in the diverse “other fields” category (70).
The numbers of doctorates awarded in the seven broad fields
were also concentrated in a relatively small number of
insti-tutions. The 10 institutions that granted the largest number
of doctorates awarded 15% of all doctorates in 2008, but the
concentration was higher in five of the seven broad fields:
27% in engineering, 22% in humanities, and 18% in life
sciences, physical sciences, and other fields (table 3).
The slight overall increase of 1.4% in doctorates awarded
between the 2007 and 2008 academic years was a result of
increases in five of the seven broad fields: life sciences and
social sciences were each up 4%, education and engineering
by 2% each, and physical sciences by 1%. The increases in
NSF 10-309
5
In the broad field of engineering, electrical and related
engineering showed considerable growth. Nearly one-third
of the total increase in engineering doctorate recipients
from 1978 to 2008 was in this field, which increased from
539 in 1978 to 2,299 in 2008. The subfield of industrial
engineering showed the greatest growth during this 30-year
period; however, the absolute numbers for this field are still
relatively small (281 in 2008).
those fields were partially offset by a decrease in humanities
(8%) and other fields (2%) (detailed data table 47).
Since 1990 life sciences has been the largest broad field, and
11,088 doctorates were awarded in 2008. Over the 5-year period
2003–08, the number of doctorates awarded in engineering,
physical sciences, and life sciences have shown the largest
increases: 49%, 39%, and 30%, respectively (table 5). Doctorate
completions in education and humanities were slightly lower—
just under 1% and 9% fewer degrees awarded, respectively, in
2008 than were awarded 5 years earlier (figures 5, 6; table 5).
Life sciences, physical sciences, social sciences, and
engi-neering—the four broad fields that together constitute
“science and engineering” (S&E)—represented 71% of all
doctorates awarded in 2008. S&E doctorates accounted for
67% of all doctorates in 1998, 65% of the total in 1988, and
58% in 1978 (table 5).
The 30-year comparisons for all seven broad fields are shown
in figure 7. The relative shares of graduates in life sciences,
physical sciences, and engineering were greater in 2008
than in 1978, relative shares of graduates in social sciences,
humanities, and education were smaller, and relative shares
of graduates in other fields in 1978 and 2008 were about the
same (figure 7). At the major field level,
biological/biomed-ical sciences (within life sciences), computer and information
sciences (within physical sciences), and electrical and related
engineering were the fields that showed the greatest increase
in their relative share over the past 30 years (5 percentage
points for biological sciences, and 3 percentage points for
computer and information science and electrical and related
engineering). Education research showed the greatest decline
in relative share, down 5 percentage points in 2008 as
compared with 1978 (table 5).
The numbers of doctorate recipients in the largest subfields
within the seven broad fields are shown in table 5. The main
fields of growth within life sciences were health sciences,
which grew from 512 doctorate recipients in 1978 to 2,094 in
2008, and biological/biomedical sciences, which grew from
3,516 to 7,793. Within these two subfields, the fine fields that
increased the most over the past decade are epidemiology,
genetics/genomics, and neurosciences.
In physical sciences, the most growth occurred in computer
and information sciences, increasing from 121 doctorate
recip-ients in 1978 to 1,786 in 2008. The largest growth in social
sciences was in the diverse “other social sciences” subfield.
Within this subfield, the fine fields of geography, area/ethnic/
cultural/gender studies, and public policy analysis experienced
the most growth over the past decade (detailed data table 47).
FIGURE 5. Science and engineering doctorates awarded, by broad field of
study: Selected years, 1978–2008
Number of doctorates
See table 5.
SOURCE: NSF/NIH/USED/USDA/NEH/NASA, 2008 Survey of Earned Doctorates.
1978 1983 1988 1993 1998 2003 2008 0 2,000 4,000 6,000 8,000 10,000 12,000 Life sciences Physical sciences Social sciences Engineering
FIGURE 6. Doctorates awarded in education, humanities, and other fields:
Selected years, 1978–2008
Number of doctorates
See table 5.
SOURCE: NSF/NIH/USED/USDA/NEH/NASA, 2008 Survey of Earned Doctorates.
1978 1983 1988 1993 1998 2003 2008 0 2,000 4,000 6,000 8,000 10,000 12,000 Education Humanities Other fields
The numbers of new doctorate recipients increased in two
of the three broad non-S&E fields (humanities and other
fields); however, there was a decrease in the proportion of
the cohort that earned doctoral degrees in humanities. The
largest growth in humanities subfields was in “other
humani-ties.” The detailed field totals in detailed data table 47
indi-cate that, over the past decade, the other humanities fields
with increasing numbers of doctorate recipients included
American/U.S. studies, archaeology, and religion/religious
studies. Within other fields, the largest growth was seen in
the subfield of business and management, from 713 in 1978 to
1,437 in 2008.
The numbers of doctorates awarded in education dropped
over the 30-year period. The only subfield within education
that showed growth from 1978 to 2008 was education
admin-istration, from 1,455 doctorates to 2,248 (table 5, detailed data
table 47).
Demographic Characteristics
Sex
In 2008, the number of doctorates awarded to men rose by 95
over the previous year, and doctorates awarded to women rose
by 612 (figure 8; detailed data tables 49, 50). Women’s share of
all doctorates earned in 2008 was 46%, similar to that in 2007
(table 6). 2008 was the 13th consecutive year in which the
representation of female doctorate recipients has surpassed
40%. Women constituted 45% of all doctorate recipients in
2003, 42% in 1998, and 27% in 1978 (table 6).
FIGURE 7. Percentage distribution of doctorate recipients, by broad field of study: 1978 and 2008
PercentSee table 5.
SOURCE: NSF/NIH/USED/USDA/NEH/NASA, 2008 Survey of Earned Doctorates.
Field of study
Life sciences Physical sciences Social sciences Engineering Education Humanities Other fields 0 5 10 15 20 25 1978 2008
The proportion of doctorates earned by women has also grown
consistently within all of the broad fields of study. Women
constituted over two thirds (67%) of all education doctorate
recipients for 2008 and were the majority in social sciences
(58%), life sciences (53%), and humanities (52%). The
repre-sentation of women among doctorate recipients in physical
sciences and engineering for 2008 was 28% and 22%,
respec-tively (figure 9). However, these percentages represent
signifi-cant increases over the last 30 years. In 1978, when 27% of all
doctorate recipients were women, 10% of the doctorates in
phys-ical sciences and 2% in engineering were awarded to women.
Less dramatic but similar long-term trends are discernible in
other broad fields as well. Between 1978 and 2008 the
propor-tion of female doctorate recipients increased from 23% to 53%
in the life sciences, from 31% to 58% in the social sciences, and
from 38% to 52% in humanities fields (figure 9, table 6).
In 2008 women constituted 41% of S&E doctorate recipients
and 58% of those earning doctorates in non-S&E fields. Of
the major fields that evidenced greater than 60% growth
in the proportion of women over the past decade, all were
in engineering (table 7). The largest growth in the share of
female doctorate recipients from 1998 to 2008 was observed
in other engineering (80%), electrical and related engineering
(72%), industrial engineering (63%), and
aerospace/aeronau-tical engineering (63%)
Race/Ethnicity of U.S. Citizens and
Permanent Residents
A total of 6,981 U.S. citizens and permanent residents who
are members of racial/ethnic minority groups were awarded
NSF 10-309
7
of the minority groups in 2008, followed by blacks (2,030),
Hispanics (1,765), persons of multiple race (520), American
Indians (123), and Native Hawaiians (96). A total of 249 U.S.
citizens reported that they were not Hispanic but did not
report their racial background in the 2008 survey. These
indi-viduals are not counted here as racial/ethnic minorities. They
doctorates in 2008, 23% of the U.S. citizens and permanent
residents who earned research doctorates and reported race/
ethnicity (table 8).
3(In this report, American Indians, Asians,
blacks, Hispanics, Native Hawaiians, and individuals who
reported more than one race are considered to be minority
racial/ethnic groups). This number is higher than in 2007,
when 6,587 minority group members earned research
doctor-ates (22% of the total) (detailed data table 48).
Among U.S. citizens and permanent residents who reported
race/ethnicity, Asians earned the most doctorates (2,543)
FIGURE 8. Doctorate recipients, by sex: 1998–2008
Number of doctoratesSee tables 49 and 50.
SOURCE: NSF/NIH/USED/USDA/NEH/NASA, 2008 Survey of Earned Doctorates.
1998 1999 2000 2001 2002 2003 2004 2005 2006 2007 2008 0 5,000 10,000 15,000 20,000 25,000 30,000 Male Female
FIGURE 9. Female doctorate recipients, by broad field of study: Selected years, 1978–2008
Percent
See table 6.
SOURCE: NSF/NIH/USED/USDA/NEH/NASA, 2008 Survey of Earned Doctorates.
Field of study
Life sciences Physical sciences Social sciences Engineering Education Humanities Other fields
0 10 20 30 40 50 60 70 1978 1988 1998 2008
3 American Indians or Alaska Natives are referred to as American Indians in this report, blacks or African Americans are referred to as blacks, and Native Hawaiians or Other Pacific Islanders are referred to as Native Hawaiians.
and the Native Hawaiians are grouped in the “other” category
and are not shown separately in table 8 or figure 10.
4The number of minority doctorate recipients among U.S.
citizens and permanent residents in 2008 was 21% higher
than the total in 2003 and 19% higher than in 1998. Doctorate
production among non-Hispanic whites showed a more
modest increase (7%) from 2003 to 2008 and decreased by
4% from 1998 to 2008.
Although rates of change have varied between 1988 and
2008, the historical trend has been growth in the number of
doctorates awarded to racial/ethnic minorities throughout the
entire 20-year period. The 20-year increases were greater for
Hispanics (154%), than for blacks (110%), Asians (106%), and
American Indians (31%) (figures 10, 11; table 8).
Minority group members were most highly represented in
2008 in the broad fields of engineering (27% of U.S. citizens
and permanent residents earning doctorates), education (26%),
and other fields (26%). The lowest percentages of
minori-ties were in humaniminori-ties (18%) and physical sciences (20%)
(figure 12). The proportional representation of the different
minority groups varied by broad field. Asians were the
largest contingent in engineering, physical sciences, and life
sciences, representing 62%, 54%, and 47%, respectively, of
all minority group members earning doctorates in those broad
fields during the 2008 academic year. Blacks were the largest
minority population in education (53%) and other fields
(44%), and Hispanics were the largest minority population in
social sciences (34%) and humanities (32%). This pattern of
relative representation has been consistently observed since
1988, except in the social sciences and other fields (table 8).
(See table 9 for the numbers of minority doctorate recipients
in each of the 25 subfields in 2008.)
The pattern of growth for the aggregate U.S. citizen and
permanent resident minority populations also held for
most of the separate minority groups within most of the
seven broad fields of study from 1988 to 2008. The general
pattern for minority recipients has been one of increases
from 1988 to 2008. Within the broad fields of study,
however, there were some noteworthy trends. One was that
the number of American Indian doctorate recipients fell in
FIGURE 10. Doctorates awarded to U.S. citizen and permanent resident
racial/ethnic minorities, by selected race/ethnicity: Selected years,
1988–2008
Number of doctorates
See table 8.
SOURCE: NSF/NIH/USED/USDA/NEH/NASA, 2008 Survey of Earned Doctorates.
1988 1993 1998 2003 2008 0 500 1,000 1,500 2,000 2,500 3,000 American Indian Asian Black Hispanic
FIGURE 11. Doctorates earned by U.S. citizen and permanent resident
racial/ethnic minorities, by selected race/ethnicity: 1988 and 2008
PercentSee table 8.
SOURCE: NSF/NIH/USED/USDA/NEH/NASA, 2008 Survey of Earned Doctorates. American Indian Asian
Race/ethnicity Black Hispanic 0 2 4 6 8 10 1988 2008
4 Following the federal standards established for the 2000 decennial census of the U.S. population, the SED changed the way in which race and ethnicity were requested starting with the 2001 questionnaire. The new format asked respondents to mark one or more racial categories that apply to them, rather than a single category as had been requested since 1974, when race and ethnicity questions were first added to the SED questionnaire. Additional changes included separating Pacific Islanders from Asians and creating a new category, Native Hawaiians or Other Pacific Islanders, and adding a Cuban response option to the Hispanic ethnicity question. The 2008 SED questionnaire is provided in appendix B.
NSF 10-309
9
Among U.S. citizens and permanent residents, the balance of
male and female doctorate recipients in 2008 varied among
racial/ethnic groups. Just over half (51%) of doctorates earned
by whites were awarded to women. For the third straight
year, women were the majority doctorate recipients in all U.S.
citizen and permanent resident minority populations: 64% of
blacks, 58% of Hispanics, 59% of American Indians, 55% of
Asians, and 55% of multiracial doctorate recipients (figure 13;
detailed data tables 48–50).
Table 10 lists the universities that awarded the largest number
of doctorates to members of minority racial/ethnic groups
every broad field but the life sciences in 2008 relative to
1998.
5Moreover, increases in black and Hispanic
represen-tation within the life sciences have been especially large
over the past decade (table 8).
FIGURE 12. Doctorates earned by U.S. citizen and permanent resident racial/ethnic minorities, by broad field of study: 2008
Percent
See table 8.
SOURCE: NSF/NIH/USED/USDA/NEH/NASA, 2008 Survey of Earned Doctorates.
Field of study
All fields Life sciences Physical sciences Social sciences Engineering Education Humanities Other fields
0 5 10 15 20 25 30
FIGURE 13. Distribution of doctorates earned by male and female U.S. citizens and permanent residents, by race/ethnicity: 2008
Percent
See tables 49 and 50.
SOURCE: NSF/NIH/USED/USDA/NEH/NASA, 2008 Survey of Earned Doctorates.
Race/ethnicity
American Indian Asian Black Hispanic White Multi-race
0 10 20 30 40 50 60 70 80 Male Female
5 The decline in the number of doctorate recipients identifying themselves as American Indians on the SED questionnaire may be related in part to the introduction in the 2001 questionnaire of the option to select one or more racial categories. Of the 520 non-Hispanic U.S. citizen and perma-nent resident respondents indicating more than one race in 2008, 201 selected American Indian/Alaska Native as one of their races. However, there were declines in the number of American Indian doctorate recipi-ents both before (1999–2000) and after (2002–06) the introduction of the revised item; see detailed data table 48.
the doctorates awarded in life sciences and other fields (69%
and 64%, respectively) in 2008 (table 11). Temporary visa
holders earned the majority of doctorates awarded in
engi-neering (60%) and just under one-half (48%) of the doctorates
awarded in physical sciences. In absolute numbers, U.S.
citi-zens and permanent residents earned more doctorates in life
sciences than in any of the other broad fields, whereas
engi-neering was the most prevalent broad field of degree for those
in the United States on temporary visas.
The trend toward increasing female representation in the
doctoral cohorts is particularly striking for U.S. citizens and
permanent residents. In 2008, 52% of all doctorates awarded
to U.S. citizens and permanent residents went to women. This
marks the sixth consecutive year in which the majority of U.S.
citizens and permanent residents receiving research
doctor-ates were women (detailed data tables 48, 50).
In contrast, among those doctorate recipients holding
tempo-rary visas, 35% were women. That percentage is, like the
figure for U.S. women, near an all-time high (detailed data
tables 48, 50).
Women holding temporary visas were more concentrated
in S&E fields of study than were female U.S. citizens and
permanent residents. Women holding temporary visas
repre-sented 23% of all female doctorate recipients in 2008, but
they earned 28% of the doctorates granted to women in life
sciences, 41% of the doctorates earned by women in physical
sciences, and 50% of the doctorates earned by women in
engi-neering (detailed data tables 38, 39).
In 2008, 4,526 doctorate recipients were citizens of China
(including Hong Kong), representing 10% of the total number
of degrees awarded to individuals who reported citizenship
(table 12). The lists of top 15 countries in terms of the number
of doctorates awarded to non-U.S. citizens were similar in
2007 and 2008, although some rankings changed. Romania
and Iran, among the top 15 countries in 2007, were replaced
by Italy and Colombia in 2008. The leading five countries
(China, India, Korea, Taiwan, and Turkey) accounted for 21%
of all doctorates awarded by U.S. universities to individuals of
known citizenship in 2008. This list has been relatively stable
over the past 10 years, with China, India, Korea and Taiwan
making up the top four every year. However, beginning with
2007, Turkey replaced Canada as the fifth largest country, and
it maintained that position in 2008. Thirty percent of all 2008
doctorate recipients who reported citizenship were from the
40 nations listed in table 12.
The 20 institutions awarding the largest numbers of
doctor-ates to temporary visa holders in 2008 are listed in table 13.
between 2004 and 2008 and the number of doctorates
granted by each university. Over that interval, five
institu-tions—University of California-Los Angeles, University
of California-Berkeley, Stanford University, University of
Southern California, and Harvard—awarded a total of 1,860
doctorates to Asians, or 16% of all doctorates awarded by
U.S. universities to Asians. Howard University awarded, by
far, the most doctorates to blacks (334), followed by Nova
Southeastern University (170). These two institutions granted
5% of all the doctorates awarded to blacks over this period.
The leading institutions awarding doctorates to Hispanics
were the University of Puerto Rico-Rio Piedras, University
of California-Los Angeles, University of California-Berkeley,
and the University of Texas-Austin. Oklahoma State
Univer-sity awarded the largest number of doctorates to American
Indians (30) and University of California-Berkeley awarded
the most doctorates to multiracial graduates (88).
The concentration of minority doctorate recipients in certain
institutions is noticeably greater than for the doctoral
popula-tion as a whole. Over the 2004–08 period the 10 universities
granting the largest numbers of doctorates to all doctorate
recipients conferred 15% of all doctoral degrees. However,
over the same time period, the 10 universities that awarded
the most doctorates to Asians granted 25% of all Asian
doctorates; for blacks the corresponding figure was 16%; for
Hispanics it was 21%; for American Indians it was 24%; and
for multiracial doctorate recipients it was 22% (table 10).
Citizenship
Each year, the SED gathers information concerning the
U.S. citizenship status and country of citizenship of the new
doctorate recipients at the time of graduation. Of the 2008
doctorate recipients with known citizenship status (94% of
the total), 67% were U.S. citizens or permanent residents (i.e.,
“green card” holders), and 33% were non-U.S. citizen
tempo-rary visa holders (table 11).
The proportion of non-U.S. citizen temporary visa holders
earning doctorates from U.S. institutions has increased over
time. The 5-year snapshots shown in table 11 indicate that
the percentage of new doctorates awarded to individuals on
temporary visas rose from 12% of all doctorate recipients who
reported citizenship in 1978 to 33% in 2008. The growing
numbers of doctorates awarded to foreign students on
tempo-rary visas has accounted for the majority of the overall
growth in the number of doctorate recipients since 1978.
U.S. citizens and permanent residents earned more than
three-fourths of the doctorates awarded in social sciences,
educa-tion, and humanities (77%, 91%, and 84% of those reporting
citizenship status, respectively), as well as about two-thirds of
NSF 10-309
11
baccalaureate degree. Black, Hispanic, and American Indian
recipients’ parents were less likely to have gone beyond high
school and were far less likely than parents of white, Asian,
and multiracial recipients to have attained a baccalaureate or
advanced degree. Doctorate recipients who were U.S. citizens
or permanent residents were more likely than those holding
temporary visas to report that their mothers attained at least
a baccalaureate degree (52% and 41%, respectively).
Simi-larly, U.S. citizens and permanent residents were more likely
to report that their fathers attained at least a baccalaureate
degree (61%) than were non-U.S. citizens who held a
tempo-rary visa (57%).
The distributions of parental education by the broad fields
in table 14 reflect, in part, the different racial/ethnic and
citizenship compositions of the fields. Doctorate recipients
in humanities displayed the highest percentages of both
mothers (65%) and fathers (55%) with at least a baccalaureate
degree. The lowest percentages of baccalaureate or higher
degrees achieved by fathers or mothers were reported by
doctorate recipients in the broad field of education (43% for
fathers and 35% for mothers). Education also had the highest
percentage of parents whose formal education ended at high
school or before. The broad field of humanities had the lowest
percentage of parents who did not go beyond high school.
Over the past 30 years the overall trend has been toward
parents of doctorate recipients being more highly educated
(figure 14; table 15). In 1978, 42% of doctorate recipients
reported that neither of their parents had attained an educa
-tion beyond a high school diploma, and about one in five
(21%) reported that at least one parent had an advanced
degree. By 1993 the proportion of doctorate recipients
reporting an advanced degree as highest parental education
(33%) surpassed those reporting a high school diploma or
less (31%). By 2008 the proportions in the most- and
least-educated groups had almost completely reversed, with 21%
of doctorate recipients reporting highest parental education of
a high school diploma or less and 40% reporting at least one
parent with an advanced degree.
Educational History of Doctorate Recipients
The SED collects information about several aspects of
doctorate recipients’ educational history that, taken together,
provide insight into the educational pathways that students
take on the way to earning a research doctoral degree. Since
the start of the survey in 1957, the SED has collected detailed
information about master’s and baccalaureate degrees earned
by research doctorate recipients. The SED has also collected
information pertaining to additional postsecondary degrees
earned, as well as community college enrollments. The SED
The University of Illinois at Urbana-Champaign awarded the
largest number of doctorates to temporary visa holders (374).
Parental Education Background
Since 1963, the SED has asked new doctorate recipients to
report their fathers’ and mothers’ highest level of educational
attainment. As was the case in previous
Summary Reports
,
responses are grouped into four categories: high school
diploma or less, some college, baccalaureate degree, and
advanced degree, including a master’s, doctorate, or
profes-sional degree.
6Doctorate recipients’ fathers and mothers differed in
educa-tional attainment at the highest and lowest ends of the
spec-trum but were quite similar in terms of earning a bachelor’s
degree and completing some college. The 2008 data indicate
that 27% of recipients’ fathers had earned no more than a high
school diploma; the corresponding figure for their mothers was
35% (table 14). Fourteen percent of doctorate recipients had
a father who had attended college but did not attain a
bacca-laureate degree; 17% of the mothers of doctorate recipients in
2008 achieved this level of education. Over one-fourth (26%)
of doctorate recipients indicated that their fathers earned a
baccalaureate degree; the percentage whose mother earned a
baccalaureate degree was also 26%. At the upper end of the
parental-education range, over one third (34%) of doctorate
recipients’ fathers held an advanced degree, compared with the
23% whose mothers had an advanced degree.
Male and female doctorate recipients showed some
differ-ences in their parents’ educational backgrounds. Female
doctorate recipients tended to report higher educational
attainment for their mothers than did their male counterparts.
Specifically, 24% of women, compared with 22% of men,
reported that their mothers attained an advanced degree,
whereas 32% of women, compared with 37% of men, reported
that their mothers attained no more than a high school
diploma. The reported educational backgrounds of fathers
differed little between male and female doctorate recipients.
There is considerable variation in parental education attain
-ment by race/ethnicity, citizenship status, and broad field of
study. Among U.S. citizens and permanent residents, Asian,
white, and multiracial doctorate recipients were more likely
than members of other racial/ethnic groups to come from
families in which one or both parents attained at least a
6 Versions prior to the 2005 Summary Report combined the “some col-lege” and “baccalaureate degree” categories into a single category. The Summary Report2002 included a special section on first-generation college graduates earning research doctorates, which relied on the respondents’ reports of their parents’ educations.Overall, 73% of all 2008 research doctorate recipients reported
earning a master’s degree (table 16). However, there is
signifi-cant variation in reported rates of master’s attainment by broad
field of doctoral study. Research doctorate recipients in S&E
fields were less likely to earn a master’s degree than were
their counterparts in non-S&E fields. In particular, doctorate
recipients in life sciences (51%) and physical sciences (65%)
reported attaining a master’s degree at lower rates than
doctorate recipients in engineering (77%), social sciences
(82%), or any of the non-S&E fields: humanities, other fields,
and education (85%, 85%, and 89%, respectively).
Men and women attained master’s degrees at similar rates
(men 72%, women 75%). Temporary visa holders earned
master’s degrees at a slightly higher rate (80%) than their U.S.
citizen and permanent resident counterparts (75%). Among
U.S. citizens and permanent residents, master’s attainment
differed by the doctorate recipients’ race/ethnicity (figure
15; table 16). Overall, blacks (84%) and American Indians
(83%) reported earning a master’s degree at higher rates than
reported by multiracial doctorate recipients (75%), whites
(75%), and Hispanics (74%). Asians (70%) reported the lowest
rate of earning a master’s degree. Differences in the racial/
ethnic composition of doctorate fields do not appear to fully
account for this observed difference in master’s attainment.
Blacks reported attaining master’s degrees at a higher rate
than the other racial/ethnic groups in two of the four S&E
broad fields—social sciences and engineering—and attained
master’s degrees at a higher rate than all but American
questionnaire was modified in 2004 to improve the coverage
of master’s degree attainments and to ask about community
college participation, and this section draws on the data from
those enhancements.
FIGURE 15. U.S. citizen and permanent resident doctorate recipients who earned a master’s degree, by broad field of doctoral study and selected
race/ethnicity: 2008
Percent
See table 16.
SOURCE: NSF/NIH/USED/USDA/NEH/NASA, 2008 Survey of Earned Doctorates.
Field of study
All fields Life sciences Physical sciences Social sciences Engineering Education Humanities Other fields
0 20 40 60 80 100
Asian Black Hispanic White
FIGURE 14. Highest educational attainment of either parent of doctorate
recipients: 1978–2008
Percent
See table 15.
SOURCE: NSF/NIH/USED/USDA/NEH/NASA, 2008 Survey of Earned Doctorates. High school or less
Some college Earned baccalaureate Advanced degree 1978 1983 1988 1993 1998 2003 2008 0 20 40 60 80 100
NSF 10-309