VOLUNTARY SUPPLY CHAIN SECURITY
PROGRAM IMPACTS: AN EMPIRICAL
STUDY WITH BASC MEMBER COMPANIES
Ximena Gutiérrez, Juha Hintsa, Philippe Wieser and Ari-Pekka Hameri
This paper is an abridged version of presentations given previously at conferences and meetings about supply chain security.1
Abstract
Managing security in global supply chains has been gaining increasing attention in
business and governmental agendas since the terrorist attacks in the United States in
2001. Since then several new voluntary government-business partnership programs
have emerged to enhance security in end-to-end supply chains. However, a few
programs have existed for a longer time, one of them is the BASC (Business Alliance
for Secure Commerce) program, active as a business alliance in Latin America since
1996, originally
fi
ghting narcotics smuggling, and later converted into a holistic supply
chain security management program. Understanding the implications – costs,
trade-offs, bene
fi
ts, etc. – of security management programs is a complicated task, with very
limited existing literature. This paper, being the
fi
rst survey of its kind, presents the
results of the survey carried out with 102 BASC member companies, including: (1)
the most commonly implemented security measures; (2) the most (and least) ef
fi
cient
security measures; (3) the relationship between the cost and effectiveness of the
measures; and (4) the bene
fi
ts obtained while implementing these security measures.
Finally, the paper provides recommendations for governmental and company decision
makers on designing future ‘win-win’ supply chain security programs.
Introduction
The paradigm of managing and regulating security in global supply chains is changing. Before 2001, security management decisions – security measures, investments, documentation, etc. – were primarily taken at individual company level, with no or very limited interaction with other supply chain participants or governmental agencies. Since 2001 the situation has changed: governmental agencies, mainly the customs administrations, have entered the fi eld, with their vested interest to protect their respective nations against terrorism and other serious international crime. The fi rst country to move was the US (C-TPAT program since 2002), followed by Australia, New Zealand, the European Union, and a few others, later on.
One exception to the ‘pre-9/11 era’ is the BASC (Business Alliance for Secure Commerce) program, which was established in 1996 to fi ght narcotics smuggling, exploiting existing supply chains and logistics networks, from some Latin American countries, mainly to North America. The abbreviation ‘BASC’ stood originally for ‘Business Anti-smuggling Coalition’, and was later converted to ‘Business Alliance for Secure Commerce’. The mission statement of the BASC organisation is to ‘facilitate and stimulate agile international trade through the implementation and management of security standards
and procedures applied to the international supply chain’. BASC has around 1,500 member companies, located in 13 Latin American countries, which are grouped in six organisational chapters: Colombia, Ecuador, Peru, Costa Rica, Pacifi c region and Dominican Republic.
The following questions were considered in a survey of BASC member companies:
!" Which security measures are commonly implemented by the BASC member companies? !" What is the cost for companies to join the BASC program?
!" Which security measures turn out to be most appealing, that is, low cost and high effi ciency? !" Which types of benefi ts the member companies have obtained while implementing the BASC
program?
This paper provides an overview of the survey questionnaire and the survey sample. The study fi ndings follow by describing the implemented security measures, the cost of implementing the BASC program, the expected benefi ts versus obtained benefi ts related to the program, and a qualitative cost-benefi t analysis. Next, the relationship between the number of security measures and the number of obtained benefi ts is analysed, followed by the analysis of the relationship between implemented applicable security measures and obtained benefi ts. A 2x2 matrix for classifying security measures in high-low cost versus high-low effectiveness is provided. Finally, other study fi ndings are summarised, followed by conclusions.
The study was carried out by two doctoral assistants at Ecole Polytechnique Fédérale de Lausanne (EPFL) and Hautes Etudes Commerciales (HEC) University of Lausanne, supervised by two professors at those universities. The President and several Directors at the BASC organisation played a critical role in facilitating the study process between the research team and the BASC member companies.
The survey questionnaire
The study involved a fi ve-page questionnaire, addressed to 800 BASC member companies in ten different countries. The questions were created in collaboration with BASC management and fi ne-tuned in a validation exercise with fi ve BASC chapter directors from different countries. The fi nal document contained 20 questions which followed the structure presented in Figure 1 below.2
Figure 1. Summary of questionnaire structure
Sample characteristics
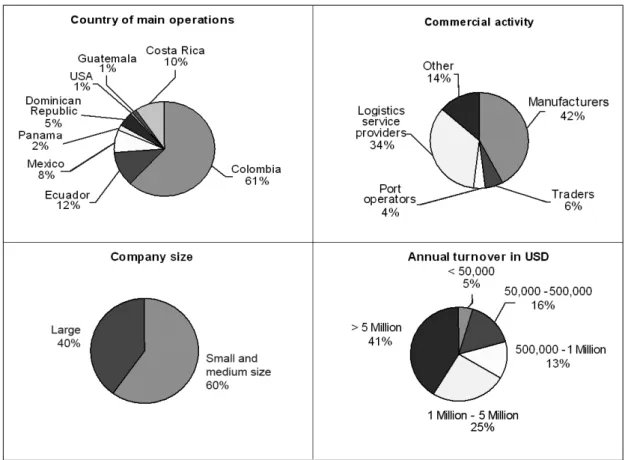
Out of 800 companies contacted, 102 completely answered surveys were received (response rate of 13% and sample error of 10%). The survey covered 78% of the member countries; represented companies involved in different international trade-related operations (that is, manufacturers, traders, port operators, logistics service providers and others providing support services such as security monitoring and rental vehicles); covered different company sizes, and annual turnovers; and included companies which were certifi ed in different years. Figure 2 presents the distribution of respondent companies in terms of four different categories: country of main operations, commercial activity, size, and annual turnover.
Figure 2. Distribution of study participants
Implementation of various security measures
Most of the existing voluntary supply chain security programs comprise general guidelines which describe the security measures that should be implemented to become a certifi ed company. However, there is much variability regarding the level of detail in which these measures are presented. For instance, BASC is a program with one of the most highly detailed security standards lists, with approximately 100 security measures. Nevertheless, the researchers believe that most of the security measures can be implemented in different ways. There is still a great degree of freedom in the implementation of security standards, depending on each company’s particular situation.3
A consolidated list of security measures which summarised the most recurring measures in nine different security initiatives worldwide was established. The resulting 25 measures were classifi ed into the following fi ve categories: Facility management, Cargo management, Human resources management, Information management, and Business network and company management systems. It should be noted that the list contains some measures that are not explicitly required in BASC security standards guidelines (the use of cargo inspection and tracking technology, the use of international standards for data management, etc.). However, they may contribute to the creation of an appropriate supply chain security management system within companies or as part of other existing or future security programs.
Respondents specifi ed which security measures from the consolidated list were implemented by their companies. For each implemented measure, they were asked to explain if it was done as a requirement for obtaining BASC certifi cation, or if it was in place prior to the certifi cation process. For each of the non-implemented measures, respondents were asked to explain if they had plans to implement them in the near future or if the measures were not applicable for their company.
Figure 3 below presents the implementation reasons and the future plans for each security measure and ranks them from the most to the least implemented by BASC companies.
Figure 3. State of implementation for set of security measures (sample size 102)
The most popular measures include employee hiring and exit processes, which cover background checks, exit interviews, etc. Defi ning organisational roles and responsibilities regarding security management; protecting the facilities with basic tools and methods; protecting the business information; and arranging security training programs belong also to the top fi ve most popular implemented security measures. At the other end of the spectrum, one has more technology orientated security measures, including access/ presence control technologies; cargo and vehicle anti-tampering and tracking technologies; international data standards; and using cargo inspection technologies. One possible reason for their unpopularity could be the higher cost than in some of the more popular measures; in addition, a large number of companies claimed that these fi ve least popular measures are not applicable at all for their companies.
BASC implementation costs
Respondents were asked to estimate the total cost incurred to implement the security measures required by the BASC certifi cation and the annual cost of maintaining these measures. These costs include expenses caused by the implementation of the security measures themselves (security training courses, investments in technology or facility reinforcement, etc.), and the administrative fees that the World BASC Organization charges their members for covering organisational running costs. These administrative fees can vary from 800 USD to 2,500 USD for the certifi cation and from 800 USD to 2,000 USD for annual maintenance. The tariff varies according to the socio-economic situation of the country and the economic sector to which the company belongs. BASC certifi cation is valid for one year and can be renewed after passing a second security audit.
Table 1 below presents the average certifi cation and annual maintenance cost for companies with different turnovers.
Table 1. Certifi cation and maintenance average cost for different turnovers (sample size 90) Average value in USD
Annual turnover Number of companies Implementation Cost Annual Maintenance cost Maintenance/ certifi cation cost Certifi cation cost/ Turnover < 50,000 4 28,625 2,888 10% ! 57% 50,000 - 500,000 13 17,176 8,539 50% 3% - 34% 500,000 - 1 Million 13 13,585 6,698 49% 1% - 3% 1 Million - 5 Million 25 61,820 15,826 26% 1% - 6% > 5 Million 35 52,742 28,484 54% "1% Total 90 34,790 12,487 38%
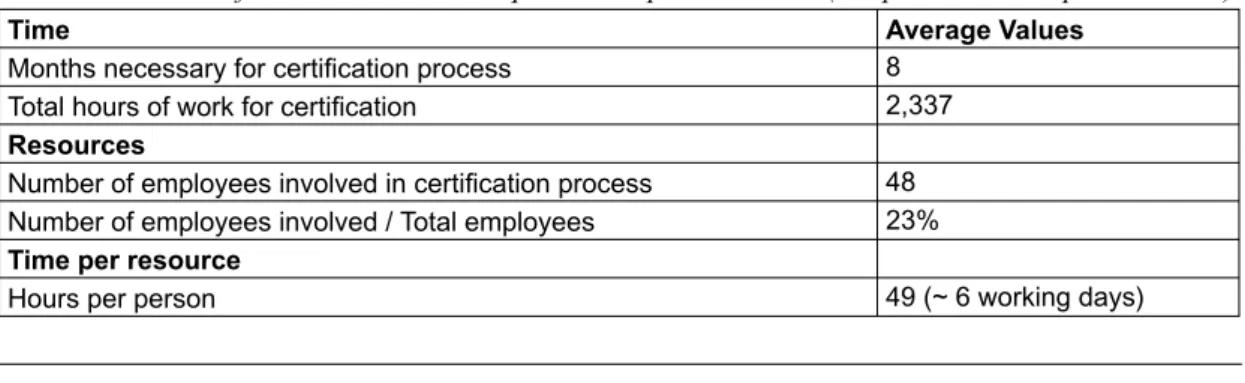
Except for companies with a turnover between 50,000 and 500,000 USD, the average cost of certifi cation appears to be positively related to turnover (increase in turnover, higher cost of certifi cation). However, the increase in the cost of certifi cation is not proportional to the increase in turnover. For instance, for companies with an annual turnover of less than 50,000 USD the certifi cation cost was on average more than 57% of their turnover, while for companies with a turnover between 50,000 and 500,000 USD this percentage decreases drastically to a range between 1% and 34%. One more relevant result is that the maintenance cost in relation to the certifi cation cost (see column: Maintenance/certifi cation cost) appears to be smaller (10%) for companies with turnovers of less than 50,000 USD per year and higher (on average 45%) for companies with higher turnovers. It could be concluded that the certifi cation cost appears to be more expensive for companies with small annual turnovers (less than 50,000 USD) while the maintenance cost is proportionately more expensive for more companies with higher turnovers. The company internal work required throughout the certifi cation process, average values for time required and human resources spent are presented in Table 2 below.
Table 2. Measures of time and resources required to implement BASC (sample size 90 complete answers)
Time Average Values
Months necessary for certifi cation process 8
Total hours of work for certifi cation 2,337
Resources
Number of employees involved in certifi cation process 48
Number of employees involved / Total employees 23%
Time per resource
Bene
fi
ts of joining the BASC program
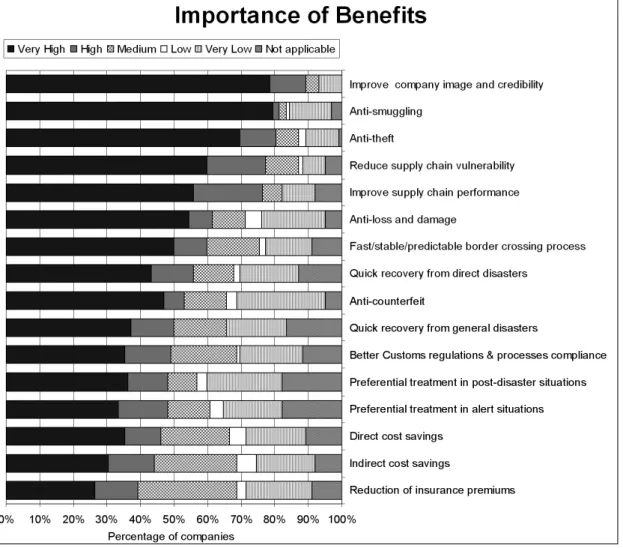
Based on an exhaustive supply chain security literature review, 16 potential benefi ts related to voluntary supply chain security programs were identifi ed and classifi ed in the following three categories: (I) Direct security benefi ts (II) Benefi ts for the company’s effi cient functioning, under normal conditions, and (III) Benefi ts for the company’s effi cient functioning, under high alert or post-disaster conditions.4 Respondents
were asked to evaluate the degree of importance of these benefi ts for their companies. Figure 4 presents the list of benefi ts ranked from the most to the least important based on the respondents’ answers. Figure 4. Potential security programs benefi ts ranked by degree of importance (sample size 102)
There was general agreement regarding the most and least important benefi ts. More than 70% of respondents considered that the top fi ve most important benefi ts belong to categories I (Direct security benefi ts) and II (Benefi ts for the company’s effi cient functioning, under normal conditions). An average of 60% of companies considered the direct, indirect cost savings and the reduction of insurance premiums benefi ts of medium or low importance.
On the other hand, there is certain disagreement concerning benefi ts such as quick recovery from general disasters and better Customs regulations and processes compliance, where 50% of respondents believed that these are highly important and the other half believed that their importance is medium, low or not applicable for their company.
Furthermore, respondents were asked to explain which benefi ts they were expecting when the company engaged in the certifi cation process versus which benefi ts they gained after the certifi cation was complete. Figure 5 presents, as percentages, the expected and obtained benefi ts.
Figure 5. BASC expected vs obtained benefi ts (sample size 102)
Figure 5 shows that attainments were higher or very close to expectations for most of the direct security benefi ts – excluding for reduction of insurance premiums; for some supply chain effi ciency related benefi ts (such as the reduction of the supply chain vulnerability and the improvement of the supply chain performance) and in particular, to improve company image and credibility, which was the most expected and the most attained (expected by 85% and obtained by 90% of the respondents).
In contrast, it seems that benefi ts related to cost savings, direct and indirect, effi ciency under high alert/ post disaster conditions and facilitation of border crossing operations (fast/stable/predictable border crossing process and better Customs regulations and processes compliance) were on average less attained than expected. These results show that although the implementation of the BASC program has been useful in increasing security and, as a consequence, in improving corporate image, it is diffi cult to translate this apparently less risky situation into cost savings.
For those benefi ts where expectations were met, the main interest is to understand which security measures contributed to achieving them; this will be discussed in the next section. For those benefi ts where the expectations were not met, three potential explanations can be considered: the benefi ts would in reality require broader security investments than the companies had made; the benefi ts would require different security investments than the companies had made; companies had not been exposed to disruptions or alert situations where they would have been able to prove the effectiveness of the security measures.
Qualitative cost-bene
fi
t analysis
There is an analogy between investing in a supply chain security management program and paying insurance fees, that is, one can choose to invest in preventing security incidents as well as in developing a fast recovery capability in case of an incident – one where the company could have had a say in, for example, theft; or one which is independent of the company’s actions, for example, port closure. With the insurance instruments, by investing in advance one can become (economically) better prepared for fast recovery after an incident happens, naturally subject to the insurance terms and conditions. However, carrying out an accurate, quantitative cost-benefi t analysis for security investments is not an easy task, due to several reasons, such as quantifying the investment returns in case ‘nothing happened anyway’ is diffi cult; and being able to show exactly which security measure contributed to which benefi t is not an exact science.
One way to categorise the types of possible benefi ts for security investments is to determine:
• cost savings from reducing the probability or avoiding the occurrence of undesirable events (that is, decrease in theft, counterfeit, loss or damage rates, reducing supply chain vulnerability, avoiding customs fees, loss of goodwill)
• secondary positive effects on existing operations (that is, improving supply chain effi ciency due to better control and traceability, indirect cost savings)
• improvements to the company’s situation in relation to external actors (that is, acquisition of new clients, preferential treatment at borders).
Benefi ts for the fi rst category result in avoiding costs; therefore, their quantifi cation requires the calculation of the potential costs that could be incurred if an undesirable event occurs. For the second and third categories, quantifi able benefi ts should be the result of more income, due to an increase in turnover or a decrease in operational costs. In both cases, the quantifi able benefi ts are not easy to estimate. In the fi rst case, the estimated benefi ts will never be exact if the undesirable event never occurs, and in the second case, the benefi ts will be the result of other interacting variables (marketing function of the company, product quality, etc.) so it will be diffi cult to identify which part of the increased income corresponds to the security investments.
BASC member companies illustrate the existing diffi culty in quantifying security investment benefi ts: while 93% of the respondents were able to estimate the total cost of implementing and maintaining BASC, only 40% were able to quantify some benefi ts and very few were able to explain where they originate.
Large variations were found when comparing the value invested in security with the value of the obtained benefi ts of the companies that quantifi ed their benefi ts. Out of this set of 34 respondents, half obtained benefi ts which were inferior or equal to their investment and the other half obtained benefi ts which vary from double to ten times the total cost of implementation and maintenance. Additionally, although several companies invested similar amounts of money in security, they obtained signifi cantly different quantifi able benefi ts. Even if some respondents were able to explain the reasons for such benefi ts, it did not suffi ciently explain why companies making apparently the same effort obtained very different results.
Despite these diffi culties, the researchers provide some explanations for the variation in the results: • There are signifi cant obstacles when quantifying benefi ts stemming from the prevention of an
undesirable event. The estimation of these benefi ts depends on the perceived degree of risk faced by the company and the program’s capacity to reduce the probability that this risk will occur. For instance, the same security measure will reduce the probability that an undesirable event will occur within companies facing high risks and others facing low risks to the same extent. However, the riskier companies will perceive higher benefi ts because the potential savings from preventing undesirable events are higher than for the low risk companies.
• There might be relevant differences in the items that were considered to calculate the cost of implementation and maintenance by each company.
• The relationship between costs and benefi ts might depend on the situation of the company. For instance, a company where several security standards were implemented prior to starting the certifi cation process will incur reduced costs in comparison to that which starts from zero level. • The size of quantifi able benefi ts can depend on many variables. For instance, on the implemented
security measures, on the maintenance activities or on the execution of any additional efforts. Better understanding of the connections between such variables could provide important insights to analyse the relationship between costs and benefi ts for security investments.
Relationship between number of security measures and obtained
bene
fi
ts
As discussed in the previous section, there are multiple barriers to quantifying and explaining the potential benefi ts derived from the investments in security programs. Not being able to quantify the benefi ts creates obstacles to justify the investments. Not understanding the connections between cost, security measures and benefi ts makes it diffi cult to create cost-effective security programs. In this section, this problem is assessed by exploring whether any relationship exists between the number, type and cost of the implemented security measures and the number and type of obtained benefi ts.
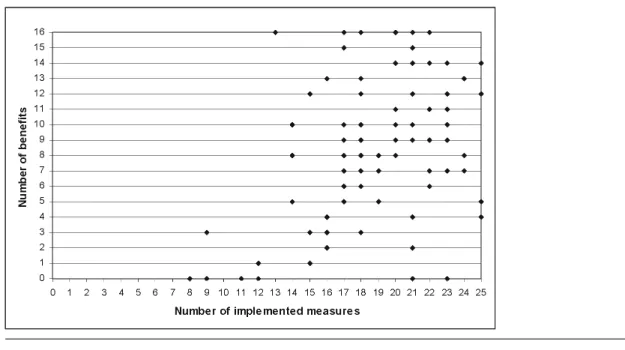
In simple terms a security program consists of a list of security measures. Given that, in principle, each security measure reduces the probability of occurrence of a certain identifi ed risk, it could be argued that the more security measures are implemented, the more benefi ts will be obtained. Results presented in previous sections indicate that BASC member companies have followed this same logic while trying to implement as many measures as possible.
To test this hypothesis, the number of implemented measures was graphed (Figure 6) against the number of obtained benefi ts for each company. However, the graph shows that it is not possible to establish any signifi cant positive or negative association between these two variables. For instance, there are several companies which implemented the same number of measures and while one obtained the maximum number of benefi ts (16), the other obtained zero benefi ts.
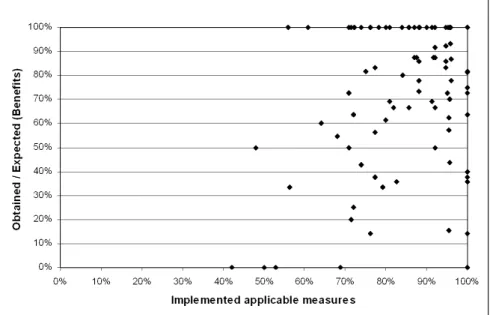
In order to avoid the potential bias given by the fact that not all benefi ts and not all measures are applicable for all companies, the following two percentages were graphed one against the other: the number of implemented measures out of the total applicable for each company, and the number of obtained benefi ts out of those that were expected by each company. Figure 7 shows that, in this case, neither is it possible to say that there is a positive relationship between the number of security measures and the number of obtained benefi ts.
Figure 7. Relationship between implemented applicable security measures and obtained benefi ts
The same graphic was done adding several control variables such as company’s main activity (Logistic service provider or manufacturer), size (large or SME), main reason to implement the program (security or image), commercial relationships with US and/or EU, and number of measures implemented from each category (facility, cargo, human resources, information and business partners management). Once again, it was not possible to establish any pattern or signifi cant association for any of the analysed groups of companies. Given that it was not possible to establish any robust connection between the global efforts made in security (represented as number of implemented measures) and the global effectiveness of these efforts (represented as the number of obtained benefi ts), the next step was to analyse independently the potential connection between effort (represented as cost of implementation) and effectiveness for each security measure.
Classi
fi
cation of measures in terms of cost and effectiveness
Respondents were asked to qualify each measure in terms of their implementation cost and effi ciency in improving security. Two fi ve-point Likert scales were used by respondents to qualify each security measure in terms of these two properties. Table 3 presents the different values and the corresponding meaning. Table 3. Qualitative scales to qualify security measures in terms of cost and effectiveness
Implementation cost Effectiveness to improve security
1 = 0 – 2,000 USD 1 = Very low effectiveness
2 = 2,001 – 10,000 USD 2 = Low effectiveness
3 = 10,001 USD – 50,000 USD 3 = Medium effectiveness
4 = 50,001 USD – 100,000 USD 4 = High effectiveness
Once each measure was evaluated separately in terms of cost and effectiveness, analyses were carried out to establish which type of relationship exists between the cost of implementation and the effectiveness of security measures. Providing answers to this question could provide essential insights to designing cost effective security programs. For instance, if effectiveness is positively related to the cost of the measure, companies with higher investments in security will be more likely to achieve higher security enhancements. On the other hand, should such relationships not exist, the creation of a cost effective supply chain security program would only require implementing low cost and effective security measures.
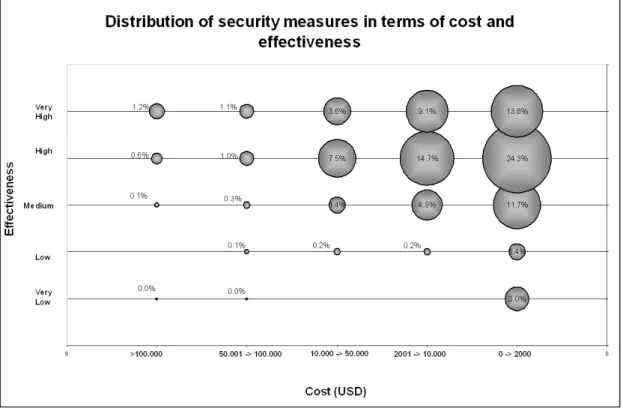
Most of the answers indicated that all the 25 measures are low cost and high effective. Figure 8 shows the percentage of answers for each possible combination between cost and effectiveness for all the 25 measures. It can be observed that 61.7% (= 9.1% + 13.6% + 14.7% + 24.3%) of the answers point out that all the measures cost between 0 and 10,000 USD and are highly or very highly effective.
Figure 8. Number of answers per possible combinations of cost and effectiveness
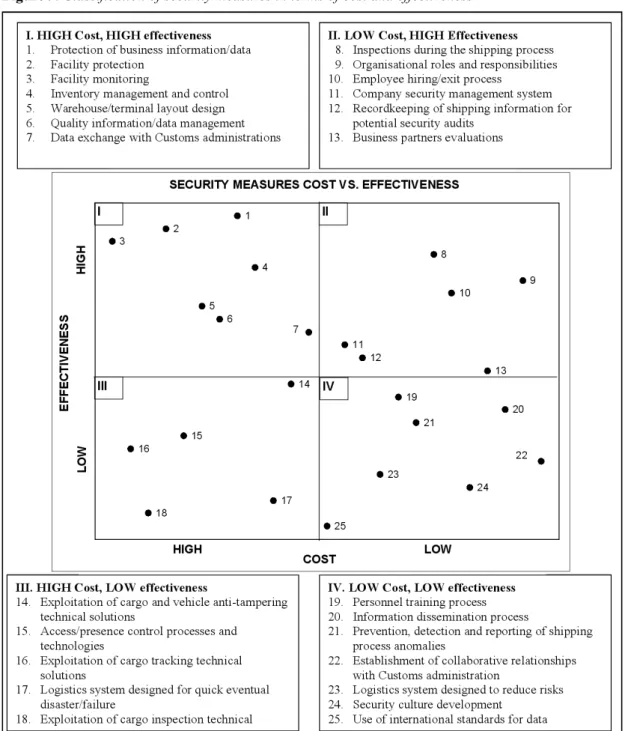
The analysis of joint cost and effectiveness answers doesn’t provide much information about the differences in cost and effectiveness for the 25 security measures. However, by studying the cost and the effectiveness separately, it was possible to establish how cost-effective each security measure is in relation to the others. In order to do this, each security measure was ranked in terms of cost (from the one which was considered more expensive to the one which was considered cheaper by the higher percentage of companies) and effectiveness (following the same logic as for cost). Then these two ranks were combined in Figure 9, where the measures are classifi ed into two levels of cost (low and high) and two levels of effectiveness (low and high).
Figure 9. Classifi cation of security measures in terms of cost and effectiveness
No linear positive relationship between cost and effectiveness was found. On the other hand, four main groups of security measures which account for inverse and identical combinations of cost and effectiveness levels were identifi ed. For instance, there are six of the 25 security measures which present a LOW implementation cost and HIGH effectiveness in relation to the others (for details, see measures in group II). In contrast to this group, fi ve of the 25 measures present the opposite combination: HIGH implementation cost and LOW effectiveness (for details, see measures in group III).
Types of measures comprising each cost-effectiveness group
A closer analysis of the type of measures that comprise each of the identifi ed cost-effectiveness groups shows that there are certain types of measures which dominate for some groups or are completely absent. For instance, the HIGH cost and HIGH effectiveness group is comprised only of facility management and information management measures. The LOW cost and HIGH effectiveness, as well as the LOW cost and LOW effectiveness group are comprised of measures from all categories, except from facility management. Finally, the HIGH cost and LOW effectiveness group is comprised mainly of measures related with cargo management, and some related with business networks and management systems and facility management. Figure 10 presents the percentage of different types of measures that comprise each cost-effectiveness group.
Figure 10. Types of measures comprising each cost-effectiveness group
It is interesting to see that those groups where the cost is high have higher concentrations of measures from the same type, contrary to the low cost, which tend to have measures from almost all the categories. These results suggest that measures related to facility management are more likely to be costly to implement and less effective than the others.
In addition, understanding why certain measures are less effective or more expensive than others, and understanding if it is possible to transform them into better performing security measures, could provide important insights for the design of future cost effective supply chain security programs. Figure 11 illustrates the potential strategies to enhance a set of measures which comprise a security program.
Figure 11. Identifi cation of low cost effective security measures
Up to this point, some insights have been presented regarding the relationship between the effort (cost) and effectiveness of the investments in security. However, the successful implementation of a supply chain security program should not only aim to identify the lowest cost and most effective security measures, it should also give priority to those measures that can contribute to creating the benefi ts that are of highest importance for the company. In order to achieve this goal, it would be desirable to identify any existing strong connections, that is, statistically signifi cant associations, between certain benefi ts and security measures.
Sample connections between security measures and bene
fi
ts
It should be noted that the necessary statistical analysis used in this study is not included in this paper. However, Table 4 presents some potential connections that were reported by respondents when asked about the most important benefi ts obtained by their companies and the corresponding measures that were implemented to achieve them.
Table 4. Samples of connections between benefi ts and measures identifi ed by some respondents Measures implemented Obtained benefi ts Type of benefi t
Logistics process control, information management on-time and collaboration with authorities
Anti-smuggling and anti-theft
Direct security Supply chain traceability, identifi cation and control
of process responsibilities (knowing who does what, at what moment)
Anti-loss and damage
Document revision and training employees to detect and report anomalies
Decrease containers theft
Document protection and process supervision
Better process control, processes bottlenecks and mistakes reduction
Supply chain effi ciency Use of security seals, supervision of deviations in
vehicles travel times, access control with bar code system
More control over operations, personnel, documents and cargo
Access control (working with closed doors), registration of visitors, adequate information management, monitoring of vehicles 24 hours, use of security seals
Improve internal organisation, decrease in disruptions and hence, insurance premiums Creation of strategic alliances, risk evaluation of
clients and suppliers, adequate employee selection process, establishment of security best practices agreements with clients
Increase of 24% of the business, increasing the turnover by around 2 million US dollars
Company image Inspection of containers and vehicles while in
storage (this company has used this extra security activity to sell their clients a corporate image which promotes very high security standards)
Client recognition of improved security level; differentiation from competitors
These results suggest that supply chain effi ciency related benefi ts are the result of certain security measures which contribute to security and at the same time, create operationally desirable conditions that are essential for improving effi ciency. For instance, some respondents explained that certain security measures reduced the time and variability of certain logistics operations and improved cargo visibility and control, which together contributed to the reduction of the vulnerability of the supply chain. Others reported an improvement in logistics processes and level of service, which contributed to the improvement of supply chain performance. In spite of these examples, which connect certain measures and benefi ts, there were several respondents who argued that the obtained benefi ts were the result of all the implemented measures and they were not able to establish any relevant connections between single measures and single benefi ts.
Conclusions
This paper presents the fi rst broad survey study carried out within a voluntary supply chain security management program. The BASC program appears to be a successful sample of a business alliance, which was initiated with a specifi c security goal of reducing narcotics smuggling from a high risk geographic area to the rest of the world, and later expanded to become a general supply chain security management program. The paper shows empirical data about the costs, efforts required and effectiveness of this sample security management program.
The study concluded that benefi ts of such a program are not likely to depend on the number of security measures, and that security effectiveness is not linearly nor positively related to the cost of security measures. However, it was possible to identify security measures which appear to be highly effective and low cost in comparison with the other measures, and vice versa. Estimating the quantifi ed cost of implementing the BASC program was done to some degree, but quantifying the benefi ts turned out to be a more diffi cult task, clearly subject to future studies.
The documented experience of BASC member companies provides an important reference document for the future development of supply chain security standards for global, end-to-end supply chains. The lessons learned with the BASC program should be carefully analysed by the ongoing regional and global standardisation initiatives, including the European Union’s Authorised Economic Operator (EU AEO), the World Customs Organization’s Framework of Standards to Secure and Facilitate Global Trade (the SAFE Framework of Standards), and the International Standards Organization’s Supply chain security management system (ISO28000).
In order to have successful future supply chain security management standards, it must be ensured that the participating companies get tangible benefi ts for their efforts, with one of the main benefi ts being preferential treatment at border crossing points, both in normal conditions and in high alert and post-disaster situations. How to do this remains a key topic for future supply chain security research as well as governmental policy development work.
Acknowledgements
FNS (Fond National Suisse de la Recherche) as the main sponsor of this study.
BASC: Ms Mayra Hernández de Cavelier, President, World BASC Organization. Mr Diego Castillo, BASC Chapter Pichincha, Mr Stephen R Tiernay, BASC Dominican Republic, Jose Luis Hernández Valentino, BASC Chapter Carabobo, and John Reinberg, BASC Chapter Ecuador; and all BASC member respondents to the study.
EPFL: Professor Michel Bierlaire.
HEC University of Lausanne: Professor Erkko Autio.
HEC University of Lausanne – IUMI: Professor Jean-Claude Usunier, Mr Vincent Vandersluis. HEC University of Lausanne and CBRA: Mr Vladlen Tsikolenko.
References
Bodner, Nathan 2003, ‘The weakest supply chain link (fi ve categories of food manufacturing supply chain risks)’, Food Logistics, no. 42.
Christopher, Martin & Towill, Denis 2001, ‘An integrated model for the design of agile supply chains’,
Gutiérrez, X & Hintsa, J 2006, ‘Voluntary supply chain security programs: a systematic comparison’, ILS 2006, The International Conference on Information Systems, Logistics and Supply Chain, Lyon, France, 15-17 May.
Gutiérrez, X, Wieser, P & Hintsa, J 2006, ‘Voluntary supply chain security program impacts: an empirical study with BASC member companies’, International Workshop on Risk Management in Port Operations, Logistics and Supply Chain Security, Imperial College London, UK, 29 September.
Hintsa, J, Gutiérrez, X, Wieser, P & Hameri, A 2006, ‘Supply chain security management: a general overview’, ILS 2006, The International Conference on Information Systems, Logistics and Supply Chain, Lyon, France, 15-17 May.
Schneier, Bruce 2003, Beyond fear: thinking sensibly about security in an uncertain world, Copernicus Books, New York, NY. (ISBN 0-387-02620-7)
Of
fi
cial program documents
European Commission 2005, The Authorized Economic Operator, TAXUD/A4/SA D, March.
ISO TC 8/SC 11(ISO/WD 0, ISO TC 8/SC 11/WG 1) 2005, Custody best practices to enhance supply chain security, 2 May.
New Zealand Customs Service 2003, Secure exports partnership: important information for applicants,
December.
Partners in Protection (PIP) Importer security recommendations, available at: http://www.cbsa-asfc. gc.ca/general/enforcement/partners/imp_recommend-e.html.
StairSec® White Paper on Accreditation of Operators and the Supply Chain Security. A way forward – Proposal to connect national customs accreditation systems and create an authorised supply chain security (pilot).
TAPA 2000-2005, Freight suppliers’ minimum requirements, January.
US Customs and Border Protection 2003, C-TPAT validation process guidelines, January. World BASC Organization 2002, BASC standards.
World Customs Organization 2005, Framework of Standards to secure and facilitate global trade (SAFE Framework), June.
Endnotes
1 Gutiérrez, X, Wieser, P & Hintsa, J 2006, ‘Voluntary supply chain security program impacts: an empirical study with BASC member companies’, International Workshop on Risk Management in Port Operations, Logistics and Supply Chain Security, Imperial College, London, UK, 29 September 2006.
The study preparation and results were presented on slides at :
BASC 2005 and 2006, (Business Alliance for Secure Commerce, formerly Business Anti-smuggling Coalition), Gutiérrez introduced the new study to BASC Management and members: ‘Voluntary supply chain security program – Case: BASC in Latin America, Panama City, Panama, May 2005, and Cartagena, Colombia, March 2006, www.wbasco.org.
The study results were presented on slides at PICARD 2007, 2nd Conference on WCO Research Network, Hintsa presented study results, Brussels, Belgium, March 2007.
For a copy of the full version of this study, please contact either the Editor-in-Chief at [email protected], or [email protected].
2 See Gutiérrez, Wieser & Hintsa 2006 for the detailed questions. 3 See Gutiérrez, Wieser & Hintsa 2006 for more details. 4 See Gutiérrez, Wieser & Hintsa 2006 for more details.
Ximena Gutiérrez
Ms Gutiérrez has a Master of Science in Industrial Engineering from Universidad de Los Andes, Colombia (2000). After working for a few years in the Logistics Service Providers industry, she moved to Switzerland to obtain an Executive Masters in Management of Logistical Systems from Ecole Polytechnique Fédérale de Lausanne (EPFL) (2003). In 2004, Ms Gutiérrez joined the College of Management of Technology at EPFL as a Research Assistant, where she is conducting studies in the fi elds of Logistics, Supply Chain Security and Cross-border Operations Management, mainly in studies coordinated and led by the Cross-border Research Association.
Juha Hintsa
Juha Hintsa is a Senior Researcher in global supply chain security management, with an MSc (Eng.) in Industrial Management and Artifi cial Intelligence. He is one of the founding partners of the Global Customs Research Network, and the founder of the Cross-border Research Association (CBRA) in Lausanne, where he undertakes research into various aspects of supply chain security management in close collaboration with several multinational corporations.
Philippe Wieser
Dr Philippe Wieser obtained his Diploma of Engineering in Mechanics at EPFL in 1977 and his PhD in 1981. After a few years working in an engineering consulting company, he joined EPFL as a Lecturer. His fi elds of research and teaching deal with logistics and information systems, and integrated logistics. Since May 2000, Dr Wieser has been the Executive Director of IML: International Institute for the Management of Logistics (EPFL-Lausanne and ENPC-Paris). Dr Wieser teaches in EPFL-Lausanne (Master and Executive Master MSL) and ENPC-Paris (Executive Master). He is author and co-author of more than sixty publications.
Ari-Pekka Hameri
Dr Ari-Pekka Hameri is Professor of Operations Management at University of Lausanne, Switzerland. He has been involved with numerous EC-funded and other international research projects dealing with lead time reduction and supply chain management. He has published over fi fty articles about industrial IT, and production, project and supply chain management in international management and science journals.