Leveraging
the
Labor
Force
for
Economic
Growth
Assessing the Nashville Economic Market Area’s
Readiness for Work after the Recession
August
2010
Prepared
by:
Contents
Executive Summary ... i
Workforce Supply ... i
Workforce Demand ... iv
Targeted Industry Clusters ... v
Introduction ... 1
About the Data ... 2
Workforce Supply ... 4
The Region’s People ... 4
Population ... 4
Migration Patterns ... 6
Age Structure ... 8
Diversity/Ethnicity ... 9
The Region’s Workforce ... 10
Labor Force ... 10
Labor Force Participation ... 11
Employment and Unemployment ... 11
Commuting ... 13 Workforce Quality ... 14 Income ... 14 Entrepreneurship ... 15 Educational Attainment ... 16 Workforce Demand ... 18 Economic Structure ... 19
Detailed Industry Employment Trends and Projections ... 21
Occupation Employment Trends and Projections ... 23
Educational Requirements and Occupational Demand ... 27
Synopsis of Occupational Trends by Employment Band ... 30
Evaluating Supply and Demand ... 33
Key Industry Clusters ... 34
Information Technology and Management ... 39
Headquarters Operations ... 42
Finance and Shared Services ... 45
Creative Industries ... 49
Advanced Manufacturing ... 53
Distribution and Logistics ... 57
Hospitality ... 61
Construction ... 65
Industry Cluster Workforce Gap Analysis ... 69
Conclusions ... 70
Appendices ... 74
Executive
Summary
This report provides a follow‐up to a 2008 study of the supply and demand for workers in the 10‐county
Nashville Economic Market Area. This 1.74 million‐person region is Tennessee’s primary economic
engine. It has not, however, been immune from the effects of the worst recession since the Great
Depression. The region’s unemployment rate has more than doubled since 2004, leaving the region with
approximately 80,000 unemployed residents. Finding work—for the currently unemployed and people
just entering the workforce—will be a challenge as many of the region’s traditional sources of
employment, such as the manufacturing sector, no longer produce significant numbers of net new jobs.
Securing employment in this challenging economic environment is difficult for everyone, but particularly
so for those workers that lack any significant education, training or skills. Given this changing reality,
workers must better prepare themselves for the jobs of tomorrow, employers must learn how to do
more with less, and education and training providers must learn how to make their offerings more
relevant. In order to successfully make these adjustments, employers, workers, educators and
policymakers must have solid information on which to base their decisions. This report is intended to
provide just this kind of information.
This study explores many of the same questions covered in the 2008 report, but given the current
economic environment, these questions merit reconsideration. This analysis examines the region’s
current workforce, and identifies some potential areas where future worker demand is likely to emerge.
It also considers the capacity of regional educational institutions to help meet the region’s future
demand for skilled and educated workers. Particular attention is given to several of the region’s key
industry clusters, which offer strong potential for creating workforce opportunities. The report draws
upon not only a great number of secondary data sources, but it also reflects the results of analyzing
qualitative data gathered from more than 250 companies participating in a survey and focus‐group
interviews. As a result, this research not only identifies the key trends facing the region’s workforce,
but also offers insights about the factors driving these changes and how they are expected to influence
the region’s workforce.
Workforce
Supply
Determining the supply of workers requires examining the region’s people, the labor force, and the
labor force’s relative quality. The region’s population provides the pool of workers, and factors such as
the number of children, students, retirees or discouraged workers influence the extent to which people
participate in the labor force. While many of the factors listed above indicate how many workers are
available, few indicators measure their general quality and capacity. This report draws upon three main
indicators—average earnings, self‐employment and educational attainment. The Region’s People
The region has added about 150,000 people since 2004. This represents an annual growth rate of 2.4
percent—a rate that exceeds both the state and nation’s growth rate. During this period, all of the 10
counties in the region experienced an annual growth rate that was faster than the national rate of 0.9
ii
central hub of the region, but its overall share continues to decline as growth in the surrounding
counties, especially Williamson and Rutherford, exceeded Davidson’s growth.
Migration is a critical workforce issue for most metropolitan areas striving to meet workforce demand.
Data from the U.S. Internal Revenue Service reveal that, as in previous years, the Nashville region
remains a net gainer of in‐migrants. Between 2007 and 2008, the region gained a net 12,505 migrants
from 6,723 new households. Davidson, Rutherford, Montgomery and Williamson counties were the
most popular destinations for in‐migrants. Davidson attracted 34,099 people, compared to 17,716 in
Rutherford County, 16,044 in Montgomery County, and 13,248 in Williamson County. Nevertheless,
Davidson County was a net loser of in‐migrants, as many Davidson residents tended to move to
neighboring suburban counties. A slight majority of the movers to the Nashville area came from out of
state—58,000, compared to 55,000 who moved from within the state. Some of the leading origins from
which new arrivals came to Nashville were the Atlanta, Knoxville, Los Angeles and Detroit metro areas.
The age of the region’s population will also affect its future workforce potential. If more people of
working age are leaving the workforce than entering, then the region will become more reliant on
migration to close this gap. At present, 63 percent of the Nashville area’s current population is of
working age (20‐64), and this figure is projected to decline to 59 percent by 2019 due to the anticipated
retirement of the Baby Boomers. Moreover, the percentage of people aged 65 and older is projected to
increase from 10 percent to 13 percent during the same time.
The region’s ethnic composition is slightly more diverse than in the state as a whole. The region’s white
and African‐American populations are growing, but not as quickly as its Hispanic and Asian populations.
From 2004‐2009, the Hispanic population grew 8.5 percent annually. This annual rate was somewhat
faster than the state rate (8 percent annually), and much faster than the national rate (3.3 percent). The Region’s Workforce
The size of the region’s labor force provides an indication of economic strength. In 2009, the Nashville
area’s labor force was 860,639. This represents an annual increase of 1.6 percent since 2004. This
annual growth rate was double the growth rate for the state of Tennessee during the same period (0.8
percent annually) and nearly double the U.S. rate over the same period (0.9 percent annually). Not
surprisingly, Davidson County had the region’s largest labor force, at 320,647, in 2009. Rutherford and
Williamson counties have the Nashville area’s fastest‐growing labor forces. Davidson, Williamson and
Rutherford counties comprise the area’s largest employment centers, with a combined 73.7 percent of
total employment in 2009. Almost 39 percent of the net new employment growth between 2004 and
2009 occurred in Williamson County. It should also be noted that the region has a relatively strong labor
force participation rate of 68.3 percent. This is a slight decline from previous years, and this may be due
to the aging population and a growing number of discouraged workers who have given up looking for
work. This decline, however, may be offset by many workers staying in the labor force longer than
expected due to the diminished size of their retirement accounts after substantial stock market price
The recession has also reduced the number of employment opportunities available. The diminished
number of employment opportunities is made plainly evident by the region’s unemployment rate, which
more than doubled from 4.5 percent in 2004 to 9.3 percent in 2009. This increased the number of
unemployed workers from 35,783 in 2004 to 80,231 in 2009, for an additional 44,358 unemployed
persons. The regional unemployment rate was on par with the U.S. rate in 2009, though still below the
Tennessee rate. The rates were highest in Maury County (13.8 percent), Dickson (11 percent) and
Robertson (10.3 percent) counties. Because of this job shortage, workers appear to be willing to travel
farther to find work than in previous years. The region’s commuting patterns show that there is more
intra‐county commuting than in years past, particularly between Nashville’s suburban counties. Workforce Quality
Average income provides a rough measure for the value businesses place on workers, as it assumes that
businesses will pay higher wages for relatively higher‐skilled workers. According to the U.S. Bureau of
Economic Analysis, average wage and salary income in the Nashville area was $43,258 in 2008, higher
than the state average but lower than the U.S. average. That said, growth in the region’s average
earnings continued to lag the nation between 1998 and 2008. The Nashville average wage was 95
percent of the U.S. average in 1998 and 2008. Davidson and Williamson counties were exceptions, but
when adjusted for inflation, Maury County actually saw its average income decline between 1998 and
2008.
Self‐employment is another particularly important aspect of the region’s workforce. The region has
234,000 non‐farm sole proprietors, representing a sizable proportion of the region’s total job count. In
fact, the proportion of the workforce that is self‐employed has increased from 18.3 percent in 1998 to
22.7 percent in 2008. The proportion is now only slightly lower than the state’s, but higher than the
nation’s. The largest numbers of sole proprietors are located in Davidson County, while Cheatham and
Dickson counties have the largest proportion of all jobs held by sole proprietors. Most promising for the
region, though, is that average proprietor incomes in the region are much higher and are growing much
faster than either in the state or in the nation. This indicates that many of these proprietorships provide
more than just supplementary income. As a result, these proprietors contribute significantly to the
region’s entrepreneurial strength, and many may become the region’s expanding new companies.
Educational attainment is another commonly used measure of worker quality and can affect the region’s
capacity to take on more value‐added activities. The Nashville area has a generally more educated
population (age 25+) relative to the U.S. and Tennessee. Nearly 28 percent of adults have at least a
bachelor’s degree or higher, compared to 26.7 percent in the U.S. and 21.6 percent in Tennessee.
Within the Nashville area, educational attainment varies widely, from a high of 48.1 percent of adults
with a four‐year degree in Williamson County to a low of 12.5 percent in Dickson County. The region also
has relatively fewer adults with just a high school diploma or less than either the state or the nation.
Educational attainment is an important consideration because it provides a clear indication of one’s
earning potential. Within the Nashville region, a person with a four‐year degree will make, on average,
almost $1 million more than someone who has not completed high school over a 40‐year career. High
iv
degree holders earn $660,000 more than those working in occupations that typically require only a high
school diploma.
Workforce
Demand
In spite of the current recession, many businesses throughout the Nashville region have continued to
hire workers. An employer workforce survey administered by the Nashville Area Chamber of Commerce
early in 2010 found that 85 percent of businesses surveyed hired at least some workers in 2009; 28
percent hired more than 25 workers last year. Additionally, 57 percent of respondents had a current
opening that they were looking to fill, with 23 percent having more than five openings to fill. As the
region’s economy recovers, more jobs will become available, which presumably will include more lasting
and high‐skilled jobs. However, understanding the kinds of jobs that will be created requires analyzing
not only the region’s economic structure, but also how the regional economy has changed and will likely
change in the future.
At the broadest level, the largest workforce segments in the Nashville area are in trade, transportation
and utilities and professional and business services. The employment projections show that services, in
particular, will be important to the region’s future employment growth. Service sectors such as
professional and business services, education and health services and financial activities will be among
the region’s fastest‐growing sectors between 2009 and 2019. The analysis of more detailed industries
reflects many of these broad trends. Growth is projected in health‐care‐related industries such as
specialty hospitals and doctor’s offices, and business and financial services such as accounting and
bookkeeping, management of companies and enterprises, management consulting services, and
computer systems design and related services. Several of these latter industries are directly involved in
the region’s thriving health care administration activities. Industries projected to decline are most
greatly affected by long‐term systemic changes. For example, several manufacturing industries are
projected to continue losing net employment, as are other declining and restructuring industries such as
newspaper publishers, wired telecommunications carriers, and some agricultural activities. These
employment declines typically result from increased productivity and occupational obsolescence due to
the deployment of automation and technology or from outsourcing of key elements of the production
process resulting from increased globalization.
Many of these industry trends are reflected in occupational trends and projections. Industries related to
office administration, business, finance, and health care are expected to offer the most future
employment opportunities. As a result, more people will be required to fill jobs in occupations such as
registered and licensed practical nurses, managers and management analysts, accountants, and office
supervisors. However, it is also important to note that jobs that pay above‐average wages often require
workers who have obtained postsecondary education or participated in longer‐term job‐related training
as well as gained meaningful experience in a specialized career.
While these occupations are growing, many occupations—often associated with declining industries— are declining. For instance, as in many places, the region’s manufacturing sector has experienced
years are production‐related jobs. This is mostly the outcome of either global firms outsourcing lower
value‐added jobs or technology making the production process less labor‐intensive.
One of the common themes emerging from the data presented above is that workers in jobs requiring
relatively lower levels of education and training, particularly those in declining industries, are at the
greatest risk of being dislocated. Conversely, those occupations that pay the best wages are those that
require some kind of postsecondary degree or long‐term on‐the‐job training (OJT). Roughly half of all
jobs in the Nashville region and the U.S. require only short‐ or moderate‐term OJT. At the other end of
the education spectrum, more than 20 percent of current jobs require a four‐year degree or a graduate
degree as a minimum educational requirement. Occupational projections show that an increasing share
of work will require postsecondary education as new jobs demand greater skills.
Targeted
Industry
Clusters
This report identifies several industry clusters that are likely to serve as the basis for future regional
growth and workforce opportunities. Those clusters include health care services and administration,
information technology and management, headquarters operations, finance and shared services,
advanced manufacturing, distribution and logistics, hospitality, and construction. These clusters present
a variety of workforce challenges. For instance, the competitiveness of Nashville‐area headquarters
operations, IT and financial services companies will depend on their ability to find and develop a
continuous stream of highly educated workers. Other clusters, such as hospitality, rely more heavily on
relatively lower‐skilled workers. Those companies must find workers with a strong set of basic work and
life skills who can help deliver high‐quality services while minimizing worker turnover. The health‐care
cluster faces issues in recruiting and retaining highly skilled and lower‐skilled talent, as this sector needs
workers from every part of the skill continuum.
Data on green jobs are not yet available; however, it is clear from focus groups in this study that many of
the jobs that will dominate this emerging economic activity are already in the labor market, but those
jobs are likely to change – sometimes dramatically. For instance, area contractors seeking to compete
for new opportunities will increasingly need to adapt to install solar energy systems in addition to
traditional heating and cooling systems. Other area contractors competing for retrofitting and new
construction projects will need to be up‐to‐date in their knowledge and skills related to purchasing and
installing energy‐efficient building products. Team assemblers in many more advanced manufacturing
facilities will need to understand basic electronics to produce batteries or photovoltaic cells. Many
more equipment sales professionals will need to learn more about energy usage and storage concepts
as they develop technical knowledge about some of their green products. Architects and engineers
seeking to compete will need to understand and be capable of implementing key energy‐efficiency and
conservation principles. Many workers engaged in these related occupations will need to adjust or
upgrade their skills in response to key opportunities – and science, technology, engineering and math
skills will be critical foundations.
Another theme emerging from the analysis of the targeted industry clusters is that many jobs are quickly
changing. For example, even though the manufacturing sector is declining overall, there are still many
vi
traditional manufacturing jobs of yesterday, which frequently required only limited education and
simple OJT. Given greater use of technology and automation, many production‐related jobs now require
higher levels of technical skill and computer literacy. Within the health‐care cluster, several employers
indicated that since many nurses are now being asked to work more independently, they need
additional skills related to management, problem‐solving and IT competency. Within the construction
industry, several of the employers that were interviewed noted that the industry could be in the early
stages of a transformation. The implementation of lean construction techniques – including the
introduction of tools like Building Information Modeling – could greatly reduce waiting time and
increase efficiency in an industry that still constructs buildings in the same way it has for decades. As
these industries transform, the workers will see their jobs change dramatically.
These examples all speak to the constantly changing nature of work, and it will be important for the
education and training system to keep pace. There is a continuous need for people with technical
certificates and two‐ and four‐year degrees across industries. Almost all workers must engage in some
form of lifelong learning in order to continuously renew and refresh their skills. This will not only come
through on‐the‐job experiences and degree programs, but also through shorter, more targeted, and
customized education and training programs. Increasingly, the quality of these educational experiences
and the skills available are documented in the form of industry‐recognized national certifications that
are more closely aligned with formal education and training programs.
Ensuring that the region has a constantly evolving and deepening pool of talent requires input and effort
from a wide variety of stakeholders. In order to successfully adapt, employers, workers, educators and
policymakers must collaborate to build consensus on the resources required to ensure that this talent is
Introduction
At the start of a new decade, the Nashville Economic Market Area1 faces many new challenges in light of
the worst recession since the Great Depression. As a result, the region must adjust to an environment in
which many people are searching for jobs that currently may be difficult to find. Given this changing
reality, workers must prepare themselves for the jobs that will likely become available as the economy
recovers. Often, these jobs will not be the same as those that existed before the recession. Instead,
employers are maximizing the productivity of their existing workforce and relying on fewer but more
highly skilled employees. Likewise, the region’s education and training providers must learn to adapt by
ensuring that their offerings are more directly relevant to employers seeking adaptable, flexible
workers. This report is intended to provide the information that can serve as the foundation for just this
collaboration.
This report provides a follow‐up to a 2008 study (Labor Market Opportunities in the Nashville Economic
Market Area). The earlier report provided a detailed assessment of the region’s current workforce and
where future worker demand was likely to emerge. It also considered the capacity of regional
educational institutions to help meet the region’s future demand for skilled and educated workers. The
report found that, overall, the Nashville Economic Market Area had a relatively strong and diverse
economy. The region also possessed several unique strengths in areas such as music and
entertainment, auto manufacturing, health‐care administration, distribution and postsecondary
education. While the region possessed the institutional infrastructure to meet the needs of these
industries, its leaders also needed to ensure that the education and training programs offered closely
aligned with industry needs. In addition, the 2008 report concluded that regional leaders must also help
students and jobseekers become more aware of available opportunities in these industries.
Since 2007, the dramatically changed economic environment and local conditions merit revisiting those
findings. This report explores many similar questions in light of significant economic shifts. It draws
upon not only a large number of secondary data sources, but it also reflects the results of analyzing
qualitative data gathered from more than 250 companies participating in a survey and focus‐group
interviews. As a result, this research not only identifies the key trends facing the region’s workforce,
but also offers insights about the factors driving these changes and how they are expected to influence
the region’s workforce.
The report begins by examining the region’s population and its available workforce. It also characterizes
the quality of the region’s workforce in terms of its productivity, entrepreneurial capacity and
educational attainment. It next seeks to identify the sources of current and future worker demand. In
order to do this, the report considers the region’s broad economic structure and identifies specific
industries and occupations that have and are projected to either significantly grow or decline.
While these sections provide insight into many of the broad trends affecting the region, the subsequent
section delves more deeply into the supply and demand for workers in several of targeted industry
1
The region is comprised of the 10 counties that comprise the Nashville Area Chamber of Commerce economic development service area. These counties include Cheatham, Davidson, Dickson, Maury, Montgomery, Robertson, Rutherford, Sumner, Williamson and Wilson.
2
clusters that provide significant workforce opportunities. These targeted clusters include: health care
services and administration, information technology and management, headquarters operations,
financial and shared services, creative industries, advanced manufacturing, distribution and logistics,
hospitality, and construction. For each cluster, the report describes trends and projections within the
key industries and occupations. Results from a survey and focus‐group interviews inform these findings,
adding important context. Moreover, for each target cluster, the report examines which postsecondary
institutions are graduating students from relevant degree and certificate programs. Policy leaders can
use this data to gauge the region’s ability to produce an adequate supply of workers to meet industry
demand. In some cases, it is clear that area institutions are not producing a sufficient number of new
degree or certificate holders to meet local demand. Furthermore, this information will help regional
leaders better understand Nashville’s future workforce, the demand for workers, and the gaps and
opportunities that require a policy response.
About
the
Data
Before beginning the analysis, the data that inform this report merit some explanation. The report uses
a wide variety of data sources to assess the region’s supply and demand for workers. It should be noted
that no one data source, nor one type of data, can tell the whole story of the region’s labor market.
Fortunately, multiple data sources are available to help paint a complete picture of the complex
workforce issues facing the Nashville region. Analyzing the region’s labor market supply involved pulling
data that address the region’s economic and demographic characteristics. In order to do this, this report
uses data drawn from public data sources such as the U.S. Census Bureau, U.S. Internal Revenue Service,
U.S. Bureau of Economic Analysis, the Tennessee Department of Labor and Workforce Development,
and U.S. Bureau of Labor Statistics (BLS). Within this section, population forecasts and some
demographics data were drawn from proprietary data estimates, including those generated by
Economic Modeling Specialists, Inc. (EMSI), an Idaho‐based firm that taps Census and BLS data to
produce national population and employment estimates and projections.
The labor demand analysis includes a quantitative assessment of recent employment growth or decline
as well as projections of future demand. These data are primarily drawn from EMSI, which provides past
industry and occupational employment. It should be noted that the employment data provided here
represent “complete” employment. Consequently, it includes not only workers covered by the
unemployment insurance program (or “covered” employment, as reported by the Tennessee
Department of Labor and Workforce Development and the BLS), but it also includes sole
proprietorships2, farmers and government workers. These groups of workers are not always included in
the state’s unemployment insurance program.3 2 Most proprietors have no employees, but they are not precluded from having employees. However, by remaining a proprietor and not incorporating, the individual who owns the company is personally liable for all debts, may pay higher income taxes, and cannot currently deduct either health or life insurance from their personal income taxes. 3 Unless otherwise described, employment estimates and projections were developed using an econometric model developed by EMSI. The model was developed to address the needs of community colleges, workforce development boards and economic development groups, using local economic data as a basis for more regionalized economic input‐output analysis. The EMSI model has the flexibility to produce estimates and projections based on “covered employment and wages” (the BLS Quarterly Census of Employment & Wages definition for employment that relies on workers covered under the state unemployment insurance program) as well as “complete employment” (the BEA definition).
EMSI also provides projected employment trends. These projections of future employment are “best‐
guess” estimates based on both national and regional trends. Consequently, they present a likely
scenario of what will happen if no major event significantly alters the region’s future. One of the ways to
evaluate the region’s capacity to meet future needs is to examine the output of the region’s
postsecondary educational institutions. These data are developed from the National Center for
Employment Statistics’ Integrated Postsecondary Educational Data System, as aggregated by EMSI.
The secondary data that inform the analysis of the targeted workforce clusters are supplemented by
two other important sources of information—an employer workforce survey and a series of focus‐group
interviews completed in spring 2010. The Nashville Area Chamber of Commerce, along with the region’s
three Workforce Investment Boards, conducted the employer workforce survey as a way to solicit more
input about the region’s workforce needs and opportunities. Businesses throughout the 10‐county
region were surveyed. The survey addressed topics such as hiring trends, pending retirements, difficult‐
to‐fill positions, reasons for difficulty hiring and retaining workers, and training needs of businesses.
Overall, 233 businesses responded to the survey. These businesses ranged from those employing under
10 workers to those employing more than 1,000 workers. Business across many industries were
surveyed, including finance and shared services firms (44 respondents), manufacturing companies, (39
respondents), and health‐care businesses (28 respondents). The survey insights were important
complements to the trends shown in the industry cluster data.
The project team also conducted a series of focus‐group interviews with representatives from the
targeted workforce clusters. In total, more than 30 company representatives were interviewed.
Combined, the interview and survey data serve two very important purposes for this project. First, they
help to validate the quantitative research findings. Second, they offer important context in analyzing the
quantitative analysis. As a result, these qualitative data elements allow the project team to better
4
Workforce
Supply
This section examines the region’s people, the labor force, and the labor force’s relative quality. The
region’s population provides an available pool of workers, and the changing demographics of this pool
over time can affect the quantity and quality of workers available to area companies. Certainly, a larger
population alone can increase local consumer demand and more employment opportunities in some
sectors. While population size influences the size of the labor force, it is not the only determining factor.
Many other factors—such as the number of children, students, retirees or discouraged workers—can
also influence labor force participation rates. The volume of unemployed workers itself remains very
important as a core measure of the total number of persons available to work.
While many of the factors listed above indicate how many workers are available, few indicators measure
their general quality and capacity. As a result, finding appropriate measures can prove challenging. For
this analysis, we have selected three main indicators—average earnings, self‐employment, and
educational attainment. The selection of average earnings is based on the assumption that businesses
will pay higher wages for relatively higher‐skilled workers. Given the relatively high levels of
entrepreneurship in the Nashville area and the emerging skills that are valuable in the workplace, we
have also included the proportion of the population that is self‐employed. Educational attainment is
another commonly used measure of worker quality and can affect the region’s capacity to take on more
value‐added activities.
The
Region’s
People
Population
The Nashville Economic Market Area’s estimated 2009 population was 1.74 million, as shown in Figure
1. Davidson County accounts for the majority of the 10‐county region’s population, with approximately
636,000 people. However, Davidson County’s relative share of the region’s population has diminished
over time as several
surrounding counties— notably Rutherford and
Williamson counties—have
emerged as significant
drivers of regional growth.
By way of illustration,
Davidson County
represented almost half of
the region’s population in
1990, but by 2004, the
county represented only 39
percent of the region’s total.
Today, the county is now 37
percent of the region’s total
population. By contrast,
Figure 1: Population by county
596,961 635,710 664,753 676,610 210,774 257,048 286,034 296,005 146,014 176,838 195,635 202,139 141,464 160,978 170,639 175,236 140,853 158,759 169,272 173,301 97,013 112,377 121,013 124,297 74,235 84,302 89,854 92,130 58,871 66,581 70,967 72,734 45,211 48,230 50,320 51,140 37,580 39,876 41,454 42,072 0 500,000 1,000,000 1,500,000 2,000,000 2,500,000 2004 2009 2014* 2019* P o p u la ti o n
Cheatham Dickson Robertson Maury Wilson Sumner Montgomery Williamson Rutherford Davidson
1,548,976
1,859,941 1,740,699
Source: US Census Bureau Population Estimates; *Projections from EMSI
1,905,665
Rutherford and Williamson counties grew from 23 percent of the region’s population in 2004 to 25
percent in 2009.
Looking forward, the Nashville
Economic Market Area is
projected to add approximately
165,000 new people between
2009 and 2019. This represents
an annual growth rate of 0.9
percent. This growth would bring
the 10‐county region’s
population to approximately
1.91 million people within the
next decade. Growth is projected
to occur throughout the region
and between 2009 and 2014,
every county is not only
projected to grow, but they are
also expected to equal or exceed the projected Tennessee annual growth rate of 0.8 percent. Between
2009 and 2019, Rutherford and Williamson counties are projected to grow the fastest at 1.4 percent and
1.3 percent annually, followed by Montgomery County at 0.9 percent annual growth. Although Davidson
County is projected to add the most net new people (40,900) between 2009 and 2019, relative to most
other counties in the region it will grow at a slower rate of 0.6 percent annually – a rate that is still
greater than the statewide average.
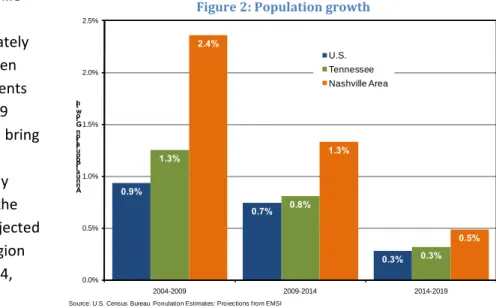
Since 2004, the Nashville area
has added more than 191,000
people for an increase of 12
percent or an annual 2.4
percent growth rate, as Figure 2
shows. Again, the area’s
population growth rates
exceeded those for both the
U.S. and Tennessee over this
period.
As noted above, Rutherford and
Williamson counties are among
the region’s fastest‐growing
counties. Figure 3 shows that
between 2004 and 2009 they
had the region’s fastest annual
growth rates, at approximately Figure 2: Population growth
0.9% 0.7% 0.3% 1.3% 0.8% 0.3% 2.4% 1.3% 0.5% 0.0% 0.5% 1.0% 1.5% 2.0% 2.5% 2004-2009 2009-2014 2014-2019 A n n u al P o p u la ti o n G ro w th U.S. Tennessee Nashville Area
Source: U.S. Census Bureau Population Estimates; Projections f rom EMSI
Figure 3: Annual population growth by
county
Source: US Census Bureau Population Estimates 3.0% 2.6% 2.5% 2.4% 1.3% 1.2% 1.3% 2.6% 3.9% 4.0% Annual Population Growth (2004-2009) 2.4% to 3.4% More than 3.4% Less than 2.4% *United States: 0.9% **Tennessee: 1.3% ***Nashville Area: 2.4% 0 20 Miles
Annual Population Growth in the Greater Nashville Area
6
four percent. Combined, Rutherford, Davidson and Williamson counties added over 115,000 people
between 2004 and 2009, and this represents 61 percent of the region’s net new population.
It should also be noted that all 10 counties in the region grew faster than the national growth rate
between 2004 and 2009. During the same period, every county, with the exception of Cheatham, also
grew faster than the state. In contrast to findings in the 2008 report, the population growth rates in
most of the western counties in the region no longer lag that of other suburban counties.
Migration Patterns
Migration is a critical workforce issue for most metropolitan areas striving to meet workforce demand.
Data from the U.S. Internal Revenue Service reveal that, as in previous years, the Nashville region
remains a net gainer of in‐migrants. Between 2007 and 2008, the region gained a net 12,505 migrants
from 6,723 new households, including 115,440 in‐migrants and 103,935 out‐migrants. In‐migrants to the
Nashville region tended to earn more (average annual income of $45,222) than those leaving the region
(average annual income of $43,160). New residents in Williamson County had the highest income per
filer at $83,000 while the lowest average income was in Montgomery County at $34,000. As the
region’s largest county, it is not surprising that Davidson County had the largest volume of movement,
accounting for approximately
one‐third of total moves to and
from the area, followed by
Rutherford and Montgomery
counties. Davidson,
Rutherford, Montgomery, and
Williamson counties were the
most popular destinations.
Davidson attracted 34,099
people, compared to 17,716 in
Rutherford County, 16,044 in
Montgomery County, and
13,248 in Williamson County.
However, Davidson (‐2,452) and
Montgomery (‐1,652) counties
actually lost more people than they attracted due to migration between 2007 and 2008. In many cases,
residents in Davidson tended to move to neighboring suburban counties. For instance, twice as many
people moved from Davidson County to Rutherford County as did the reverse, and a net 1,330 Davidson
residents moved to Rutherford County from 2007 to 2008. Other surrounding counties that benefited
from a significant number of Davidson County out‐migrants include Williamson (968 net), Wilson (867
net) and Sumner (574 net) counties. It is worth pointing out that Davidson County had a net gain in total
filers (1,071) but a net loss in total exemptions (dependents) (‐2,452), which suggests that families were
leaving Davidson County, but the county was gaining single adults. Given that professionals—and
especially young professionals—are often more mobile than other kinds of workers, it can be inferred Figure 4: Migrants to and from the Nashville area
115,440 55,391 58,179 102,935 54,877 46,809 0 20,000 40,000 60,000 80,000 100,000 120,000 140,000
Total In-State Out of State
M ig ra n ts (2 0 0 7 -2 0 08 ) In-migrants Out-migrants
Average Annual Income In-migrants: $45,222 Out-migrants: $43,160
that Davidson County
represents a significant magnet
for attracting young
professionals to the Nashville
region. Nashville’s ability to
attract these workers,
therefore, represents an
important regional strength.
While Montgomery County
experienced some intra‐
regional migration, its overall
migration patterns represent a
different phenomenon. It is
largely influenced by military
service members and their families moving in and out of the region. As a result, its largest source of net
inflows are from foreign APO/FPO zip codes (184 net), or places such as Fort Bragg, North Carolina (110
net), and Fort Leavenworth, Kansas (100 net). Meanwhile, it lost net migrants to places such as Fort
Lewis, Washington. In all counties except Davidson and Montgomery, the income of households moving
to the area was greater than those leaving the area. Those two counties lost $79 million in earnings
from net migration (a net loss in income of $34 million for Davidson County and $45 million for
Montgomery County).
A slight majority of the movers to the Nashville area came from out of state—58,000 compared to
55,000 who moved from within the state. However, more movers from Nashville moved within
Tennessee than moved to other states (Figure 4). Some of the leading locations from which new arrivals
came to Nashville were Atlanta, Knoxville, Los Angeles and Detroit. Nashville gained more than 1,000
new people from each of these locations. The connection to these cities makes sense, given the nature
of the major economic drivers in the Nashville region. For instance, Los Angeles is not only the former
North American corporate home of Nissan, but Nashville and Los Angeles are also linked by the music
and entertainment industry. One might also surmise that the automotive industry partially explains the
connection between Nashville and Detroit, but the relative lack of employment opportunities in Detroit
compared to Nashville is another factor. The connection to Knoxville is most likely influenced by
University of Tennessee graduates seeking work in Middle Tennessee. Memphis is also an important
source of households moving to the Nashville area.
Some of the leading destinations for people leaving Nashville were Atlanta, Knoxville, Chicago and
Memphis. In 2007‐2008, Nashville had a net loss of migrants to Houston and New Orleans. The
migration flows to and from New Orleans are greatly diminished over previous years, as many people
who arrived in Middle Tennessee in the immediate aftermath of Hurricane Katrina have subsequently
returned. In most cases, movers to Nashville brought more income than people moving from the area Figure 5: Migrants to and from the Nashville area by select MSA
0 200 400 600 800 1,000 1,200 1,400 N u m b e r o f M ig ra n ts ( 2 0 0 7-0 8 )
Total Arriving to Nashville Total Leaving Nashville
8
for this set of cities. For example, people moving from Los Angeles, Detroit and Chicago brought more
income than the people moving to those cities from Nashville took away.
Age Structure
The age of the region’s population affects the size and structure of its current and future workforce.
The most critical challenge facing the region is that impending retirements among workers in the Baby
Boom generation are expected to represent a very large number of workers in the coming decade, as
illustrated in Figure 6. During
the past decade, nearly 40,000
workers moved into retirement
age, and more than 67,500 will
reach retirement age in the next
decade. Only about 24,400 new
workers will move into their
early working years to replace
the retiring population. That
leaves a decline in the working‐
age population of more than
43,000 by 2019.
About 13.4 percent of the
current workforce is under age
25 ( Figure 7). That represents a
substantial drop since 2006,
when the share was nearly 16
percent. At the same time, the
proportion of the workforce aged
55 and higher rose from 15
percent in 2006 to 17.5 percent in
2009, a substantial increase in
pre‐retirees as a proportion of the
workforce. A recent analysis
completed by the BLS suggests
that labor force participation
among young adults has declined
from more than half of those
individuals in the labor force in
1998 to just 40 percent by 2008.4
4
U.S. Bureau of Labor Statistics, "Labor Force Projections to 2018," Table 3.3 Civilian labor force participation rates by age, sex,
race, and ethnicity, 1988, 1998, 2008, and projected 2018, Monthly Labor Review, November 2009.
Figure 6: Change in Population by Age Cohort, 2000
2009 46,772 24,357 126,494 67,582 39,917 0 20,000 40,000 60,000 80,000 100,000 120,000 140,000
Pre & Young Schoolers (0‐9) Next Gen Talent (10‐19) Prime Working Age (20‐54) Pre‐Retirees (55‐64) Retirees (65 and over)
P o p u la ti o n C h an ge , 2 0 0 0 ‐ 2 0 0 9
Source U SCensus Bureau Population Estimates
Figure 7: Age Structure of the Existing
Nashville Economic Market Area Workforce, 2009
13.4% 22.9% 23.0% 23.2% 13.9% 3.6% 0.0% 5.0% 10.0% 15.0% 20.0% 25.0% Under 25 25‐34 35‐44 45‐54 55‐64 65‐99 Age Cohort P e rc e n t o f W o rk fo rc e
Source: Local Employment Dynamics, Census Bureau
That trend is expected to continue declining as young adults stay in school longer; increasingly, workers
will join the workforce at a later age. Part of the reason for the growth in the labor force among older
workers is that participation rates have been climbing among that group. For instance, labor force
participation rates for adults aged 60 to 64 are expected to climb from about 54 percent in 2008 to 60
percent by 2018, while rates among workers aged 64 to 69 are expected to rise from 31 percent in 2008
to 37 percent by 2018.
Diversity/Ethnicity
As the region’s ethnic composition changes, so too will the region’s workforce. About 74 percent of the
region’s population was white in 2009, a somewhat lower percentage than in Tennessee (76.7 percent).
This figure was nevertheless high relative to the U.S. as a whole (65.1 percent). Nashville also has a
higher percentage of blacks/African Americans than the U.S. (16 percent versus 12.2 percent), but a
slightly lower rate than in the state. Additionally, the Nashville region (5.9 percent) and Tennessee (3.9
percent) have low percentages of Hispanic population compared to the U.S. (15.6 percent). The region’s
Asian population accounts for 2.1 percent of the total.
The Hispanic and Asian populations have shown the fastest growth over the past five years. From 2004
to 2009, the Hispanic population grew 8.5 percent annually. This rate was somewhat faster than the
state rate (8 percent annually), and much faster than the national rate (3.3 percent). The Asian
population also experienced rapid growth and grew 4.9 percent annually between 2004 and 2009, but
this growth occurred among a relatively smaller population. In that five‐year period, the region’s Asian
population grew by roughly 7,600. By comparison, the white and black/African American populations
expanded more slowly, at annual
rates of 1.8 percent and 2.3 percent
respectively (Figure 8).
These growth rates are projected to
slow during 2009‐2019, but the
Hispanic and Asian populations are
expected to continue growing faster
than the white and black/African
American populations. The Hispanic
population is forecasted to grow 2
percent annually between 2009 and
2019. As a consequence, the region
would have about 23,000 more
Hispanics to add to its current base.
The Asian population is forecasted to grow 1.6 percent annually, while the white population is expected
to grow 0.6 percent annually and the black/African American population will expand 0.9 percent during
the same period.
Figure 8: Population growth by ethnicity: 2004
2009 0.2% 1.0% 3.3% 2.7% 0.9% 1.3% 8.0% 4.0% 1.8% 2.3% 8.5% 4.9% 0% 1% 2% 3% 4% 5% 6% 7% 8% 9%
White alone Black or African American Hispanic or Latino (of any race) Asian % C h an g e in P o p u la ti o n ( 20 04 -2 00 9) Ethnicity U.S. Tennessee Greater Nashville Area
10
It is important to note that these growth rates mask the impact of the changes on the total population.
For instance, while the Hispanic population grew rapidly from 2004 to 2009, it did so from a small base.
For instance, the growth in the region’s Hispanic population led to 34,620 more Hispanics in 2009 than
in 2004. As a result, the Hispanic population accounted for 18 percent of the region’s total population
growth – very similar to the African American proportion of 16 percent. Meanwhile, the white
population still accounted for 58 percent of the region’s total population growth. The forecast for 2009‐
2014 is similar. These figures are very different from the U.S., where the Hispanic population accounted
for 51 percent of total population growth from 2004‐2009.
The
Region’s
Workforce
Labor Force
The size of the region’s labor force provides an indication of economic strength. A growing labor force
shows that there is a deepening pool of workers available to meet industry demand. In 2009, the
Nashville area’s labor force was 860,639, and this represents an annual increase of 1.6 percent since
2004. These recent trends show that the region’s annual growth rate was double the growth rate for
the state of Tennessee during the same period (0.8 percent annually) and nearly double the U.S. rate
over the same period (0.9 percent annually, Figure 9).
Not surprisingly, Davidson County had the region’s largest labor force, at 320,647 in 2009. This was
more than double the county with the next largest labor force—Rutherford County—which had a labor
force of 132,910 workers. Rutherford and Williamson counties were the Nashville area’s fastest‐growing
labor forces. Rutherford County’s labor force grew by 3.1 percent and Williamson County’s grew 2.4
percent annually between 2004 and 2009. By contrast, three counties—Maury, Dickson and Cheatham
counties—experienced labor force growth rates over this period that were below the U.S., state, and
regional averages. The recent
recession has somewhat blunted
the relatively strong growth that
occurred in the region during the
previous half‐decade. Given the
more limited number of
employment opportunities, many
discouraged workers have quit
looking for work and have left the
labor force altogether. This can be
quantified by comparing current
labor force participation rates to
other benchmarks such as the
region’s historic average or current
state or national averages.
Figure 9: Percent change in labor force, 20042009
0.9% 0.8% 0.2% 1.2% 0.8% 0.5% 1.1% 1.4% 3.1% 1.4% 2.4% 1.7% 1.6% 0.0% 0.5% 1.0% 1.5% 2.0% 2.5% 3.0% 3.5% US Tennessee Cheatham Davidson Dickson Maury Montgomery Robertson Rutherford Sumner Williamson Wilson Nashville Area
Percent Change in Labor Force (2004-2009)
Labor Force Participation
Labor force participation is the
proportion of people age 16 and
older who are either working or
seeking work. Students,
homemakers, retired individuals
and others not looking for work
do not count as participating in
the labor force. Many factors
affect the labor force
participation rate. Labor force
participation tends to be lower
in weaker economies because
some jobseekers give up looking
for work.
Rates also vary by age. Given that many teenagers either do not work or are too young to work, their
participation rate frequently is less than 50 percent. By contrast, more than 80 percent of adults
between the ages of 25 and 54 are in the labor force. Labor force participation begins to decline at age
55 as workers begin to retire. The Nashville area’s labor force participation rate was 68.3 percent in
2009, a drop from 69.1 percent in 2000 (Figure 10). The decline may be a result of the current state of
the economy, but the forecasted rate for 2014 is 68 percent, which reflects the changing age structure
of the workforce, especially the early effects of the retiring baby‐boom generation.5 The region’s labor
force participation nevertheless remains higher than the nation and the state, as the national labor force
participation was approximately 65 percent while the state labor force participation rate was 63.3
percent.
Employment and Unemployment
The Nashville area’s job total was 1,064,321 in 2009, including both wage and salary workers as well as
proprietors and non‐payroll workers. Davidson, Williamson and Rutherford counties are the area’s
employment centers, with a combined 73.7 percent of total jobs in 2009. Figure 11 illustrates that these
three counties also contributed 71.9 percent of the region’s net new jobs between 2004 and 2009. Over
the past half decade, Williamson and Rutherford counties have become significant destinations for
workers. By way of illustration, Williamson County comprises 11 percent of total jobs, but between 2004
and 2009, accounted for 38.9 percent of the region’s net new job growth. Similarly, Rutherford County,
which has 12.2 percent of the region’s jobs, generated 20.2 percent of net new employment. Davidson
County grew from 530,372 jobs in 2004 to 537,716 jobs in 2009. Davidson County, therefore, remains
the region’s employment center of the region, with 50.5 percent of total jobs, but only accounted for
12.7 percent of the region’s net new jobs between 2004 and 2009.
5
These data were provided by Demographics Now, which is a proprietary data vendor. Through Demographics Now, these data are only available for the years presented in Figure 10.
Figure 10: Labor force participation
rates 69.1% 68.3% 68.0% 63.5% 63.9% 63.3% 64.8% 63.3% 64.9% 0% 10% 20% 30% 40% 50% 60% 70% 80% 90% 100% 2000 2009 2014 Nashville Tennessee US
12
Looking at the details, job totals
increased an average of 1.1 percent
per year in the Nashville area
between 2004 and 2009, above the
state (0.5 percent) and U.S. (0.9
percent) growth rates. Figure 12
shows that by adding 21,899 jobs
between 2004 and 2009, job totals
changed the most in Williamson
County, increasing an average of
4.2 percent per year. The next
highest growth rates were found in
Wilson (2.1 percent) and Cheatham
(2.0 percent) counties. Given its
small relative size, the additional
1,565 jobs created in Cheatham
County contributed significantly to
its relatively rapid growth. Rutherford County grew at an average annual rate of 1.9 percent and added
11,381 more jobs.
The labor pool not only consists of people who are currently working, but also those who are looking for
work. Given the current recession, it is not surprising that the region’s unemployment rate has risen
dramatically since 2007. Shown in Figure 13, unemployment in the Nashville area increased from 4.5
percent in 2004 to 9.3 percent in 2009. This increase more than doubled the number of unemployed
workers, from 35,783 in 2004 to 80,231 in 2009, for an increase of 44,358 more people currently seeking
work than in 2004. The regional unemployment rate was below both the U.S. and Tennessee rates in
2004, but was on par with the U.S. rate in 2009, though still below the Tennessee rate. In 2009, Maury
County had the region’s highest
unemployment rate at 13.8
percent, up from 5.5 percent in
2004. This is due in no small part to
the recent closure of the former
GM Spring Hill plant. Dickson and
Robertson counties’ 2009
unemployment rates were also
above 10 percent, at 11.0 percent
and 10.3 percent, respectively.
Williamson County had the region’s
lowest unemployment rate in 2009
at 7.6 percent, which is up from
only 3.7 percent in 2004. Figure 12: Employment by county
16,876 23,050 28,069 42,745 51,443 54,774 63,186 116,941 129,721 537,516 15,311 22,949 26,704 42,788 46,428 51,557 58,601 95,042 118,340 530,372 0 100,000 200,000 300,000 400,000 500,000 600,000 Cheatham Dickson Robertson Maury Wilson Sumner Montgomery Williamson Rutherford Davidson Employment 2004 Jobs 2009 Jobs Source: EMSI
Figure 11: Net job change in the Nashville
area
0 20
Miles
Net Job Change in the Nashville Area
(2004 to 2009) (1,565) Cheatham (4,585) Montgomery (1,365) Robertson (3,217) Sumner (101) Dickson (7,144) Davidson (5,015)Wilson (11,381) Rutherford (21,899) Williamson (-43) Maury
Commuting
The distance that people are
willing to travel in order to find
work also influences the pool of
available workers. Data
compiled by the U.S. Census
Bureau6 show that in 2008, 47
percent of workers in the
Nashville area work in the
counties where they live.
Montgomery County has the
highest percentage of workers
who live and work in the same
county, at 66.8 percent. This is
most likely due to the presence
of Fort Campbell, and its relative distance from Davidson County, which is the region’s main job center.
Williamson County has the lowest percentage of workers who live and work in the same county, as only
29.8 percent of its workers live in the county. In Davidson County, 45.8 percent of workers work and
live in the county. The remaining 53 percent commute to other counties from locations within and
outside the region.
For the rest of the region,
Davidson County remains, by
far, the major employment hub
for Nashville area commuters,
with over 236,000 workers (56
percent of all commuters)
traveling to the county for work.
Williamson County is a distant
second by this measure, with
57,000 people (14 percent of all
commuters) traveling there for
work. Commuters from outside
the 10‐county region account for
a relatively fast‐growing 22
percent share of workers in the
Nashville area. Figure 14
6 Commuting pattern data come from the U.S. Census Bureau’s Local Employment Dynamics. These data are compiled from unemployment insurance records that are submitted by private businesses. It is important to note that these data do not yet include the self‐employed or government employees. This may not fully account for many government workers known to commute to Davidson County (e.g., state employees) or Montgomery County (e.g., military and federal civilian employees). There commuting data are generated from a different, more current source than the 2007 Nashville Labor Market Report, which used the 2000 Census.
Figure 14: Commuting patterns,
2008
Source:US Census Bureau Local Employment Dynamics (2008)
5,000 to 9,999 2,500 to 4,999 1,000 to 2,499 10,000 to 19,999 20,000+ Commuters 0 25 Miles
Nashville Region Commuting Patterns
Figure 13: Unemployment rate 5.5% 9.3% 5.4% 10.5% 4.5% 9.3% 0% 2% 4% 6% 8% 10% 12% 2004 2009 U n e m p lo y m e n t R a te US Tennessee Nashville Area