A
PPENDIX
Biomass Supply and Cost
Profi le: Five North
Florida Counties
E
I
NTRODUCTIONThe Wood to Energy Project at the University of Florida School of Forest Resources and Conservation assessed the economic availability of biomass resources in twenty-eight communities a cross thirteen southeast U.S. states (Monroe et al., 2007). As an example, the following describes the methodology used for these communities, and results from fi ve communities in North Florida. These results can be compared with those from the other twenty-three communities evaluated by the Wood to En-ergy project, which used the same methodology. The methodology used here is one approach that can be used in evaluating the availability of biomass resources, and can be compared to methodologies developed for the two other supply/cost profi les included in this desktop guide.
B
ACKGROUNDFlorida is the fourth most populated state in the nation, yet it boasts an abundance of natural beauty. About half of Florida, or 16.2 million acres, is covered by forests that contain diverse plant and wildlife species. Florida’s forests provide many benefi ts and opportunities to residents and tourists alike. Approximately 49 percent of Florida’s forests are owned by private family landowners, and another 32 percent are owned by private forest industries and investment companies. Near urban areas, these pri-vately owned lands are susceptible to development pressures. The northern half of Florida contains expanding communities, farmland, and 82 percent of the state’s timberland, which supports a thriving forest products industry. About 19 percent of the state’s land area is publicly owned and maintained by state parks, state forests, water management districts, national forests, and national parks (Florida Division of Forestry, 2005). These public conservation lands contain natural habitats such as pine fl atwoods, hardwood hammocks, cypress swamps, as well as rivers, lakes, and springs. In addition, many Florida communities enjoy healthy and extensive urban forests that provide benefi ts to both residents and natural resources.
Nassau, Clay, Alachua, Leon, and Santa Rosa counties are located in north Florida (Figure 1), and each has a wealth of natural resources that contribute to the residen-tial quality of life. Both Nassau and Clay counties are near the Jacksonville metro-politan area, and while they contain some bedroom communities for the city, these counties remain largely rural. Nassau County lies on the Atlantic Ocean coastline, which provides recreation and tourism opportunities, and the beautiful St. John’s River fl ows along Clay County’s eastern border. Tucked between Georgia and the Gulf Coast, Leon County’s largest urban area, Tallahassee, is the state capital. It has two major universities—Florida State University and Florida Agricultural and Mechani-cal University (FAMU)—both of which provide economic benefi ts and employment for the region. Similarly, the commercial hub of Alachua County is Gainesville, the
home of the University of Florida and about half of the county’s residents. Santa Rosa County, located in the western panhandle on the Gulf of Mexico, attracts tour-ists to its beautiful beaches while hosting successful agricultural and manufacturing industries. Many of the largest cities within these fi ve counties, such as Tallahassee, Gulf Breeze, Green Cove Springs, Orange Park, and Gainesville, are nationally recog-nized as Tree City USA communities. These counties are fortunate to contain areas with large amounts of forested lands and prominent natural features, as well as com-munities with the small-town atmosphere that many people enjoy.
According to the U.S. Census Bureau, each of these counties is experiencing mod-erate to heavy population growth (Table 1). With this growth comes the need for additional energy. Cognizant of environmental and sustainability issues, some com-munities are considering renewable fuel sources and efforts to promote energy con-servation. For example, in Alachua County, public opposition to a proposal to build another large coal-fi red power plant has led city-owned Gainesville Regional Utilities to accept a proposal for a 100 MW bioenergy facility. In Leon County, the city of Tal-lahassee agreed to buy up to 35 megawatts (MW) of biomass energy from Biomass Gas and Electric Company in 2006. As of 2005, Jacksonville’s public utility, Jackson-ville Electric Authority, plans to purchase up to 70 MW of energy from a biomass power plant proposed by Biomass Industries, Inc. This biomass facility plans to use non-woody biomass, although wood from neighboring Clay and Nassau counties could potentially be used as a supplemental fuel source. Additionally, just east of Leon County in Jackson County, a wood pellet plant has been constructed that pro-cesses wood pellets for export to Europe for energy use. Similar wood pellet plants could supply wood domestically if there is a demand. Increases in population; energy demand projections; and the presence of local, sustainable wood resources create an opportunity for these fi ve counties to consider using woody biomass to generate electricity.
Woody biomass from urban wood waste, logging residues, and forest thinnings can be used to generate renewable energy. Using wood to generate electricity provides many potential benefi ts such as reduced greenhouse gas emissions, healthier forests, and local jobs and other economic benefi ts.
To estimate the amount of wood that could be available in a community we include three sources: urban wood waste, logging residues, and pulpwood. While other woody biomass resources exist and could be added to the resource assessments, we include only these resources, for which cost and supply data are available.
Ur-ban wood waste is generated from tree and yard trimmings, the commercial tree care industry, utility line clearings, and greenspace mainte-nance. Logging residue is comprised of the left-overs from forest harvesting, such as tree tops and limbs, and poorly formed trees. Pulpwood refers to small diameter trees (3.6 to 6.5 inches diameter at breast height) that are usually har-vested for manufacturing paper, purifi ed cellu-lose products (such as absorbents, fi lters, rayon and acetate), and oleoresin products (such as pine oils, fragrances, cosmetics, and thinners).
County 2000 2005 Population Growth from 2000 to 2005 Alachua 217,955 223,852 2.7% Clay 140,814 171,095 21.5% Leon 239,452 245,756 2.6% Nassau 57,663 64,746 12.3% Santa Rosa 117,743 143,105 21.5%
This fact sheet excludes secondary woody waste from sawmills and furniture makers,
which is available but may already be used within the industry to produce energy. Economic concerns are major determinants of the feasibility of bioenergy (energy generated from biomass) projects—both the cost of fuel and the jobs that could be created. Assessing the economic availability of biomass requires learning about the delivered cost of wood, the quantity of wood that’s available, and its geographic distribution. This information is then used to create biomass resource supply curves, which express price per unit of biomass at a range of potential quantities of consump-tion. The following summary uses these methods to assess the economic availabil-ity of wood resources for Alachua, Clay, Leon, Nassau, and Santa Rosa Counties in Florida.
Cost Calculations
The delivered cost of woody biomass to a facility is the sum of the amount paid to buy the wood from the original owner (procurement), the harvest cost, and the trans-portation cost. Although rail transtrans-portation could be used in some cases, woody biomass is typically transported by truck. The cost of transportation depends on the time it takes a truck to travel from the harvest site to the facility. Haul times to the central delivery point in each county are calculated using a software program called ArcGIS Network Analyst Extension (Figure 1). Assuming that haulers drive the speed limit on the quickest route available to them, we calculate total transportation times for the forested areas around the delivery point, and then increase haul times (and thus costs) by 25 percent to account for delays, such as traffi c and stops. These haul-time areas delineate potential “woodsheds” or areas that can provide wood for a specifi c community or biomass user. If demand is established in more than one area in close proximity woodsheds can overlap, causing competing demand for biomass (Figure 1).
The sum of the procurement, harvest, and transportation costs are calculated to ob-tain the total delivered cost of urban wood waste, logging residues, and pulpwood at fi fteen-minute increments up to one
hour from each delivery point. De-livered costs allow us to see the pro-gression of the most- to least-expen-sive woody biomass resources. For example, if urban waste wood were delivered within the one-hour limit, the total delivered cost would be $19.46 per dry ton, or $1.25 per mil-lion British Thermal Units (MMBtu). However, if pulpwood were delivered from the same distance, the delivered cost would increase to $49.14 per dry ton, or $3.04 per MMBtu, primarily because pulpwood is more expensive than urban wood waste.
Physical Availability
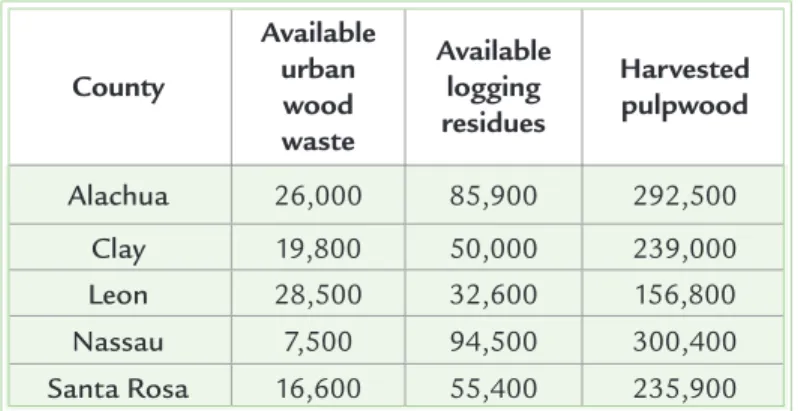
In addition to the delivered cost of wood, know-ing how much of each type of woody biomass is available is necessary to construct supply curves. Annually harvested pulpwood, and an-nually available urban wood waste and logging residues within the fi ve Florida counties are shown in Table 2. For urban wood waste, it is as-sumed that 0.203 green tons (40 percent mois-ture content) of urban wood waste is generated per person per year (from Wiltsee, 1998). This includes municipal solid waste wood from yard waste and tree trimming but excludes industrial wood (e.g., cabinet and pallet production) and construction and demolition debris. This average yield was multiplied by county population estimates (U.S. Census Bureau), and reduced by 40 percent to estimate total annual county yield of urban wood waste. For example, in Alachua County, this results in 26,000 green tons of urban wood waste per year.
The amount of logging residue and pulpwood for all counties in Florida is obtained from the USDA Southern Research Station 2003 Timber Product Output Reports. This database provides forest inventory and harvest information, including annual yields of forest residues and pulpwood. We reduced the fi gure for logging residues by 30 percent to exclude stumps. For example, in Leon County, there are 32,600 green tons (37 percent moisture) of logging residues available annually from existing forest-ry operations. There are also 156,800 green tons (50 percent moisture) of pulpwood harvested annually. Because the pulpwood harvest is currently used to produce pulp and paper products, not all of this resource is economically available for bioenergy. However, additional biomass is available from forest thinnings, which is not included in this assessment.
Supply Curve Construction
Given information regarding cost, quantity, and distribution of all three types of woody biomass, supply curves can be generated for fi ve selected Florida counties. Figure 2 on the next page shows the price of wood at different quantities needed. The y-axis represents price per million Btus of energy and the x-axis represents the total amount of wood available in 15-minute increments. Several scales are provided to translate the quantity of wood into tons, energy content, and houses electrifi ed (Fig-ure 2). Biomass sources include urban wood waste, logging residues, and pulpwood within a one hour haul radius of each county center (or the Deerhaven facility in the case of Alachua County).
Supply Analysis Results
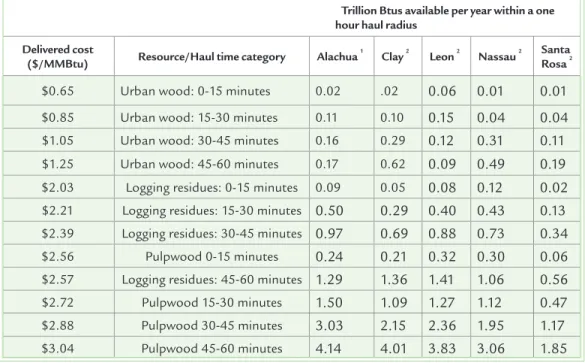
Energy resources and costs for each resource-haul time category for the fi ve counties are shown in Table 3 on the next page, and these values were used to construct the supply curves shown in Figure 2. The supply curves suggest that 1.5 to 3.6 trillion Btus (or 13 to 31 MW of electricity, which is enough to power approximately 5,000 to 12,500 households (Bellemar, 2003) are available for less than $2.60 per million
County Available urban wood waste Available logging residues Harvested pulpwood Alachua 26,000 85,900 292,500 Clay 19,800 50,000 239,000 Leon 28,500 32,600 156,800 Nassau 7,500 94,500 300,400 Santa Rosa 16,600 55,400 235,900
Table 2: Harvested pulpwood and available urban wood waste and log-ging residues (green tons/year) for fi ve Florida counties.
Btus in each of the fi ve woodsheds, which is competitive with the current costs of
coal. Within a one-hour haul radius, up to 0.3 to 1.0 trillion Btus can be provided from urban wood waste alone. With the addition of logging residues, 1.40 to 3.43 trillion Btus can be produced. Other types of wood may be available from thinnings to improve forest health, although estimates of this wood are not available. As the
Trillion Btus available per year within a one hour haul radius
Delivered cost
($/MMBtu) Resource/Haul time category Alachua
1
Clay 2
Leon 2
Nassau 2 Santa
Rosa 2
$0.65 Urban wood: 0-15 minutes 0.02 .02 0.06 0.01 0.01
$0.85 Urban wood: 15-30 minutes 0.11 0.10 0.15 0.04 0.04
$1.05 Urban wood: 30-45 minutes 0.16 0.29 0.12 0.31 0.11
$1.25 Urban wood: 45-60 minutes 0.17 0.62 0.09 0.49 0.19
$2.03 Logging residues: 0-15 minutes 0.09 0.05 0.08 0.12 0.02 $2.21 Logging residues: 15-30 minutes 0.50 0.29 0.40 0.43 0.13 $2.39 Logging residues: 30-45 minutes 0.97 0.69 0.88 0.73 0.34
$2.56 Pulpwood 0-15 minutes 0.24 0.21 0.32 0.30 0.06
$2.57 Logging residues: 45-60 minutes 1.29 1.36 1.41 1.06 0.56
$2.72 Pulpwood 15-30 minutes 1.50 1.09 1.27 1.12 0.47
$2.88 Pulpwood 30-45 minutes 3.03 2.15 2.36 1.95 1.17
$3.04 Pulpwood 45-60 minutes 4.14 4.01 3.83 3.06 1.85
Table 3: Available energy and delivered cost for each wood resource/haul time category and county included in this analysis. Resources are ranked from cheapest to most expensive based delivered cost of energy.
Figure 2: Biomass resource supply curves for fi ve select Florida counties.
1Delivery to the Deerhaven Facility. 2Delivery to the county center
cost of oil increases, all price estimates increase (with petroleum inputs for harvesting and transportation), but so does the costs of coal and natural gas. In other words, as fossil fuels become more expensive, the delivered cost of wood will increase but will become increasingly competitive with non-renewable fuels.
Economic Impact Analysis
The potential economic impacts of developing a 20 or 40 MW wood-fueled power plant in these fi ve counties in Florida are an important consideration. The construc-tion impacts of the project would be one-time event that is assumed to occur within a year, while the impacts of plant operations continue each year. Fuel costs were calcu-lated from the supply curves, and economic impacts were estimated using a software program called IMPLAN together with regional databases for each county. Note that these estimates included not only the direct impacts of plant construction and op-eration, but also the indirect impacts from local purchases to operate the plant and those associated with employee household spending.
Total construction costs were valued at $48.7 million for the 20 MW plant and $86.8 million for the 40 MW plant, including land, site work, construction, plant equip-ment, and engineering fees. The largest construction expenses were the boilers and turbines, ranging from $45 to $90 million. The total annual operating expenses (fi rst year) for a wood-fueled power plant averaged $8.0 million for 20 MW and $16.1 mil-lion for 40 MW. Fuel typically represents the largest operating cost for a facility, and averaged $4.0 and $9.9 million for the 20 or 40 MW plants, respectively. However, fuel costs varied across counties from $9.1 million to nearly $11.2 million for the 40 MW plant, due to differences in availability of forest and wood waste resources, as well as transportation infrastructure.
The estimated economic impacts that would result from construction and opera-tion of wood-fueled power plants in each of the counties are summarized in Table 4. The large range of values is due to the fact that some counties have industries that produce some of the major items needed for construction, while other counties must import these items from other regions, representing a leakage from the local econ-omy. For example, Santa Rosa County would experience greater economic impacts from plant construction because it has existing industries that manufacture key plant equipment such as boilers and turbines.
The economic impacts of annual operations in the fi rst year are also shown in Table 4. These results can be considered as permanent or recurring impacts. The impacts varied among counties due to differences in the specifi c makeup of the local econo-my, and in some cases the absence of key sectors serving wood-fueled power plant operations.
Often it is helpful to predict the distribution of economic impacts across various sec-tors of the local economy. More than 60 percent of all jobs would occur in the agri-culture and forestry sector, which supplies wood fuel to these plants. However, there would also be signifi cant employment impacts in the sectors for professional servic-es, retail trade, and government, refl ecting the indirect effects on the local economy associated with purchased supplies and employee household spending.
S
UMMARYANDC
ONCLUSIONEconomic concerns are important to discussions of using wood for energy. For many communities, the conversation begins with the recognition that there might be enough wood at an affordable cost. The supply analysis suggests that indeed, enough wood at a reasonable cost is available in Alachua, Clay, Leon, Nassau, and Santa Rosa counties to make a continued conversation possible. Up to 1.5 to 3.6 trillion Btus (i.e. 13 to 31 MW or energy to power 5,000 to 12,500 homes annually) of woody biomass are available at less than $2.60 MMBtu-1 in these fi ve north Florida counties. These
general estimates could be improved with more site specifi c information.
Additional assessments of local conditions, population density, distribution of wood, competition from pulp mills, restoration activities, and other factors would improve the accuracy of these biomass resource assessments. The following caveats should be considered when interpreting the results presented in this analysis:
• The supply considered in this fact sheet includes only urban wood waste, logging residues, and pulpwood. It excludes stumps, waste from forest operations, and waste from wood industries.
• Because the data are available at the county level, homogeneous distribution of resources within counties is assumed. Resource distribution within counties and location of bioenergy generating facilities will infl uence the actual economic availability of woody biomass for generation. More detailed local analysis might consider the distribution of biomass resources within counties, especially for site selection of biomass using facilities.
• The inclusion of other resources such as mill wastes or thinnings for forest man-agement and habitat restoration would increase available resources.
Florida County Wood Fuel Cost (Mn $)
Annual Operations Impacts
(fi rst year) Plant Construction Impacts Output ($Mn) Employment (Jobs) Value Added ($Mn) Output ($Mn) Employment (Jobs) Value Added ($Mn) 20 MW Alachua 3.84 13.52 196 8.38 8.00 81 4.30 Clay 3.37 11.73 182 7.10 7.60 74 3.70 Leon 4.52 13.41 156 8.55 7.80 74 4.10 Nassau 3.69 10.80 137 6.71 6.70 63 3.30 Santa Rosa 4.70 12.47 147 7.70 37.70 335 15.40 Average 4.02 12.39 164 7.69 13.56 125 15.40 40 MW Alachua 9.28 27.54 413 17.08 10.80 107 10.80 Clay 9.05 25.30 420 15.35 10.30 98 4.80 Leon 10.57 27.54 318 17.35 10.70 100 5.40 Nassau 9.46 27.54 297 14.56 9.00 82 4.20 Santa Rosa 11.23 27.54 307 16.18 65.50 578 26.30 Average 9.92 27.54 351 16.10 21.26 193 10.30
Table 4:Wood fuel costs and economic impacts of operations and plant construction for 20 and 40 MW power plants in selected Florida counties.
• This analysis is not intended to be a defi nitive resource assessment, but is rather meant to provide a starting point for discussions about the feasibility of using wood. Resources can be excluded or added as more information becomes avail-able and prices can be modifi ed to refl ect local conditions.
• A rise in the price of oil would increase the cost of the resources shown here, as well as costs of conventional energy sources such as coal.
• Some assumptions made in this analysis are subject to change. For example, large-scale bioenergy development in the area could increase competing demand for wood resources. The population in Florida is increasing, which might in-crease the availability of urban wood waste resources, though it could dein-crease overall available biomass resources.
• Rail transportation was not considered in this analysis, which could reduce transportation costs and make biomass resources from other areas more avail-able.
• Construction and operation of wood-fueled power plants may have signifi cant local economic impacts, but these impacts varied widely among selected coun-ties, depending upon the particular makeup of the local economy.
• Wood fuel represents one of the largest expenditures for a power plant, and gives rise to large impacts in the local forestry and forestry services sectors. Oth-er sectors of the local economy are also impacted through the indirect effects associated with purchased supplies and employee household spending.
• Impacts of a 40-megawatt power plant are greater than for a 20 MW plant, al-though not in proportion to the power output, due to economies of scale.
This profi le was adapted from the following source and used with permission. Langholtz, M., A. Oxarart, D. R. Carter, R. Schroeder, and A. Hodges. 2007. Wood to energy community economic profi le: Florida: Alachua, Clay, Leon, Nassau, and Santa Rosa Counties. In Wood to energy outreach program: Biomass ambassador guide, eds. M. C. Monroe, L. W. McDonell, and A. Oxarart. Gainesville, FL: Florida Cooperative Extension Service, Circa 1526, University of Florida.
R
EFERENCESBellemar, D. 2003. What is a Megawatt? http://www.utilipoint.com/issuealert/ar-ticle.asp?id=1728 (accessed July 13, 2006).
Condon, B., and F. Putz. Countering the Broadleaf Invasion: Financial and Carbon Consequences of Removing Hardwoods During Longleaf Pine Savanna Restoration. Restoration Ecology, 2007. 15(2): p.296-303.
Florida Division of Forestry. 2005. Present Condition of Florida’s Forest Resources: An Assessment, 2005. http://www.fl -dof.com/plans_support/ps_pdfs/resource_ plan2030.pdf.
U.S. Census Bureau. Retrieved 1-24-07 from http://www.census.gov/.
USDA Southern Research Station Timber Product Output (TPO) reports. http://srs-fi a2.fs.fed.us/php/tpo2/tpo.php (accessed November 15, 2006).