Identification of Security related Bug Reports via Text Mining using Supervised and
Unsupervised Classification
Katerina Goseva-Popstojanova and Jacob Tyo
Lane Department of Computer Science and Electrical Engineering West Virginia University, Morgantown, WV, USA
Email: [email protected] Abstract—This paper is focused on automated classification
of software bug reports to security and non-security related, using both supervised and unsupervised approaches. For both approaches, three types of feature vectors are used. For supervised learning, we experiment with multiple learning algorithms and training sets with different sizes. Furthermore, we propose a novel unsupervised approach based on anomaly detection. The evaluated is based on three NASA datasets. The results show that supervised classification is affected more by the learning algorithms than by feature vectors and using only 25% of the data for training provides as good results as if 90% of data are used for training. Both supervised and unsupervised learning can be used for identification of security bug reports; the former slightly outperforms the latter at the expense of labeling the testing set. In general, the performance differs across datasets, mainly due to the different amounts of security related information.
Keywords-software vulnerability; security bug reports; clas-sification; supervised learning; unsupervised learning; anomaly detection.
I. INTRODUCTION
Issue tracking systems are used by software projects to record and follow the progress of every issue that developers, testing personnel and/or software system users identify. Issues may belong to multiple categories, such as software bugs, improvements, and new functionality. In this paper, we are focused on software bugs reports (as a subset of software issues) with a goal to automatically identify those software bugs reports that are security related, that is, are related to security vulnerabilities that could be exploited by attackers to compromise any aspect of cybersecurity (i.e., confidentiality, integrity, availability, authentication, authorization, and non-repudiation).
Software bug reports contain title, description and other textual fields, and therefore text mining can be used for automating different tasks related to software bug reports. For example, text mining of software bug reports have been used in the past to identify duplicates [1], classify the severity levels [2], assign bugs to the most suitable development team [3], classify different types of bugs (i.e., standard, function, GUI, and logic) [4], and topic modeling to extract trends in testing and operational failures [5]. Only several related works, however, were focused on using text-based prediction models to automatically classify software bug reports to security related and non-security related [6], [7], and [8]. Prediction models used in these papers
were based on supervised machine learning algorithms that require labeled bug reports for training. Note that none of these works experimented with the size of the training set and its effect on the performance of the predictions.
In this paper we propose both a supervised approach and unsupervised approach that can be used to help security engineers to quickly and accurately identify security bug reports. Specifically, for both approaches we use three types of feature vectors: Binary Bag-of-Words Frequency (BF), Term Frequency (TF), and Term Frequency-Inverse Doc-ument Frequency (TF-IDF). For the supervised approach, we experiment with multiple algorithms (i.e., Bayesian Network, k-Nearest Neighbor, Naive Bayes, Naive Bayes Multinomial, Random Forest, and Support Vector Machine), each in combination with the three types of feature vectors. Unlike the related works [6],[7], and [8], we use training sets with different sizes to determine the smallest size of the training set that produces good classification results. We believe that this aspect of our work has an impact on the practical value of the automated classification because the manual labeling of the bug reports in the training set is a tedious and time consuming process. Furthermore, we propose, for the first time, an unsupervised approach for identification of security bug reports. This novel approach is based on the concept of anomaly detection and does not require a labeled training set. Specifically, we approached this as one-class classification, and classified bug reports similar to the descriptions of vulnerability classes from the Common Weakness and Enumeration (CWE) view CWE-888 [9], [10] as security related.
We evaluate the proposed supervised and unsupervised approaches on data extracted from the issue tracking systems of two NASA missions. These data were organized in three datasets: Ground mission IV&V issues, Flight mission IV&V issues, and Flight mission Developers issues. We used these three datasets in our previous work [11] to study the profiles of the security related bugs reports based on the manual classification of each bug report to one of the twenty one primary vulnerability classes from CWE-888 [10]. In this paper we use the manual classification from our previous work [11] as labels for the training sets in the case of supervised learning and as ground truth for evaluation of both the supervised and unsupervised learning approaches. https://ntrs.nasa.gov/search.jsp?R=20180004739 2019-08-31T15:41:09+00:00Z
In this paper we address the following research questions: RQ1: Can supervised machine learning algorithms be used to successfully classify software bug reports as security related or non-security related?
RQ1a: Do some feature vectors lead to better classifica-tion performance than other?
RQ1b: Do some learning algorithms perform consistently better than other?
RQ1c: How much data must be set aside for training in order to produce good classification results? RQ2: Can unsupervised machine learning be used to classify
software issues as security related or non-security re-lated?
RQ3: How does the performance of supervised and unsu-pervised machine learning algorithms compare when classifying software bug reports?
The main findings of our work include:
• Multiple learning systems, consisting of different com-binations of feature vectors and supervised learning algorithms, performed well. The level of performance, however, does depend on the dataset.
– Feature vectors do not affect significantly the clas-sification performance.
– Some learning algorithms performed better than others, but the best performing algorithm was different depending not only on the feature vector, but also on the dataset. In general, the Naive Bayes algorithm performed consistently well, among or close to the best performing algorithms across all feature vectors and datasets.
– The supervised classification was just as good with only 25% of the data used for training as with using 90% for training (i.e., the standard 10-fold cross validation).
• Unsupervised learning based on anomaly detection can be used for bug report classification.
• The best unsupervised classification results were not as good as the best supervised classification results. It appears that the choice of the learning approach is a tradeoff between better performance at expense of initial effort invested in labeling at least a quarter of the data.
The rest of the paper is organized as follows. The related work is presented in section II. In section III we present the details of our data mining approaches, including the data extraction and preprocessing, feature vectors we used, the proposed supervised and unsupervised learning approaches, and the metrics used for evaluation of the performance. The datasets and the manual labeling process used as ground truth for evaluation of the learning performance are de-scribed in section IV. The results of the supervised and unsupervised learning and their comparison are detailed in
section V, followed by the description of the threats to validity in section VI. The paper is concluded in section VII.
II. RELATED WORK
Issue tracking systems contain unstructured text, and therefore text mining can be used to automatically process data from such systems. Multiple papers explored bug report classification, with a focus on different aspects such as identification of duplicates [1], classification of severity level [2], assignment of bugs to the most suitable development team [3], classification of issues to bugs and other activities [12], [13], classification to different types of bugs (i.e., standard, function, GUI, and logic) [4], and topic modeling to extract trends in testing and operational failures [5]. None of these works considered security aspects of software bugs. Several works treated the source code as textual document and used text mining to classify the software units (e.g., files or components) as vulnerable [14], [15]. Hovsepyan et al. extracted feature vectors that contained the term frequencies (TF) from the source code and used SVM to classify which files contain vulnerabilities [14]. The dataset used in this work was the source code of the K9 mail client for Android mobile device applications. The static code analysis tool Fortify [16] was used to label the source code vulnerabilities and the following classification performance metrics were reported: recall of 88%, precision of 85%, and accuracy of 87%. Note, however, that these performance metrics were not with respect to the true class, but were based on comparison with the labels assigned by Fortify, which, as all static code analysis tools, does not detect 100% of vulnerabilities and has a very high false positive rate. In some sense, these results indicate that the method proposed in [14] performed similarly to Fortify. In another work, Scandariato et al. tried to identify components that are likely to contain vulnerabilities using term frequencies extracted from the source code along with Naive Bayes or Random Forest learners [15]. Using a dataset of twenty Android application, the prediction models led to recall between 48% and 100% and precision between 62% and 100%.
Somewhat related work by Perl et al. was focused on identification of Vulnerability Contributing Commits (VCC) within a version control system [17]. For this purpose, they mapped the CVEs and the commits leading to them, creating a vulnerable commit database. Based on that database, an SVM classifier was used to flag suspicious commits. This work used a dataset of 66 projects that used either C or C++ programming language. The authors stated that, compared to Flawfinder [18], their method cut the number of false positives in half, while maintaining a recall between 26% and 48% and precision between 11% and 56%.
Several papers were focused on some security aspects of software bugs [19], [20], [21], [22]. Wang et al. proposed a methodology for classification of vulnerabilities accord-ingly to their security types using Bayesian Networks [19].
The security types were defined as a subset of the NVD classification schema, and each vulnerability was classified as one of these types based on its CVSS Access Vector, Access Complexity, Authentication, Confidentiality Impact, Integrity Impact, and Availability Impact [23]. The prob-ability distribution of vulnerabilities was calculated from all vulnerabilities in the NVD related to Firefox, but no performance metrics were reported.
Gegick et al. used text mining on the descriptions of bug reports to train a statistical model on manually-labeled bug reports to identify security bug reports that were mislabeled as non security bug reports [20]. The SAS text mining tool was used for the feature vector creation, as well as prediction in a form of singular value decomposition (SVD). The bug reports data from four large Cisco projects were used as datasets. The text mining model identified 77% of the security bug reports which were manually mislabeled as non-security bug reports by bug reporters. This system, however, had a very high false positive rate, varying from 27% to 96%. In a similar work, Wright et al. conducted an experiment to estimate the number of misclassified bugs yet to be identified as vulnerabilities in the MySQL bug report database [21]. To determine which issues were misclassified, a scoring system was developed. The experiment was initially performed on a subset of issues from the MySQL bug database, and after the scoring, the results were extrapolated into the entire dataset. The closest to our work are three papers focused on classification of software bugs to security and non-security related [6], [7], and [8]. Often times, bugs are only identified as vulnerabilities long after the bug has been made public [6]. Wijayasekara et al. denoted such issues as Hidden Impact Bugs (HIBs) and, based on their previous work [22], created a system that can identify such bugs [6]. The authors first identified the CVEs for the Linux kernel and then gathered the corresponding bug reports. A basic “bag of words” approach in combination with Naive Bayes, Naive Bayes Multinomial, and Decision Tree classifiers were used, resulting in recall of 2%, 9%, and 40% and precision of 88%, 78%, and 28%, respectively.
Another related work by Behl et al. used the Term Frequency-Inverse Document Frequency (TF-IDF) along with an undefined “vector space model,” and compared the performance of this approach to an approach using the Naive Bayes algorithm [7]. The reported accuracy and precision (96% and 93%, respectively) were only marginally better than for the Naive Bayes. It should be noted, however, that neither accuracy nor precision, which were the only metrics reported in [7], represent well the ability to clas-sify bugs as security or not-security related. Specifically, both performance metrics can give misleading results for imbalanced datasets, which are expected in this situation. For cases like this, the recall and false alarm rate are much more appropriate performance metrics than accuracy and precision.
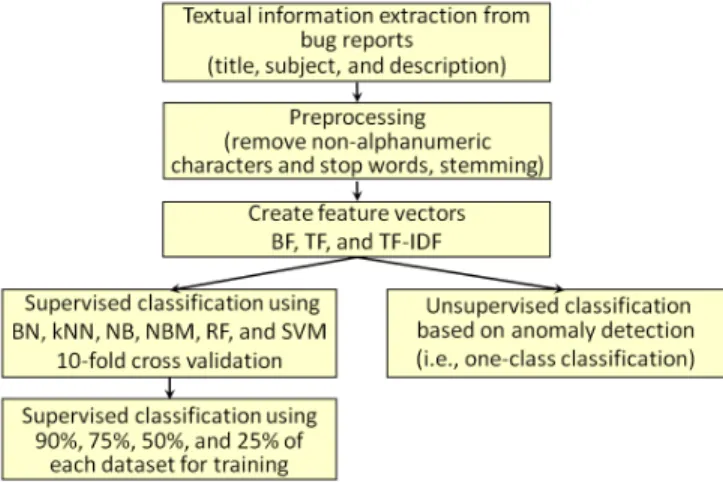
Figure 1. Overview of the proposed data mining approaches A recent work by Peters et al. proposed a framework called FARSEC, which integrated filtering and ranking for security bug report prediction [8]. Before building prediction models FARSEC identified and removed non-security bug reports with security related keywords. This filtering step was aimed at decreasing the false positive predictions. For prediction models FARSEC used the TF-IDF in combination with five machine learning algorithms: Random Forest, Naive Bayes, Logistic Regression, Multilayer Perceptron, and k-Nearest Neighbor. Finally, the results of the prediction models were used to create ranked lists of bug reports, with an expectation that security bug reports would be closer to the top of the ranked lists than to the bottom. FARSEC was evaluated on bug reports from Chromium and four Apache projects.
Common to the related works [6], [7], and [8] are the facts that (1) they all use prediction models based on supervised machine learning algorithms that require labeled bug reports for training and (2) none of these works experimented with the size of the training set with a goal to find the smallest training set that produces good prediction results.
III. PROPOSEDDATAMININGAPPROACHES The overview of the proposed data mining approaches is presented in Figure 1.
A. Data Extraction and Preprocessing
We approached the classification of bug reports as a text mining problem. First, the “Title”, “Subject”, and “Description” of each bug report were extracted, and then concatenated into a single string. The preprocessing steps included removing all non-alphanumeric characters using a regular expression in Python, converting all characters to lowercase, removing stop words1 using python’s Natural Language Toolkit (NLTK) English stop word list [24], and 1Stop words are words that do not contain important information to be used in the classification. Examples of stop words include: “a”, “and”, “but”, “how”, “or”, and “what.”
then stemming2 each word with Python’s Lovins stemming algorithm implementation [25].
After the preprocessing steps were completed, we were left with one string for each bug report in the dataset. The features to be used for the data mining were then extracted from these strings as described next.
B. Feature Vectors
The traditional terminology used in text mining includes: terms, documents, and corpus. A term is a word within a document, that is, in our case a word in the string representation of a bug report. A document is a collection of terms, that is, in our case the string representing a bug report. Acorpusis a collection of documents, that is, in our case the collection of strings representing all bug reports from a specific dataset. It follows that in this work there are three corpora, one for each dataset, which are denoted in the same manor as the datasets they originated from: Ground Mission IV&V Issues, Flight Mission IV&V Issues, and Flight Mission Developers Issues.
To conduct automated classification, it is necessary to extract feature vectors for each document. Each location in the feature vector represents a term, and the numeric value at that location measures the occurrence of that term in the document. The collection of terms (i.e., words) represented in feature vectors are referred to as thevocabulary. Select-ing a large vocabulary would improve the coverage, and therefore the amount of analyzed terms extracted from each document; however, this leads to a very large dimensionality, increasing complexity, and could result in unnecessary noise. In our case, it appeared that most of the textual descriptions in bug reports were focused on how the bugs were found, their manifestation, and how they were fixed. Consequently, the security aspects were often a small detail within each bug report, or were not present at all. Because of this, using a vocabulary that consist of every term in the corpus, which is a typical approach, was not suitable. In particular, out of around two million terms in the vocabulary, only a few terms were related to the security aspect and the rest was a noise from the perspective of automated classification. Therefore, we used a smaller vocabulary extracted from the CWE-888 view, which minimized the amount of noise in feature vectors.
In this paper we use three types of feature vectors: Binary Bag-of-Words Frequency (BF), Term Frequency (TF), and Term Frequency-Inverse Document Frequency (TF-IDF). The Binary Bag-of-Words Frequency (BF) is the most simplistic feature vector, defined by equation (1):
BF(term) =
{
0, if f(term) = 0
1, if f(term)>0 (1)
2Stemming is the process of reducing inflected (or sometimes derived) words to their word stem, base or root form.
whereBF(term)is the binary bag-of-words frequency of a term andf(term) represents the frequency (i.e., number of occurrences) of the term in the document. In other words, BF method only determines if each term in the vocabulary is in the document or not, that is, BF of any term can be either1or 0.
The Term Frequency (TF) feature extraction method re-tains more information about the terms in a document than the BF. As shown in equation (2), instead of 1s and 0s corresponding to the presence or absence of a term, TF records the frequency (or number of occurrences) of a term in the document:
T F(term) =f(term). (2) The Term Frequency-Inverse Document Frequency (TF-IDF) feature vector, defined by the equation (3), is an exten-sion of the TF feature extraction method, that weights the importance of a term in a specific document inversely to how often it appears in other documents. This is done to decrease the effect of terms that appear in many documents, because such terms likely contain little discriminatory information.
TF-IDF(term) =f(term)·log n
N(term) (3) wherenis the total number of documents, andN(term)is the number of documents that the specific term appears in. A common variation to these feature vectors is to exclude any terms that do not appear a minimum number of times in a document. This minimum frequency is often used to reduce the noise in a dataset. However, our work is focused on bug reports which often include only one word (i.e., term) pertaining to the security aspects of the bug. Therefore, to avoid loosing important information, no minimum frequency was set.
C. Proposed supervised classification
A supervised learning uses labeled training data to infer a model that describes the output from the input data. In this work we used the following supervised learning algorithms: Bayesian Network (BN), k-Nearest Neighbor (kNN), Naive Bayes (NB), Naive Bayes Multinomial (NBM), Random Forest (RF), and Support Vector Machine (SVM).
Here we define a (machine) learning system as a com-bination of a type of feature vector (described in Section III-B) and a supervised classifiers (listed earlier). Each learning system is denoted as FeatureVector Classifier. For example, if the Term Frequency (TF) feature vector was used in combination with the Naive Bayes Multinomial (NBM) classifier, this learning system is denoted as TF NBM.
To conduct supervised learning, each corpus has to be separated into two non-overlapping sets: training and testing. To achieve this, we first used the typical data mining approach based on 10-fold cross validation. This means the given dataset was split into ten equal folds (i.e., subsets),
Table I. CONFUSION MATRIX
Predicted class
Security bug report Non-security bug report Actual class Non-security bug reportSecurity bug report Count of False Positives (FP)Count of True Positives (TP) Count of False Negatives (FN)Count of True Negatives (TN)
and then the training was performed on nine of them, and the testing was performed on the remaining tenth fold. This was repeated ten times, with each fold used exactly once for testing, and the average values of the performance metrics are reported.
Next, we explored the smallest amount of data that must be set aside for training in order to produce good classifica-tion results. This research quesclassifica-tion was motivated by the fact that the standard 10-fold cross validation learning approach has limited practical value because it reflects the situation in which a human has completed the manual labeling of 90% of the data before attempting to do predictive classifi-cation. Therefore, we conducted experiments exploring the feasibility of classifying the bug reports on smaller subsets of labeled data. For each of the datasets, we tested if the learning systems can correctly classify the bug reports to security and non-security related when using 90%, 75%, 50%, and 25% subsets for training, and the remaining part for testing. The experiments for 90%, 75%, and 50% were performed using cross validation (that is, 10-fold, 4-fold, and 2-fold, respectively) and the results were averaged. For the 25% experiment, since a cross validation approach would not work, the experiments were performed using random stratified selection with four repetitions. The results from the four experiments were then averaged.
D. Proposed unsupervised classification
Unsupervised learning infers a function to describe hidden structure in the data from unlabeled data. The use of unsu-pervised learning approach was motivated by two drawbacks of supervised learning. First, supervised learning algorithms require manual labeling of data to be used for training (i.e., building the model), which then can be used for testing (i.e., classification) of the unseen data points. The manual labeling may require significant time and effort. Second, there is a very high likelihood that not all vulnerability classes will have significant numbers or even be present in the training set. Obviously, if a vulnerability class is never presented to a classifier during the training, it is unlikely that the classifier will correctly classify data points in the testing set belonging to that class.
In order to avoid the time consuming and costly manual labeling as well as guarantee that all classes have been properly defined and presented to a classifier, we propose a novel unsupervised machine learning approach based on anomaly detection. Anomaly detection refers to the problem of finding patterns in data that deviate from ‘normal’ [26].
In our case the CWEs descriptions given in the CWE-888 view are considered ‘normal’ and the unsupervised machine learning method (for the purpose of classification) identifies the deviation from ‘normal’ and classifies those documents (i.e.. bug reports) as non-security related. In other words, we set the classification problem as one-class classification. Basically, the feature vectorAextracted from CWE-888 descriptions defines the ‘normal’ behavior (in our case security related bugs). We use the cosine similarity distance measure defined by equation (4) to determine if the feature vector B of a document (i.e., bug report) is similar to the ‘normal’ (i.e., security related bugs as defined by the CWE descriptions) or not. The cosine similarity simply measures the distance (angle) between the feature vectors of two documents, and if the distance is greater than a threshold then the bug report is classified as non-security related (i.e., deviates from the ‘normal’). Otherwise, it is deemed to be similar to CWE descriptions and is classified as security related bug report.
similarity(A, B) = A·B ∥A∥ · ∥B∥ = ∑n i=1AiBi √∑n i=1A2i √∑n i=1Bi2 (4) Instead of guesstimating the value of the threshold, we adopted the method for threshold selection proposed in [27], which is based on testing a wide range of thresholds on the validation data, selecting the threshold which gives the best performance, and using it for measuring the similarity on the testing data. For this purpose, each corpus (i.e., dataset) was separated into two subsets, where one subset was used as the validation set and the other as the testing set. It should be noted that the threshold selection was based on the G-Score metric (defined with equation (10) in section III-E) because it integrates in one number the two most important performance metrics: recall and probability of false alarm. E. Performance Evaluation
The metrics used for performance evaluation are derived from the confusion matrix shown in Table I. The true (i.e., actual) class for this work is security related bug reports.
We compute the following metrics which assess different aspects of the classification:
Accuracy= TP+TN
TP+TN +FP+FN (5)
Recall = TP
PFA= FP
TN +FP (7)
Precision= TP
TP+FP (8)
The accuracy, given with (5), provides the percentage of bug reports that are classified correctly with respect to all bug reports. Accuracy has a limited value in cases when the classes are imbalanced, i.e., when one of the classes is much smaller than the other. Since the class of interest in our case is the security related bug reports, recall defined by equation (6), accounts for the probability of detecting a security related bug report (i.e., is defined as the ratio of correctly classified security related bug reports to all security related bug reports). Probability of false alarm (PFA), defined by (7), is the ratio of non-security related bug reports misclassified as security related bug reports to all non-security related bug reports. Precision, defined by (8), determines the fraction of bug reports correctly classified as security related out of all bug reports classified as security related. Accuracy, recall, probability of false alarm, and precision values are in the interval [0,1]; a good classifier has high accuracy, recall, and precision and a low probability of false alarm.
The F-Score is the harmonic mean between precision and recall (see equation (9)), which describes how well an automated system is able to balance the performance between precision and recall. Ideally, we want both recall and precision to be1, which leads to F-score equal to1. If either one is0, F-score is0 by definition.
F-Score= 2∗ Precision∗Recall
Precision+Recall (9) The G-Score is the harmonic mean between Recall and (1-PFA), as given by equation (10). High G-score indicates a good classifier, with high Recall and low PFA. The ideal G-score of 1 is obtained when the Recall= 1andPFA= 0. Note that G-Score accounts for the two most important metrics in our work – the Recall and PFA – and therefore it is used as criteria to compare how good different learning systems are, as well as for the selection of the threshold used in the unsupervised learning (see section III-D).
G-Score= 2∗ Recall ∗(1−PFA)
Recall + (1−PFA) (10) IV. DESCRIPTION OF THE DATASETS AND THE MANUAL
LABELING APPROACH
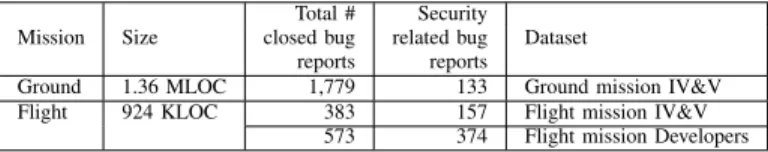
The three datasets from NASA utilized in this work were created by extracting relevant information from the IV&V issues of a ground mission, and both IV&V issues and developers’ issues of a flight mission. For all three datasets only the “closed” bug reports from their corresponding issue tracking systems were included. The details about these datasets are provided next.
The first dataset, referred to as Ground Mission IV&V Issues in this paper, was extracted from the IV&V issue
tracking system of a NASA ground mission. The ground mission software has 1.36 million source lines of code and 1,779 bug reports were created in the issue tracking system over four years. For this mission, the IV&V analysts specifically considered the security aspects of the mission and therefore the relevant bug report descriptions contained security related information. The IV&V analysts explicitly marked 350 of the bug reports as security related. Out of these we included only 133 in the dataset because the re-maining security issues were tagged as testing issues which do not deal with the actual software under investigation.
The second dataset, referred to as Flight Mission IV&V Issuesin this paper, consists of the IV&V issues extracted from the issue tracking system of a NASA flight mission. The flight mission software has 924 thousand source lines of code. Over four years, a total of 506 bug reports were entered in the issue tracking system, out of which 383 bug reports remained after the removal of bug reports marked as “Withdrawn” or “Not an Issue”. Even though this dataset was also created by IV&V analysts, security aspects of bug reports were not explicitly considered and bug reports’ descriptions contained little security related information. Instead, descriptions were mainly addressing aspects of software operation.
The third dataset, which is referred to as Flight Mission Developers Issues, consists of issues entered by software de-velopers in the dede-velopers’ issue tracking system of the same NASA flight mission as the Flight Mission IV&V Issues. In this issue tracking system a total of 1,947 Developer Change Requests (DCRs) were created over five and a half years, out of which 573 DCRs were tagged as “Defects”. (The remaining issues were marked either as “Change Requests” or some other non bug related type, and therefore were not included in the dataset used in this paper.) Since this dataset was created by the developers (instead by IV&V analysts) the textual descriptions were much more focused on the software operation than security aspects. As in case of the Flight Mission IV&V Issues dataset, no bug reports were explicitly marked as security related.
In order to be able to use supervised learning algorithms and have a ground truth for evaluation of both suprevised and unsupervised classification performance, we need the bug reports from all three datasets to be labeled as security related or non-security related. As mentioned earlier, only the bug reports from the Ground Mission IV&V Issues dataset were explicitly marked as security or non-security related. The bug reports of the two flight missing datasets (i.e., IV&V issues and Developers issues) were manually classified (i.e., labeled) by our research team in order to be able to build the vulnerability profiles presented in [11]. Here we only briefly describe our manual labeling approach. For details the readers are referred to our previous work [11], which was focused on studying the trends of the software vulnerabilities in mission critical software.
The manual labeling (i.e., classification) of each software bug was based on the information provided in the textual fields of the issue tracking systems and was guided by the definitions of the CWE-888 primary and secondary classes [10]. Several examples of manual bug reports classification include:
• A bug report with following description “. . . Line 277: Null pointer dereference of ‘getServiceStatusInfo(...)’ where null is returned from a method,” was classified as the CWE-888 primary class “Memory Access” and “Faulty Pointer Use” secondary class.
• A bug report with the description “. . . The stream is opened on line 603 of file1. If an exception were to occur at any point before line 613 where it is closed, then the ‘try’ would exit and the stream would not be closed,” was classified as the CWE-888 primary class “Resource Management” and “Failure to Release Resource” secondary class.
• A bug report with the description “. . . Table 1-11 lists XYZ as a unidirectional interfaces, but Figure 1-4 shows this connection as bidirectional,” was classified as non-security related.
Note that, similarly to static code analysis tools, we used a conservative labeling (i.e., classification) approach and treated as security related every bug report to which we could assign a CWE-888 class.
Using the above described manual labeling approach we labeled as security related 157 bug reports (out of 383 bug reports) in the Flight Mission IV&V Issues dataset and 374 bug reports (out of 573) in the Flight Mission Developers Issues dataset. Table II summarizes the basic facts of the two missions and the three datasets used for evaluation of the data mining approaches for security bug reports prediction.
Table II. BASIC FACTS ABOUT THE THREE DATASETS Total # Security
Mission Size closed bug related bug Dataset reports reports
Ground 1.36 MLOC 1,779 133 Ground mission IV&V Flight 924 KLOC 383 157 Flight mission IV&V
573 374 Flight mission Developers
V. RESULTS A. Results of supervised learning
In this section we present the result of the supervised ma-chine learning approach described in section III-C. We start with RQ1, which is focused on exploring if supervised ma-chine learning can be used to successfully classify software bug reports as security related or non-security related. In this part, we use all combinations of feature vectors presented in Section III-B and supervised classification algorithms listed in Section III-C on each of the three datasets.
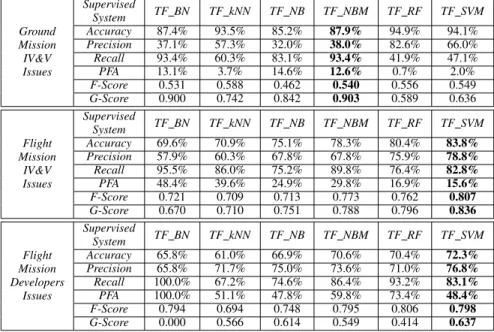
Table III presents the classification performance for each dataset when using Binary Bag-of-Words feature vector (BF) in combination with each supervised classifier. For each dataset, the column corresponding to the classifier that
performed the best with respect to G-Score is given in bold. Interestingly, but not unexpectedly, the best performing classifier was different for each dataset. Specifically, the best classifiers for the Ground Mission IV&V Issues dataset, Flight Mission IV&V Issues dataset, and Flight Mission Developers Issues dataset were the Bayesian Network, Ran-dom Forest, and Naive Bayes, respectively. Furthermore, some classifiers, such as Naive Bayes, had consistently good performance across all datasets. Other classifiers, such as Bayesian Network, performed well on one dataset, but poorly on other dataset(s), including G-Score of 0 on the Flight Mission Developers Issues dataset.
Table IV presents the classification performance for each dataset when using the Term Frequency (TF) feature extrac-tion method in combinaextrac-tion with each supervised classifier. (Again, for each dataset, the column corresponding to the best classifier with respect to G-Score is shown in bold.) In this case, the Naive Bayes Multinomial (NBM) classifier performed the best for the Ground Mission IV&V Issues dataset, while the Support Vector Machine (SVM) classifier was the best for both Flight Mission datasets. Consistently with the use of BF feature extraction method (see Table III) some classifiers performed consistently good across all datasets, while the performance of other classifiers varied significantly over different datasets, from very good to very poor.
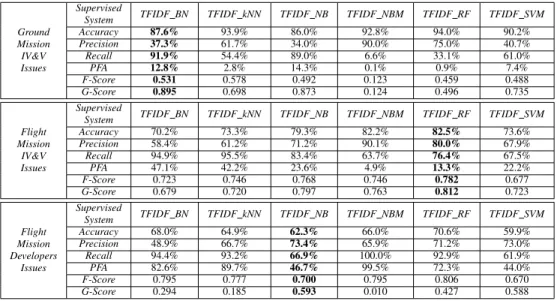
Table V presents the classification performance for each dataset when using the Term Frequency-Inverse Document Frequency (TF-IDF) feature vector in combination with each supervised classifier. (For each dataset, the column corresponding to the classifier that performed the best with respect to G-Score is shown in bold.) In this case, similarly as in case of BF feature extraction method, the best per-forming classifier was different for each dataset. Specifically, the Bayesian Network (BN) performed the best on the Ground Mission IV&V Issues dataset, the Random Forest (RF) classifier performed the best on the Flight Mission IV&V Issues dataset, and the Naive Bayes (NB) classifier provided the best results on the Flight Mission Developers Issues dataset. Some classifiers performed consistently good across all datasets, while the performance of other classifiers varied significantly over different datasets, from very good to very poor.
To address RQ1, based on the results presented so far, it appears that supervised learning can be used to successfully classify software bug reports to security related and non-security related. However, the results heavily depend on the datasets. In particular, regardless of the learning system, the results with respect to G-Score and other performance metrics were the best for the Ground Mission IV&V Issues dataset, followed by the Flight Mission IV&V Issues dataset. For these two datasets the classification was very successful. The worst classification performance was for the Flight Mission Developers Issues dataset. Note that the recall
Table III. CLASSIFICATION PERFORMANCE OFBFFEATURE VECTOR AND SELECTED SUPERVISED CLASSIFIERS ACROSS ALL THREE DATASETS. FOR EACH DATASET,THE COLUMN CORRESPONDING TO THE CLASSIFIER THAT PERFORMED THE BEST WITH RESPECT TOG-SCORE IS SHOWN IN BOLD.
Ground Mission IV&V Issues Supervised System BF BN BF kNN BF NB BF NBM BF RF BF SVM Accuracy 87.4% 94.6% 87.2% 88.7% 94.8% 94.3% Precision 37.0% 65.4% 36.7% 39.4% 80.3% 70.7% Recall 93.4% 62.5% 93.4% 89.7% 41.9% 42.6% PFA 13.1% 2.7% 13.3% 11.4% 0.9% 1.5% F-Score 0.530 0.639 0.527 0.547 0.551 0.532 G-Score 0.900 0.761 0.899 0.891 0.589 0.595 Flight Mission IV&V Issues Supervised System BF BN BF kNN BF NB BF NBM BF RF BF SVM Accuracy 69.9% 76.2% 70.7% 80.1% 84.0% 81.4% Precision 58.3% 70.4% 59.1% 70.6% 80.8% 79.1% Recall 94.3% 72.6% 93.0% 88.5% 80.3% 74.5% PFA 47.1% 21.3% 44.9% 25.8% 13.3% 13.8% F-Score 0.674 0.715 0.723 0.785 0.805 0.767 G-Score 0.678 0.755 0.692 0.807 0.834 0.799 Flight Mission Developers Issues Supervised System BF BN BF kNN BF NB BF NBM BF RF BF SVM Accuracy 65.8% 66.9% 66.9% 70.1% 69.5% 67.1% Precision 65.8% 69.4% 77.7% 70.2% 69.9% 74.7% Recall 100.0% 89.0% 69.8% 94.6% 94.4% 75.7% PFA 100.0% 75.5% 38.6% 77.2% 78.3% 49.5% F-Score 0.794 0.780 0.735 0.806 0.803 0.752 G-Score 0.000 0.384 0.653 0.367 0.353 0.606
Table IV. CLASSIFICATION PERFORMANCE OFTFFEATURE VECTOR AND SELECTED SUPERVISED CLASSIFIERS ACROSS ALL THREE DATASETS. FOR EACH DATASET,THE COLUMN CORRESPONDING TO THE CLASSIFIER THAT PERFORMED THE BEST WITH RESPECT TOG-SCORE IS SHOWN IN BOLD.
Ground Mission IV&V Issues Supervised System TF BN TF kNN TF NB TF NBM TF RF TF SVM Accuracy 87.4% 93.5% 85.2% 87.9% 94.9% 94.1% Precision 37.1% 57.3% 32.0% 38.0% 82.6% 66.0% Recall 93.4% 60.3% 83.1% 93.4% 41.9% 47.1% PFA 13.1% 3.7% 14.6% 12.6% 0.7% 2.0% F-Score 0.531 0.588 0.462 0.540 0.556 0.549 G-Score 0.900 0.742 0.842 0.903 0.589 0.636 Flight Mission IV&V Issues Supervised System TF BN TF kNN TF NB TF NBM TF RF TF SVM Accuracy 69.6% 70.9% 75.1% 78.3% 80.4% 83.8% Precision 57.9% 60.3% 67.8% 67.8% 75.9% 78.8% Recall 95.5% 86.0% 75.2% 89.8% 76.4% 82.8% PFA 48.4% 39.6% 24.9% 29.8% 16.9% 15.6% F-Score 0.721 0.709 0.713 0.773 0.762 0.807 G-Score 0.670 0.710 0.751 0.788 0.796 0.836 Flight Mission Developers Issues Supervised System TF BN TF kNN TF NB TF NBM TF RF TF SVM Accuracy 65.8% 61.0% 66.9% 70.6% 70.4% 72.3% Precision 65.8% 71.7% 75.0% 73.6% 71.0% 76.8% Recall 100.0% 67.2% 74.6% 86.4% 93.2% 83.1% PFA 100.0% 51.1% 47.8% 59.8% 73.4% 48.4% F-Score 0.794 0.694 0.748 0.795 0.806 0.798 G-Score 0.000 0.566 0.614 0.549 0.414 0.637
values for the Flight Mission Developers Issues dataset were also very good, but the high probability of false alarm (PFA) led to much lower G-Score than for the other two datasets. These results were somewhat expected having in mind that, as described in Section IV, the textual fields of the Ground Mission IV&V bug reports had more security relevant information than the other two datsets; the Flight Mission Developers’ bug reports had least security related information.
After presenting the results for all combinations of feature
vectors and classifiers, we can address RQ1a and RQ1b, which respectively are focused on exploring if some types of feature vectors and supervised classifiers perform consis-tently better than others. Based on the results presented in Tables III, IV and V it can be concluded that:
• The type of feature vector did not affect the perfor-mance of the learning systems significantly. BF and TF performed similarly, while TF-IDF performed slightly worse.
Table V. CLASSIFICATION PERFORMANCE OFTF-IDFFEATURE VECTOR AND SELECTED SUPERVISED CLASSIFIERS ACROSS ALL THREE DATASETS. FOR EACH DATASET,THE COLUMN CORRESPONDING TO THE CLASSIFIER THAT PERFORMED THE BEST WITH RESPECT TOG-SCORE IS SHOWN IN
BOLD. Ground Mission IV&V Issues Supervised
System TFIDF BN TFIDF kNN TFIDF NB TFIDF NBM TFIDF RF TFIDF SVM Accuracy 87.6% 93.9% 86.0% 92.8% 94.0% 90.2% Precision 37.3% 61.7% 34.0% 90.0% 75.0% 40.7% Recall 91.9% 54.4% 89.0% 6.6% 33.1% 61.0% PFA 12.8% 2.8% 14.3% 0.1% 0.9% 7.4% F-Score 0.531 0.578 0.492 0.123 0.459 0.488 G-Score 0.895 0.698 0.873 0.124 0.496 0.735 Flight Mission IV&V Issues Supervised
System TFIDF BN TFIDF kNN TFIDF NB TFIDF NBM TFIDF RF TFIDF SVM Accuracy 70.2% 73.3% 79.3% 82.2% 82.5% 73.6% Precision 58.4% 61.2% 71.2% 90.1% 80.0% 67.9% Recall 94.9% 95.5% 83.4% 63.7% 76.4% 67.5% PFA 47.1% 42.2% 23.6% 4.9% 13.3% 22.2% F-Score 0.723 0.746 0.768 0.746 0.782 0.677 G-Score 0.679 0.720 0.797 0.763 0.812 0.723 Flight Mission Developers Issues Supervised
System TFIDF BN TFIDF kNN TFIDF NB TFIDF NBM TFIDF RF TFIDF SVM Accuracy 68.0% 64.9% 62.3% 66.0% 70.6% 59.9% Precision 48.9% 66.7% 73.4% 65.9% 71.2% 73.0% Recall 94.4% 93.2% 66.9% 100.0% 92.9% 61.9% PFA 82.6% 89.7% 46.7% 99.5% 72.3% 44.0% F-Score 0.795 0.777 0.700 0.795 0.806 0.670 G-Score 0.294 0.185 0.593 0.010 0.427 0.588
across all datasets, even though it was not always the best performing classifier. Other classifiers (i.e., SVM and NBM) had fairly consistent performance, but not alaways among the best and as good as Naive Bayes performance. Last but not least, Bayesian Network clas-sifier performance varied significantly across datasets, with the best performance for one of the datasets, but very bad performance for other datasets.
Next, we present the results related to RQ1c, which is focused on determining the amount of data that must be set aside for training in order to produce good classification re-sults. For this part of our study, we restricted the experiments to the learning system consisting of the binary bag-of-words feature vector (BF) and the Naive Bayes (NB) classifier as it had consistently good performance across all datasets. As shown in Table VI, the best performance with respect to the G-Score for the Ground Mission IV&V Issues dataset was when 90% of the dataset was used for training. However, using less data for training, including as little as 25%, led to almost as good performance as in the case of 90% of the data used for training. Interestingly, for the Flight Mission IV&V Issues dataset the best performance was when using only 25% of the data for training. Similarity, for the Flight Mission Developers Issues dataset the best performance was achieved when only 50% of the data were used for training, with insignificant performance degradation when only 25% of data was used for training. This is an important results of our study, with a significant practical value. It shows that the learner system is able to produce similar or even better classification results with only 25% of the data being manually labeled and used for training (i.e., building the classification model).
Table VI. PERFORMANCE OFBF NBON DIFFERENT AMOUNTS OF TRAINING DATA,FOR ALL THREE DATASETS. FOR EACH DATASET,THE COLUMN CORRESPONDING TO THE CLASSIFIER THAT PERFORMED THE
BEST WITH RESPECT TOG-SCORE IS SHOWN IN BOLD.
Ground Mission IV&V Issues % of Issues for Training 90% 75% 50% 25% Accuracy 87.2% 86.3% 85.6% 86.7% Precision 36.7% 38.9% 34.0% 36.9% Recall 93.4% 92.5% 94.1% 93.5% PFA 13.3% 14.3% 15.1% 13.9% F-Score 0.527 0.548 0.500 0.529 G-Score 0.899 0.890 0.893 0.896 Flight Mission IV&V Issues % of Issues for Training 90% 75% 50% 25% Accuracy 70.7% 71.6% 76.4% 77.3% Precision 59.1% 83.7% 87.5% 90.5% Recall 93.0% 54.2% 66.7% 68.3% PFA 44.9% 10.6% 11.6% 10.1% F-Score 0.723 0.658 0.757 0.778 G-Score 0.692 0.675 0.760 0.776 Flight Mission Developers Issues % of Issues for Training 90% 75% 50% 25% Accuracy 66.9% 62.7% 65.1% 66.0% Precision 77.7% 80.3% 78.5% 75.9% Recall 69.8% 58.9% 64.2% 71.1% PFA 38.6% 29.5% 33.3% 43.8% F-Score 0.735 0.680 0.706 0.734 G-Score 0.653 0.642 0.654 0.628
B. Results of unsupervised learning
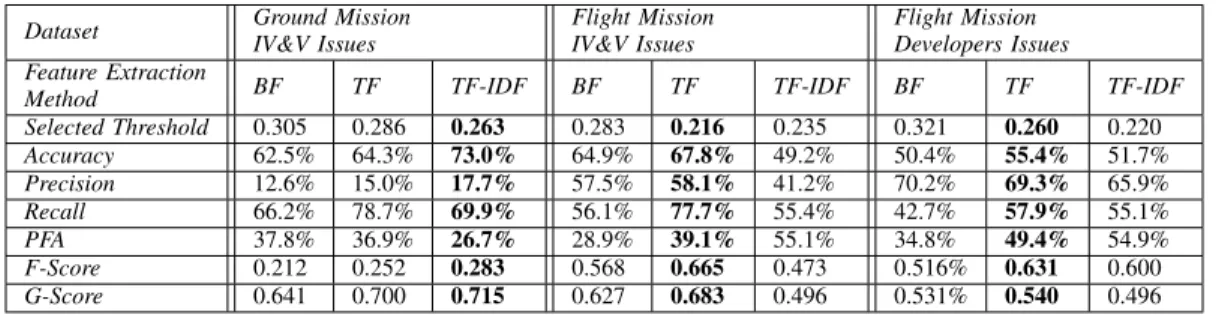
In this section we present the results related to RQ2, which is focused on exploring if unsupervised machine learning approach described in section III-D can be used to classify software bug reports as security related or non-security related. Table VII shows the results of the unsupervised learning, using the BF, TF, and TF-IDF feature vectors and cosine similarity, for all three datasets. The threshold values selected from the validation sets are also shown. It should be noted that the threshold values did not very significantly across different feature vectors or different datasets.
better G-Score in case of the Ground Mission IV&V Issues dataset, while TF feature vector led to better G-Score for both Flight Mission datasets. Unlike in the case of super-vised learning, BF feature vector underperformed compared to the TF and TF-IDF featured vectors. Consistently with supervised learning results presented in Section V-A, the unsupervised classification performance differed across the three datasets, with the best performance in the case of Ground Mission IV&V Issues dataset and worst performance for the Flight Mission Developers Issues dataset. In both cases this is due to the amount of security related informa-tion given in the bug reports, as discussed in Secinforma-tion IV.
We also used the Euclidean distance as the distance measure for the one-class classification. The results were consistent and very close to the ones based on using the Cosine Similarity. The only significant difference was the fact that the thresholds values in the case of the Euclidean Distance varied significantly across feature vectors, but not across datasets, unlike the threshold values in the case of Cosine Similarity which were consistent both across feature vectors and different datasets.
C. Comparisons of supervised and unsupervised learning performance
Next, we focus on comparing the performance of super-vised and unsupersuper-vised classification of software bugs to security related and non-security related, that is, address RQ3. Table VIII compares the G-score values of the su-pervised learning using the NB classifier (which showed consistently good performance across the three datasets) with the unsupervised learning based on Cosine Distance, for the three types of feature vectors.
As expected, the unsupervised learning performed slightly worse than the best supervised learning systems, which performed consistently well across datasets, such as the ones including the NB classifier. Note however, that the unsupervised learning does not require manual labeling of the data. Having in mind that supervised learning performed very well with only 25% of the data being labeled for training and provided somewhat better results, the choice of the learning approach becomes a tradeoff between better results at expense of initial effort invested in labeling one quarter of the data.
VI. THREATS TO VALIDITY
Construct validity is concerned with whether we are measuring what we intend to measure. Because of the issue tracking systems purpose, most of the textual descriptions in bug reports are focused on how the bugs were found, their manifestation, and how they were fixed. Consequently, the security aspects of a software bug description were often a small detail within each bug report, or were not even present. Because of this, each feature vector contained only a very few terms (as small as one) related to the
security aspect and the rest was noise from the perspective of automated classification. We attempted to address this threat by using a vocabulary extracted from the CWE-888 view, which minimized the amount of noise in feature vectors. This approach, however, may have a drawback related to the terminology used in bug reports. Specifically, if the documents being classified use security related terminology that does not exist in the CWE-888 view, then those terms are not being extracted, and therefore would not affect the classification. Based on the manual classification of each bug report, which we completed as a part of our prior work [11] and used as a ground truth in this paper, this did not appear to be the case in our datasets.
Internal validity threats are concerned with unknown influences that may affect the independent variables. One of the major concerns to the internal validity is data quality. Some guarantee for the quality and consistency of our datasets are due to the fact that NASA missions follow high record keeping standards. As described in section IV, for the two Flight mission datasets the descriptions of software bug reports did not explicitly address the potential security aspects of software bugs, which therefore could not be accounted for in our analysis.
Conclusion validity threats impact the ability to draw correct conclusions. Quantifying and comparing the perfor-mance of learning systems are difficult tasks because many different performance metrics exist that reflect different as-pects of the performance. In this work we report all metrics, but used the G-Score as the main metric for comparison of the automated classifications. This is due to the fact that G-Score integrates in one number the two most important performance metrics: recall and probability of false alarm. (High G-Score means a good learning system, with high recall and low probability of false alarm.)
External validity is concerned with the ability to gener-alize results. The facts that (1) this study is based on two large NASA missions containing around one million lines of code each and (2) the missions were developed by different teams over multiple years, allow for some degree of external validation. However, we do not claim that the findings of this paper would be valid for other software systems. Therefore, the external validity should be established by future studies that will use other software products as case studies.
VII. CONCLUSION
While multiple prior works used text mining for automat-ing different tasks related to software bug reports, very little work exists on using text-based prediction models to automatically identify security related bug reports. This paper is focused on automated classification of software bug reports to security related and non-security related, using both supervised and unsupervised approaches.
For both approaches we used three types of feature vec-tors: Binary Bag-of-Words Frequency (BF), Term Frequency
Table VII. UNSUPERVISED LEARNING PERFORMANCE USINGCOSINESIMILARITY,FOR ALL THREE DATASETS
Dataset Ground MissionIV&V Issues Flight MissionIV&V Issues Flight MissionDevelopers Issues Feature Extraction
Method BF TF TF-IDF BF TF TF-IDF BF TF TF-IDF
Selected Threshold 0.305 0.286 0.263 0.283 0.216 0.235 0.321 0.260 0.220 Accuracy 62.5% 64.3% 73.0% 64.9% 67.8% 49.2% 50.4% 55.4% 51.7% Precision 12.6% 15.0% 17.7% 57.5% 58.1% 41.2% 70.2% 69.3% 65.9% Recall 66.2% 78.7% 69.9% 56.1% 77.7% 55.4% 42.7% 57.9% 55.1% PFA 37.8% 36.9% 26.7% 28.9% 39.1% 55.1% 34.8% 49.4% 54.9% F-Score 0.212 0.252 0.283 0.568 0.665 0.473 0.516% 0.631 0.600 G-Score 0.641 0.700 0.715 0.627 0.683 0.496 0.531% 0.540 0.496
Table VIII. PERFORMANCE COMPARISON OF SUPERVISED LEARNING WITHNBCLASSIFIER(USING10-CROSS VALIDATION)AND UNSUPERVISED LEARNING WITHCOSINESIMILARITY,FOR ALL THREE DATASETS
Dataset Ground MissionIV&V Issues Flight MissionIV&V Issues Flight MissionDeveloper Issues Feature Extraction
Method BF TF TF-IDF BF TF TF-IDF BF TF TF-IDF
Supervised G-Score 0.899 0.842 0.873 0.692 0.751 0.797 0.653 0.614 0.593
Unsupervised G-Score 0.641 0.700 0.715 0.627 0.683 0.496 0.531 0.540 0.496
(TF), and Term Frequency-Inverse Document Frequency (TF-IDF). For the supervised approach, we used multi-ple learning algorithms (i.e., Bayesian Network, k-Nearest Neighbor, Naive Bayes, Naive Bayes Multinomial, Random Forest, and Support Vector Machine) in combination with the three types of feature vectors. A unique to our work is the fact that we experimented with training sets with different sizes (i.e., 90%, 75%, 50%, and 25% of the whole dataset) to determine the smallest size of the training set that produces good classification results.
Furthermore, we proposed a novel unsupervised approach for identification of security bug reports, which is based on the concept of anomaly detection and does not require labeled training set. Specifically, we approached this as one-class one-classification, and one-classified bug reports similar to the descriptions of vulnerability classes from the Common Weakness and Enumeration (CWE) view CWE-888 as se-curity related.
We evaluated the proposed supervised and unsupervised approaches on three datasets extracted from the issue track-ing systems of two NASA missions. The evaluation results led to the following main findings:
• Multiple supervised learning systems, consisting of different combinations of feature vectors and super-vised learning algorithms, performed well. It appears that supervised classification is affected more by the learning algorithms than by feature vectors. Some learning algorithms performed better than others; the best performing algorithm was different for different feature vectors and different datasets. In general, the Naive Bayes algorithm performed consistently well, among or close to the best performing algorithms across all feature vectors and datasets.
• Supervised classification of bug reports was just as good with only 25% of the data used for training as
with using 90% for training (i.e., the standard 10-fold cross validation). This finding has important practical implications because the manual labeling of the bug re-ports in the training set is a tedious and time consuming process.
• Unsupervised learning based on anomaly detection can be used for bug report classification, but it had slightly worse performance (with respect to G-Score) than the supervised learners. Note however that the better perfor-mance of the supervised learning comes at the expense of manual labeling the bug reports in the training set.
• The performance of the classification, both supervised and unsupervised, differed across the three datasets. This was mainly due to the different amounts of security related information provided in the textual fields of the bug reports. Interestingly, the lack of security related information affected the performance of the classification more significantly than the class imbalance problem. Thus, the classification performed the best on the Ground Mission IV&V Issues dataset, which had more security relevant information in the descriptions, even though this was the most imbalanced dataset (with only 7% of bug reports being security related).
In general, the results presented in this paper showed that automated identification of security related bug reports holds a great potential. Our future work is focused on experimenting with other approaches to build a vocabulary that may have potential to further improve the performance.
ACKNOWLEDGMENTS
This work was funded in part by the NASA Software Assurance Research Program (SARP) and by the NSF grant CNS-1618629. Any opinions, findings, and recommenda-tions expressed in this material are those of the authors and
do not necessarily reflect the views of the funding agencies. The authors thank the following NASA personnel for their support: Brandon Bailey, Craig Burget, and Dan Painter. The authors also thank Tanner Gantzer for his assistance.
REFERENCES
[1] N. Jalbert and W. Weimer, “Automated duplicate detection for bug tracking systems,” inProceedings of the 2008 IEEE In-ternational Conference on Dependable Systems and Networks (DSN), June 2008, pp. 52–61.
[2] A. Lamkanfi, S. Demeyer, Q. D. Soetens, and T. Verdonck, “Comparing mining algorithms for predicting the severity of a reported bug,” inProceedings of the 15th European Confer-ence on Software Maintenance and Reengineering (CSMR), March 2011, pp. 249–258.
[3] K. Somasundaram and G. C. Murphy, “Automatic categoriza-tion of bug reports using Latent Dirichlet Allocacategoriza-tion,” in Pro-ceedings of the 5th India Software Engineering Conference (ISEC’12), 2012, pp. 125–130.
[4] M. M. Ahmed, A. R. M. Hedar, and H. M. Ibrahim, “Pre-dicting bug category based on analysis of software repos-itories,” in Proceedings of the 2nd International Confer-ence on Research in SciConfer-ence, Engineering and Technology (ICRSET’2014), 2014, pp. 44–53.
[5] L. Layman, A. P. Nikora, J. Meek, and T. Menzies, “Topic modeling of NASA space system problem reports: Research in Practice,” inProceedings of the 13th International Confer-ence on Mining Software Repositories (MSR’16), 2016, pp. 303–314.
[6] D. Wijayasekara, M. Manic, and M. McQueen, “Vulnera-bility identification and classification via text mining bug databases,” inProceedings of the 40th Annual Conference of the IEEE Industrial Electronics Society (IECON 2014), Oct 2014, pp. 3612–3618.
[7] D. Behl, S. Handa, and A. Arora, “A bug mining tool to identify and analyze security bugs using Naive Bayes and TF-IDF,” in Procedings of the 2014 International Confer-ence on Optimization, Reliabilty, and Information Technology (ICROIT), Feb 2014, pp. 294–299.
[8] F. Peters, M. Thein T. Tun, Y. Yu, and B. Nuseibeh, “Text filtering and ranking for security bug report prediction,”IEEE Transactions on Software Engineering, vol. PP, no. 99, pp. 1– 1, 2017, iEEE Early Access Articles.
[9] N. Mansourov, “Software fault patterns: To-wards formal compliance points for CWE,” 2011, [online] https://buildsecurityin.us-cert.gov/sites/default/files/Mansourov-SWFaultPatterns.pdf. [10] “CWE-888: Software fault pattern (SFP) clusters, MITRE
Corporation,” https://cwe.mitre.org/data/graphs/888.html. [11] K. Goseva-Popstojanova and J. Tyo, “Security vulnerability
profiles of mission critical software: Empirical analysis of security related bug reports,” inProceedings of the 28th IEEE International Symposium on Software Reliability Engineering (ISSRE 2017), 2017, pp. 152 – 163.
[12] G. Antoniol, K. Ayari, M. Di Penta, F. Khomh, and Y.-G. Gu´eh´eneuc, “Is it a bug or an enhancement?: A text-based approach to classify change requests,” inProceedings of the 2008 Conference of the Center for Advanced Studies on Collaborative Research: Meeting of Minds (CASCON’08), 2008, pp. 23:304–23:318.
[13] I. Chawla and S. K. Singh, “An automated approach for bug categorization using fuzzy logic,” in Proceedings of the 8th India Software Engineering Conference (ISEC’15), 2015, pp. 90–99.
[14] A. Hovsepyan, R. Scandariato, W. Joosen, and J. Walden, “Software vulnerability prediction using text analysis tech-niques,” inProceedings of the 4th International Workshop on Security Measurements and Metrics (MetriSec’12), 2012, pp. 7–10.
[15] R. Scandariato, J. Walden, A. Hovsepyan, and W. Joosen, “Predicting vulnerable software components via text mining,”
IEEE Transactions on Software Engineering, vol. 40, no. 10, pp. 993–1006, Oct 2014.
[16] H. Packard, “Fortify static code analyser,” 2015, [online] http://www8.hp.com/us/en/software-solutions/static-code-analysis-sast/.
[17] H. Perl, S. Dechand, M. Smith, D. Arp, F. Yamaguchi, K. Rieck, S. Fahl, and Y. Acar, “VCCFinder: Finding po-tential vulnerabilities in open-source projects to assist code audits,” inProceedings of the 22nd ACM SIGSAC Conference on Computer and Communications Security (CCS’15), 2015, pp. 426–437.
[18] D. A. Wheeler, “Flawfinder,” 2016, [online] http://www.dwheeler.com/flawfinder/.
[19] J. A. Wang and M. Guo, “Vulnerability categorization using Bayesian Networks,” inProceedings of the 6th Annual Work-shop on Cyber Security and Information Intelligence Research (CSIIRW ’10), 2010, pp. 29:1–29:4.
[20] M. Gegick, P. Rotella, and T. Xie, “Identifying security bug reports via text mining: An industrial case study,” in
Procedings of the 7th IEEE Working Conference on Mining Software Repositories (MSR 2010), May 2010, pp. 11–20. [21] J. L. Wright, J. W. Larsen, and M. McQueen, “Estimating
software vulnerabilities: A case study based on the misclas-sification of bugs in MySQL server,” in Proceedings of the 8th International Conference on Availability, Reliability and Security (ARES), Sept 2013, pp. 72–81.
[22] D. Wijayasekara, M. Manic, J. L. Wright, and M. McQueen, “Mining bug databases for unidentified software vulnerabil-ities,” inProcedings of the 5th International Conference on Human System Interactions, June 2012, pp. 89–96.
[23] “Common Vulnerability Scoring System (CVSS),” 2015, The Forum of Incident Response and Security Teams (FIRST); https://www.first.org/cvss.
[24] N. Project, “Natural language tooklkit,” 2016, [online] http://www.nltk.org/.
[25] P. S. Foundataion, “Python,” 2016, [online] https://www.python.org/.
[26] V. Chandola, A. Banerjee, and V. Kumar, “Anomaly detection: A survey,”ACM Comput. Surv., vol. 41, no. 3, pp. 15:1–15:58, Jul. 2009.
[27] L. Manevitz and M. Yousef, “One-class document classifi-cation via Neural Networks,” Neurocomputing, vol. 70, pp. 1466 – 1481, 2007.