INTERNATIONAL JOURNAL OF AGRICULTURE &BIOLOGY
1560–8530/2006/08–1–5–9 http://www.fspublishers.org
Multiplate Penetration Tests to Predict Soil Pressure-sinkage
Behaviour under Rectangular Region
M.RASHIDI1, A.KEYHANI AND A.TABATABAEEFAR
Power & Machinery Department, Faculty of Agricultural Biosystem Engineering, University of Tehran, Tehran–Iran
1Corresponding author’s e-mail: [email protected]
ABSTRACT
Soil compaction may cause considerable damage to the structure of the tilled soil and the subsoil and consequently to crop production, and the environment. The prediction of soil sinkage under wheels and tracks is of great importance for determining the off-road vehicle performance and the level of compaction in the agricultural soils. Soil stiffness constants govern the soil sinkage and the behaviour of soil under load. To determine the stiffness constants of soil in the rectangular region, a sandy-loam soil reflecting general character of an agricultural soil was selected and multiplate penetration tests were conducted. Two low (1350 kg m-3) and high (1650 kg m-3) apparent bulk densities were considered as treatments in the
sandy-loam soil. For each treatment, from the pressure versus sinkage relationship of soil under different loads, the average soil stiffness constants
k
c,k
ϕ andn
were determined from the sets of three sinkage tests using three small rectangular plates thatdiffer in plate width and having aspect ratios close to those of agricultural tires' footings. Tests were replicated three times for each of the three small rectangular plates. Using the calculated soil stiffness constants for each treatment, the pressure-sinkage behaviour of a larger rectangular plate was predicted. For the apparent low bulk density the amounts of RMSE and MRPD were 6 mm and 8%, respectively. For the apparent high bulk density the amounts of RMSE and MRPD were 2 mm and 11.5%, respectively. The results showed that the prediction was better for the lower density soil.
Key Words: Pressure-sinkage; Soil compaction; Soil stiffness constants INTRODUCTION
Soil compaction is a process through which pore spaces are decreased. It alters the structure of cultivated soil, i.e., the spatial arrangement, size and the shape of clods and aggregates and consequently the pore spaces inside and between these units (Defossez & Richard, 2002). Soil compaction can be caused by natural phenomena such as rainfall impact, soaking, internal water tension and the like. Artificial soil compaction occurs under the downward forces of agricultural machines (McKyes, 1985). In this paper we are concerned with compaction by the wheeling of agricultural machines.
Soil compaction under tractors and farm machinery is of special concern because weights of these machines have been increased dramatically in the last decades and these implements create persistent subsoil compaction (Abu-Hamdeh & Reeder, 2003).
Agronomists are concerned about the effects of heavy tractors and agricultural machines on agricultural soils due to the possibility of excessive soil compaction that impedes root growth leading to yield reduction (Al-Adawi & Reeder, 1996). Hence, the prediction of soil sinkage under loads is an important task to determine the level of compaction in the soil.
For the last five decades, prediction of soil pressure- sinkage behaviour has been of great interest to researchers in both agriculture and cross-country mobility and transport (Bekker, 1956; Reece, 1964; Hegedus, 1965; Kogure, 1983;
Upadhyaya, 1989; Upadhyaya et al., 1993; Çakir et al.,
1999; Defossez & Richard, 2002; Rashidi et al., 2005).
Furthermore, the ability to predict soil sinkage can enable agricultural engineers to till or traffic the soil when it is not in a highly compatible state or to estimate the damage being done to the soil structure due to their excessive loading when tillage or traffic is necessary. Models presented in the literature are from a simple exponential function to an elastoplastic complicated one. Usually, in a more complete (and thus, a more complicated) model, many parameters and variety of properties are present and have to be known prior to solving the model.
Therefore, the overall objective of this study was to use a relatively simple model to predict the soil sinkage under a rectangular region using rectangular plates having aspect ratios close to the agricultural tractor tires' footing. The specific objectives of the study were: a) to determine the soil stiffness constants for sinkage of rectangular region with tests that use three small rectangular plates in low and high apparent bulk densities, and b) to predict the soil sinkage under a larger rectangular plate using the soil stiffness constants measured with three small rectangular plates in the same soil conditions.
MATERIALS AND METHODS
Pressure-sinkage models. Investigations into the nature of such phenomena and the soil parameters involved have arrived at findings in two different categories: situations in
RASHIDIet al. / Int. J. Agri. Biol., Vol. 8, No. 1, 2006
which time is considered as an important factor and those where it is not. For the case where time is not considered to be a factor, one of the earlier models was reported by Bekker (1956), and the following equation was proposed to describe it (McKyes, 1985; Upadhyaya et al., 1993):
n
kz
=
Ρ
(1)where:
Ρ
= vertical average contact pressure,kPa
,k
= a soil stiffness constant for sinkage,kPa
/
m
n,z
= depth of sinkage,m
,n
= a soil constant related to the soil characteristics,non-dimensional.
The principal deficiency of Eq. (1) for prediction of soil sinkage was found to be the variability of the soil stiffness
k
with the size of the object on the soil. In civil engineering technology, it was known that the sinkage of the rectangular plate, at a given average vertical pressure on a particular soil, depends also on the width of the rectangle. Bekker (1956) combined the two concepts, namely the exponential pressure-sinkage relationship of Eq. (1), and the plate size dependence of the soil stiffness constant as follow (Upadhyaya et al., 1994; Çakir et al., 1999):n c
b
k
z
k
/
)
(
+
ϕ=
Ρ
(2) where:b
= plate width,m
, ck
andk
ϕ= soil stiffness constants for sinkage, which arepresumed to be independent of plate width,
kPa
/
m
n−1 andkPa
/
m
n, respectively.The two parameters
k
c andk
ϕ separate the sinkagestiffness constant
k
into two components. Thus, three parameters are required to describe the sinkage phenomenon. These parameters are determined using surface pressure-sinkage tests. In order to evaluate the soil constant in Eq. (2), it is necessary to conduct at least two soil penetration tests using plates of different widths. The measured sets of pressure and sinkage values must then be analyzed graphically or analytically to find the best fit. From the best fit exponential curves, constantsk
andn
can be determined for each plate of the tests. The average value ofn
is used together with thek
values from the two plates toobtain
k
c andk
ϕ as shown below (Upadhyaya et al.,1994):
)
/(
)
(
1 2 2 1 2 1b
k
k
b
b
b
k
c=
−
−
(3))
/(
)
(
k
2b
2k
1b
1b
2b
1k
ϕ=
−
−
(4) where subscripts 1 and 2 refer to the values measured for plates 1 and 2.However, it may be risky to attempt the measurement of soil stiffness constants with tests that use only two plates, especially if they are small plates. A large variability exists in soils, even in carefully prepared laboratory samples, let alone at different locations in a field. Large rectangular plates, of the order 30 cm or more in width, can reduce the variation in experimental results, but they require large loads to approach practical sinkage pressure level and thus inconvenient and costly to perform, but smaller rectangular plates in the range of five to ten cm are handy for testing by one person.
It has been shown that the variation in
k
c andk
ϕ canbe considerable when only two small plates are used. When several plates are used rather than two, and the observations are pooled to find average stiffness constants, then the variation in
k
c andk
ϕ are reduced dramatically. Whenmore than two sinkage plates are tested, a statistical method can be used to calculate the stiffness constants. Constants
k
andn
are found for each plate. Then a graph can be made ofk
versus1
/
b
, in order to solve fork
c andk
ϕ. Abest-fit line is found by least square analysis and
k
c andk
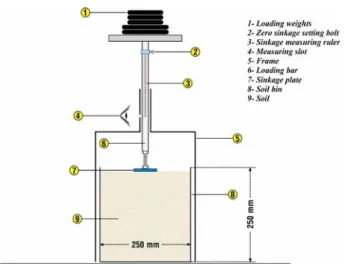
ϕ arethe slope and intercept of this line (McKyes & Fan, 1985). Test unit development. A test unit was developed to determine soil stiffness constants for sinkage. A self-explanatory schematic picture of the test unit is presented in Fig. 1. Three different rectangular plates were used in these tests. The plate dimensions are listed in Table I. Note that the three plates have the same contact area, but differ in width only. The aspect ratio (length/width) of these plates ranged from 1.5 to 2.8, which are similar to the ones expected for pneumatic tires' footings (for tracks long narrow strips are recommended). The aspect ratio of a tire or track footing can be defined as the length of the ground contact area divided by the width.
Experimental procedure. A sandy-loam soil was chosen for characterizing the agricultural soil. The sandy-loam soil was consisted of 16% clay, 22% silt and 62% sand. To prepare soil samples, as a first step, soil was sieved using a mesh size of 5 mm. Then, the soil was watered and covered with a sheet of plastic during the night in order to achieve a uniform moisture distribution. The measured soil moisture content was about 20% (d.b.), which made the soil sample to be in an arable condition as in the field. The soil was leveled and then firmed in the cubic soil bin by a wooden packer piston with the aid of a hydraulic press.
Two low (1350
kg
/
m
3) and high (1650kg
/
m
3) apparent bulk densities, representing the field apparent bulk densities, were considered as treatments. For each test run, each of three small rectangular plates was loaded slowly up to about 170 kPa and pushed downwards into the soil and at the same time the downward displacement (sinkage depth)MULTIPLATE PENETRATION TEST TO PREDICT SOIL PRESSURE-SINKAGE / Int. J. Agri. Biol., Vol. 8, No. 1, 2006
was measured with the sinkage measuring ruler. Different loads were applied using different loading weights and tests were replicated three times for each of the three small rectangular plates in both apparent bulk densities.
RESULTS AND DISCUSSION
Pressure-sinkage tests' results. The results of the pressure-sinkage tests were analyzed using the Bernstein's pressure-sinkage formula. Table II shows the calculated constants
k
andn
for each of the plates and treatments. Very high values of coefficients of determination,R
2 ranging from 0.90 to 0.99 were obtained for individual sinkage tests. However, the analysis indicated that the values of sinkage parameterk
varied considerably between plates. On the other hand, the exponentn
was less susceptible to this variation between plates.As shown in Figs. 2 and 3, to obtain
k
c andk
ϕ byusing the data from Table I, regressional analysis was applied to the constant
k
and the inverse of the plate width,1
/
b
. From the linear regression results,k
c andk
ϕare the slope and the intercept of the regression line, respectively. Our attempts to relate
k
to1
/
b
using Eq. (2) resulted in very good agreements. The calculated constantsc
k
andk
ϕ for each treatment are given in Table III.Sinkage prediction of a larger rectangular plate. Since circular footings have already been used to test the validity of the Bekker's model (McKyes & Fan, 1985; Çakir et al.,
1999), using Eq. (2), the soil stiffness constants measured with three small rectangular plates was used to predict the pressure-sinkage behaviour of a larger rectangular plate, and about three times the width. Besides, no results have been Fig. 1. Test unit
Fig. 2. Determination of
k
c andk
ϕ fromk
values of individual sinkage tests with plates of different sizes in low apparent bulk density soilk = 11.98 (1/b) + 675.5 R2 = 0.98 900 1000 1100 1200 20 25 30 35 40 1/b ( ) k n m kPa/ 1 − m
Table I. Sizes of sinkage plates used to determine soil stiffness constants in this study
Sinkage Plate Width, mm Length, mm Aspect Ratio
1 30 83 2.8
2 33 73 2.5
3 41 61 1.5
Table II. Values of constants
k
andn
for each of the plates and treatmentsTreatment Sinkage
Plate
Low Apparent Bulk Density High Apparent Bulk Density
k
(kPa
/
m
n) 2R
n
k
(kPa
/
m
n) 2R
n
1 1080.8 0.95 0.8332 1489.4 0.98 0.6906 2 1029.6 0.90 0.8243 1507.5 0.97 0.6956 3 970.8 0.94 0.7883 1646.0 0.99 0.7384Table III. Results of regression analysis of low and high apparent bulk density soils using three rectangular sinkage plates
n
ck
k
ϕR
2 Soil (kPa
/
m
n−1) (kPa
/
m
n) Low Apparent Bulk Density 0.8153 11.98 675.5 0.98 High Apparent Bulk Density 0.7082 -16.99 2046.4 0.95Table IV. Sizes of the large rectangular plate
Sinkage Plate Width, mm Length, mm Aspect Ratio
RASHIDIet al. / Int. J. Agri. Biol., Vol. 8, No. 1, 2006
reported in the literature yet for verification of the model for different bulk densities. Hence, a larger rectangular plate with dimensions listed in Table IV was used to test the model in two apparent bulk densities.
a. Low apparent bulk density soil. Fig. 4 shows the predicted pressure-sinkage behaviour of the larger rectangular plate, using the soil stiffness constants derived from tests on three small rectangular plates on the soil sample with a low apparent bulk density along with the measured values. For measuring pressure-sinkage behaviour, the larger rectangular plate was loaded slowly up to about 125 kPa and at the same time the sinkage depth was measured with the sinkage measuring ruler. From comparison of two curves, it could be concluded that
prediction is very reasonable over the measured sinkage range.
A linear regression was performed to verify the validity of the prediction. Fig. 5 shows that the sinkage values predicted using the soil stiffness constants derived from tests and those measured experimentally were plotted against each other and fitted with a linear equation with zero intercept. The slope of the line of the best fit and its coefficient of determination were 0.95 and 0.99, respectively.
Root of mean square errors (RMSE) and mean relative percentage deviation (MRPD) were used to check the discrepancies between the predicted and measured results. The amounts of RMSE and MRPD were 6 mm and 8%, respectively. Regarding the statistical results, the validity of the prediction was confirmed.
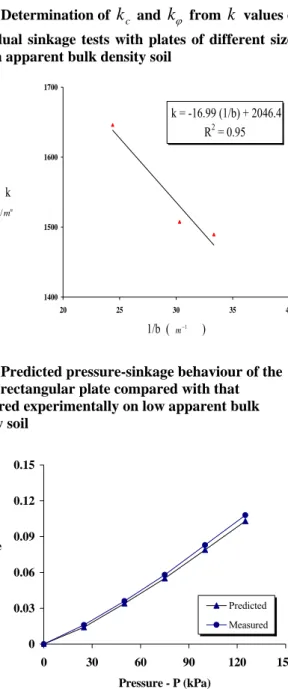
b. High apparent bulk density soil. Fig. 6 shows the Fig. 3. Determination of
k
c andk
ϕ fromk
values ofindividual sinkage tests with plates of different sizes in high apparent bulk density soil
k = -16.99 (1/b) + 2046.4 R2 = 0.95 1400 1500 1600 1700 20 25 30 35 40 1/b ( ) k 1 − m n m kPa/
Fig. 4. Predicted pressure-sinkage behaviour of the larger rectangular plate compared with that measured experimentally on low apparent bulk density soil 0 0.03 0.06 0.09 0.12 0.15 0 30 60 90 120 150 Pressure - P (kPa) Sinkage z (m) Predicted Measured
Fig. 5. Predicted and measured sinkage values on low apparent bulk density soil
y = 0.95 x R2 = 0.99 0 0.03 0.06 0.09 0.12 0.15 0 0.03 0.06 0.09 0.12 0.15 Measured Sinkage - x (m) Predicted Sinkage y (m)
Fig. 6. Predicted pressure-sinkage behaviour of the larger rectangular plate compared with that measured experimentally on high apparent bulk density soil 0 0.01 0.02 0.03 0 30 60 90 120 150 Pressure - P (kPa) Sinkage z (m) Predicted Measured
MULTIPLATE PENETRATION TEST TO PREDICT SOIL PRESSURE-SINKAGE / Int. J. Agri. Biol., Vol. 8, No. 1, 2006
predicted pressure-sinkage behaviour of the larger rectangular plate, using the soil stiffness constants derived from tests on three small rectangular plates on the soil sample with a high apparent bulk density along with the measured values. Again, for measuring pressure-sinkage behaviour, the larger rectangular plate was loaded slowly up to about 125 kPa and at the same time the sinkage depth was measured with the sinkage measuring ruler. From comparison of two curves, it could be concluded that prediction is very reasonable over the measured sinkage range.
As before, a linear regression was performed to verify the validity of the prediction. Fig. 6 shows that the sinkage values predicted using the soil stiffness constants derived from tests and those measured experimentally were plotted against each other and fitted with a linear equation with zero intercept. The slope of the line of best fit and its coefficient of determination were 0.88 and 0.99, respectively.
Again, root of mean square errors (RMSE) and mean relative percentage deviation (MRPD) were used to check the discrepancies between the predicted and measured results. The amounts of RMSE and MRPD were 2 mm and 11.5%, respectively. Regarding the statistical results, the validity of the prediction was confirmed again.
More likely, reason for such negligible discrepancies between the predicted and measured results using the soil stiffness constants stem out primarily from using three plates to enhance the level of confidence of the calculated soil stiffness constants. Had it been four or even five plates, the results would have been improved further (McKyes & Fan, 1985). The model, to some extent, showed better results for the lower bulk density soil. Although the results for the higher bulk density soil are reasonable, it appears that due to a probable unevenness of bulk density, a more packed soil seems to build higher stress concentrations underneath some parts of the plate from the very first moment of the application of the load. Therefore,
occurrence of a small variation in the bulk density during the soil sample preparation, could adversely affect the result. CONCLUSIONS
The
k
c andk
ϕ constants were calculated using threedifferent rectangular plates with different aspect ratios similar to those of pneumatic agricultural tires. In this study, the best-fitted regression model was obtained when the data from three rectangular plates were used in two soil conditions of low and high apparent bulk densities. The soil stiffness constants measured with three small rectangular plates were used to predict the pressure-sinkage behaviour of a larger rectangular plate. The statistical results confirmed the validity of the prediction, especially in the low bulk density soil, and demonstrated that under some conditions, it could be very useful to determine the sinkage behaviour of tires and tracks of tractors and agricultural machines in the laboratory condition without going to the field.
REFERENCES
Abu-Hamdeh, N.H. and R.C. Reeder, 2003. Measuring and predicting stress distribution under tractive devices in undisturbed soil. Biosys. Eng.,
85: 493-502
Al-Adawi, S.S. and R.C. Reeder, 1996. Compaction and subsoiling effects on corn and soybean yields and soil physical properties. Trans. ASAE, 39: 1641-9
Bekker, M.G, 1956. Theory of land locomotion-the mechanics of vehicle mobility. University of Michigan Press, Ann Arbor, MI: 522pp Çakir, E., E. Gülsoylu and G. Keçecioğlu, 1999. Multiplate penetration tests
to determine soil stiffness moduli of ege region. In: Proceedings of International Congress on Agricultural Mechanization and Energy, pp. 103-7. 26-27 May 1999, Adana-Turkey
Defossez, P. and G. Richard, 2002. Models of soil compaction due to traffic and their evaluation. Soil Till. Res., 67: 41-64
Hegedus, E, 1965. Plate sinkage study by means of dimensional analysis. J. Terramech., 2: 25-32
Kogure, K., Y. Ohira and H. Yamaguchi, 1983. Prediction of sinkage and motion resistance of a tracked vehicle using plate penetration test. J. Terramech., 20: 121-8
McKyes, E, 1985. Soil Cutting and Tillage. Elsevier Science Publishers. New York
McKyes. E. and T. Fan, 1985. Multiplate penetration tests to determine soil stiffness moduli. J. Terramech., 22: 157-62
Rashidi, M., R. Attarnejad, A. Tabatabaeefar and A. Keyhani, 2005. Prediction of soil pressure-sinkage behavior using the finite element method. Int. J. Agri. Biol., 7: 460-6
Reece, A.R, 1964. Problems of soil-vehicle mechanics. Land Locomotion Laboratory Report No. 8470 (LL97). Warren, Mich.: U.S. Army Tank-Automotive Center
Upadhyaya, S.K, 1989. Development of a portable instrument to measure soil properties relevant to traction. Research report. Davis, Calif.: Agricultural Engineering Department, University of California Upadhyaya, S.K., D. Wulfsohn and J. Mehlschau, 1993. An instrumented
device to obtain traction related parameters. J. Terramech., 30: 1-20
Upadhyaya, S.K., W.J. Chancellor, J.V. Perumpral, R.L. Schafer, W.R. Gill and G.E. Vanden Berg, 1994. Advances in soil dynamic. Vol. 1. ASAE, USA
(Received 20 October 2005; Accepted 10 December 2005)
Fig.7. Predicted and measured sinkage values on high apparent bulk density soil
y = 0.88 x R2 = 0.99 0 0.01 0.02 0.03 0 0.01 0.02 0.03 Measured Sinkage - x (m) Predicted Sinkage y (m)