Florida International University
FIU Digital Commons
FIU Electronic Theses and Dissertations University Graduate School
11-17-2017
An Integrated Multi-modal Registration Technique
for Medical Imaging
Xue Wang [email protected]
DOI:10.25148/etd.FIDC004051
Follow this and additional works at:https://digitalcommons.fiu.edu/etd Part of theBiomedical Commons, and theSignal Processing Commons
This work is brought to you for free and open access by the University Graduate School at FIU Digital Commons. It has been accepted for inclusion in FIU Electronic Theses and Dissertations by an authorized administrator of FIU Digital Commons. For more information, please [email protected]. Recommended Citation
Wang, Xue, "An Integrated Multi-modal Registration Technique for Medical Imaging" (2017).FIU Electronic Theses and Dissertations. 3512.
FLORIDA INTERNATIONAL UNIVERSITY Miami, Florida
AN INTEGRATED MULTIMODAL REGISTRATION TECHNIQUE FOR MEDICAL IMAGING
A dissertation submitted in partial fulfillment of the requirements for the degree of
DOCTOR OF PHILOSOPHY in ELECTRICAL ENGINEERING by Xue Wang 2017
ii To: Dean John Volakis
College of Engineering and Computing
This dissertation, written by Xue Wang, and entitled An Integrated Multimodal Registration Technique for Medical Imaging, having been approved in respect to style and intellectual content, is referred to you for judgment.
We have read this dissertation and recommend that it be approved.
_______________________________________ Jean H. Andrian _______________________________________ Armando Barreto _______________________________________ Mercedes Cabrerizo _______________________________________ Naphtali Rishe _______________________________________ Malek Adjouadi, Major Professor Date of Defense: November 17, 2017
The dissertation of Xue Wang is approved.
_______________________________________ Dean John L. Volakis College of Engineering and Computing _______________________________________ Andrés G. Gil Vice President for Research and Economic Development and Dean of the University Graduate School
iii
© Copyright 2017 by Xue Wang All rights reserved.
iv DEDICATION
I dedicate this dissertation to my supportive husband, Xianming Qidiao, to my lovely son, Edward R. Ming, for making this work meaningful. I also dedicate this work to my beloved mother, Jirong Yang, and father, Yuehua Wang. With their unwavering support, love and understanding, I found all the strength to carry on with my graduate studies, all the way to the Ph.D. degree.
v
ACKNOWLEDGMENTS
First and foremost, I would like to express my deepest gratitude to my major professor, Dr. Malek Adjouadi, for his excellent guidance, caring, patience, and invaluable insights throughout all the stages of researching and writing this dissertation, as well as for the financial support provided to me by the National Science Foundation through the CATE Center for the completion of this dissertation. He provided unwavering support during my Ph.D., patiently corrected my writing and generously paved the way for my development as a researcher. His passion and dedication are incomparable and always inspire me.
Next, I wish to express my great appreciation to my committee members, Dr. Jean H. Andrian, Dr. Armando Barreto, Dr. Mercedes Cabrerizo and Dr. Naphtali Rishe, for their valuable discussions improving the quality of this dissertation.
Furthermore, I would like to acknowledge the support provided from the Department of Electrical and Computer Engineering at Florida International University, and the critical support provided by the National Science Foundation (NSF) under grants: CNS-1532061, CNS-1551221, CNS-1042341, CNS-1429345, and IIP 1338922. The generous support of the Ware Foundation is also greatly appreciated.
I would also like to extend my gratitude to all my lab mates at the Center for Advanced Technology and Education for creating an amazing working environment, especially, Dr. Jin Wang, Dr. Zhenzhong Wang, and Dr. Lilin Guo, whose encouragement greatly helped me in achieving my research goals; to the ECE department staff, especially Ms. Pat Brammer and Mr. Oscar Silveira, who have given me great help and support.
vi
ABSTRACT OF THE DISSERTATION
AN INTEGRATED MULTIMODAL REGISTRATION TECHNIQUE FOR MEDICAL IMAGING
by Xue Wang
Florida International University, 2017 Miami, Florida
Professor Malek Adjouadi, Major Professor
Registration of medical imaging is essential for aligning in time and space different modalities and hence consolidating their strengths for enhanced diagnosis and for the effective planning of treatment or therapeutic interventions. The primary objective of this study is to develop an integrated registration method that is effective for registering both brain and whole-body images. We seek in the proposed method to combine in one setting the excellent registration results that FMRIB Software Library (FSL) produces with brain images and the excellent results of Statistical Parametric Mapping (SPM) when registering whole-body images. To assess attainment of these objectives, the following registration tasks were performed: (1) FDG_CT with FLT_CT images, (2) pre-operation MRI with intra-operation CT images, (3) brain only MRI with corresponding PET images, and (4) MRI T1 with T2, T1 with FLAIR, and T1 with GE images. Then, the results of the proposed method will be compared to those obtained using existing state-of-the-art registration methods such as SPM and FSL.
vii
Initially, three slices were chosen from the reference image, and the normalized mutual information (NMI) was calculated between each of them for every slice in the moving image. The three pairs with the highest NMI values were chosen. The wavelet decomposition method is applied to minimize the computational requirements. An initial search applying a genetic algorithm is conducted on the three pairs to obtain three sets of registration parameters. The Powell method is applied to reference and moving images to validate the three sets of registration parameters. A linear interpolation method is then used to obtain the registration parameters for all remaining slices. Finally, the aligned registered image with the reference image were displayed to show the different performances of the 3 methods, namely the proposed method, SPM and FSL by gauging the average NMI values obtained in the registration results. Visual observations are also provided in support of these NMI values. For comparative purposes, tests using different multi-modal imaging platforms are performed.
viii
TABLE OF CONTENTS
CHAPTER PAGE
1. INTRODUCTION ... 1
1.1 Retrospective on Registration in Medical Images ...1
1.2 General Statement of the Research Area ...11
1.3 Research Purpose ...11
1.4 Significance of the Research ...11
1.5 Structure of the Research ...12
2. A SEMI-AUTOMATIC REGISTRATION METHOD OF COMPUTED TOMOGRAPHY IMAGES ... 14
2.1 Introduction ...14
2.2 Related Work ...15
2.3 Methods...16
2.3.1 Control Points Selection ... 16
2.3.2 Affine Transformation ... 17
2.3.3 Interpolation ... 17
2.4 Data ...18
2.5 Experiments ...18
2.5.1 Minimizing Errors in Manual Selection of Control Points ... 18
2.5.2 Testing the Middle Slice of FDG_CT from Set 1 to 5 ... 19
2.5.3 Testing All Slices in Set 1 through 5 ... 19
2.5.4 Experimental Procedure ... 20
2.6 Evaluation Methods ...21
2.6.1 Mutual Information and Normalized Mutual Information ... 21
2.6.2 Alignment Metric ... 22
2.7 Results ...24
2.8 Conclusion ...29
3. AUTOMATIC REGISTRATION OF FDG_CT AND FLT_CT IMAGES ... 30
3.1 Introduction ...30
3.2 Related Work ...31
3.3 Methods...32
3.3.1 Image Pre-processing Methods ... 32
3.3.2 The procedures of GPW Method ... 35
3.4 Experiments ...36
3.4.1 Performance Verification of the Powell Method (PM) ... 36
3.4.2 Verification of Wavelet-Modified Genetic Algorithm (GA) ... 39
3.5 Results and Analysis ...40
3.6 Conclusion ...45
4. MULTI-MODALITY MEDICAL IMAGE REGISTRATION ... 47
4.1 Introduction ...47
4.2 Data ...47
ix
4.3.1 The Goal of the Four Experiments ... 49
4.3.2 Procedures of the Proposed Method ... 50
4.3.3 Evaluation Method ... 53
4.4 Optimizing Methods ...54
4.4.1 Genetic Algorithm (GA) ... 54
4.4.2 Powell Method (PM)... 60
4.4.3 Wavelet Decomposition ... 62
4.5 Results and Analysis ...66
4.5.1 Registration Results of Experiment 1—FDG_CT and FLT_CT ... 66
4.5.2 Registration Results of Experiment 2—Pre-MRI and Intra-CT ... 71
4.5.3 Registration Results of Experiment 3—MRI and PET ... 75
4.5.4 Registration Results of Experiment 4 ... 77
4.6 Discussion ...81
4.7 Conclusion ...81
5. CONCLUSIONS AND FUTURE WORK ... 84
5.1 Summary ...84
5.2 Future Work ...89
LIST OF REFERENCES ... 90
x
LIST OF TABLES
TABLE PAGE Table 2.1 Evaluation for sets 1 through 5: I is the input image, R is the reference image,
and O is the registered FLT_CT image ………...………..25
Table 3.1 Registration results of PM………...…..37
Table 3.2 Registration results of GA……….39
Table 3.3 Register FDG_CT and FLT_CT images by GPW……….41
Table 4.1 Example of Fitness Proportionate Selection………..57
Table 4.2 Example of One-point-crossover………...58
Table 4.3 Processing times of wavelet decomposition, GA and the total………..65
Table 4.4 Processing time and NMI comparison for the 5 data sets of experiment 1…...71
Table 4.5 Processing time and NMI comparison for the 5 data sets of experiment 2…...75
Table 4.6 Processing time and NMI comparison for the 5 data sets of experiment 3…...77
xi
LIST OF FIGURES
FIGURE PAGE Fig. 2.1 The registered image with 4 blue “+” marks overlapping the reference image
with 4 red “+” marks ……….24
Fig. 2.2 Images (a) and (b) are the input image and the reference image with four blue control points marked in each of them. Image (c) is overlapping the green reference image, slice No. 93 of FDG_CT of set 1, and the red input image which is rotating the green image 90-degree counter-clockwise. Image (d) is overlapping the output image and the reference image……….………25
Fig. 2.3 Set 1: 3 slices for the first registration. Images (a) are the first, the middle, and last of the unregistered slices; Images (b) show the registered slices ………...26
Fig. 2.4 The AM for set 1 to 5. Green data 1 is the AM of FLT_CT and FDG_CT; Blue data 2 is the AM of registered image and FDG_CT. Blue data is higher than green data (registration improved) in these parts: (a) from slice No.1 to slice No.11 and from slice No. 105 to slice No.186; (b) from slice No. 40 to slice No. 244; (c) and (d) all of the slices;(e) from slice No. 139 to slice No. 244 in set 5………...27
Fig. 2.5 Set 1 to 5: Overlapped the unregistered blue FLT_CT and red FDG_CT; overlapped are the registered green FLT_CT and red FDG_CT. These exemplify typical slice and whole body registration for all 5 patients………...28
Fig. 3.1 Pre-processing steps ………33
Fig. 3.2 Results of pre-processing procedure………....34
Fig. 3.3 The GPW integrated structure……….……….35
Fig. 3.4 Registration with GA optimization………...36
Fig. 3.5 Registration with PM optimization………..36
Fig. 3.6 Registration results of experiment # 1 using PM……….38
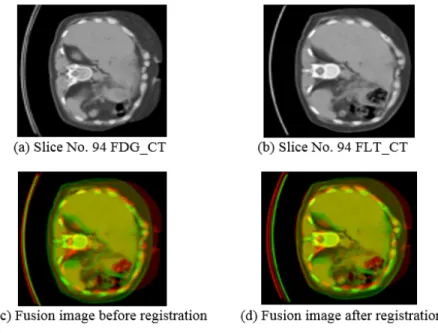
Fig. 3.7 Registration results of slice No.92 FDG_CT and FLT_CT image………...42
Fig. 3.8 Registration results of slice No.93 FDG_CT and FLT_CT image………...42
Fig. 3.9 Registration results of slice No.94 FDG_CT and FLT_CT image………...43
xii
Fig. 3.11 Registration results of slice No.96 FDG_CT and FLT_CT image……….44
Fig. 3.12 Registration results of slice No.97 FDG_CT and FLT_CT image……….44
Fig. 3.13 Registration results of slice No.98 FDG_CT and FLT_CT image……….45
Fig. 4.1 Flowchart of the proposed method……….…………..53
Fig. 4.2 Flowchart of the Genetic Algorithm……….55
Fig. 4.3 Selection operation………...57
Fig. 4.4 Flowchart of PM………...61
Fig. 4.5 Wavelet Decomposition to the second level……….…62
Fig. 4.6 Original slice # 93 of FDG_CT image, image size: 512-by-512………..63
Fig. 4.7 Wavelet decomposition to the first level, image size: 256-by-256, low-frequency component: L1, and high-frequency components: H1, D1, and V1……..64
Fig. 4.8 Wavelet decomposition to the second level, image size: 128-by-128, low-frequency component: L2, and high-frequency components: H2, D2, and V2……..64
Fig. 4.9 Original images……….…67
Fig.4.10 Patient # 1 of data set #1, (a) Original FDG_CT (appears in red) and FLT_CT (appears in blue) are overlapped; (b) Registration results using SPM12; (c) Registration results using FSL; and (d) Registration results using the proposed method……….…….69
Fig. 4.11 Enlarged spine in transverse image………69
Fig. 4.12 Enlarged skull in sagittal image……….69
Fig. 4.13 Enlarged spine and rib in sagittal image………70
Fig. 4.14 Original images………...72
Fig. 4.15 Patient # 1 of data set #2, (a) Original pre-operation MRI (appears in red) and intra-operation CT (appears in blue) are overlapped; (b) Registration results using SPM12; (c) Registration results using FSL; and (d) Registration results using the proposed method………74
xiii
Fig. 4.17 Enlarged skull in the sagittal image………....74 Fig. 4.18 . Patient # 1 of data set # 3, (a) Original MRI (appears in red) and PET
(appears in blue) are overlapped; (b) Registration results using FSL ;(c) Registration results using the proposed method ………...………..…….………...76 Fig. 4.19 Registration of T1 and T2 (a) the original T1 (appears in red) and T2 (appears in blue) are overlapped; (b) Registration results using SPM12; (c) Registration results using FSL; and (d) Registration results using the proposed method.………78 Fig. 4.20 Registration of T1 and FLAIR (a) the original T1 (appears in red) and FLAIR (appears in blue) are overlapped; (b) Registration results using SPM12; (c) Registration results using FSL; and (d) Registration results using the proposed method.………….…79 Fig. 4.21 Registration of T1 and GE (a) the original T1 (appears in red) and GE
(appears in blue) are overlapped; (b) Registration results using SPM12; (c) Registration results using FSL; and (d) Registration results using the proposed
xiv
ABBREVIATIONS AND ACRONYMS
CT Computed Tomography
MRI Magnetic Resonance Imaging
SPECT Single Photon Emission Computed Tomography PET Positron Emission Tomography
18F-FDG 18F-fluorodeoxyglucose 18F-FLT 18F-fluorothymidine
GA Genetic Algorithm
GPW Genetic-Powell-Wavelet
PM Powell Method
FSL FMRIB Software Library SPM Statistical Parametric Mapping
𝑀𝐼 Mutual Information
𝑁𝑀𝐼 Normalized Mutual Information
AM Alignment Metric
FLAIR Fluid-Attenuated Inversion Recovery Image GE Gradient and Spin-Echo Images
1
1. INTRODUCTION
1.1 Retrospective on Registration in Medical Images
The difficulties medical experts are facing extend beyond the need for the fusion of different imaging modalities, which in itself is a challenging problem, in order to provide better assessments of the needed treatment [1, 2]. Such a fusion becomes more meaningful only if it is backed by an effective and accurate registration process that consolidates the strengths that each of the modalities brings forth. The contentious issues involved with registration is due to the fact that not all modalities are aligned onto a same coordinate system, and the transformations that led to this misalignment are often not known. Of course, one way to overcome this challenge is to align in time and space by having simultaneous recordings performed using different modalities. Such are the cases of (1) EEG-triggered fMRI, where the source localization of epilepsy onset is validated through the BOLD effect in the fMRI, and where the EEG recording is done while a patient is inside the MR machine, (2) PET scans performed on hybrid machines that combine PET or SPECT with CT scanners (PET/CT or SPECT/CT) in order to consolidate anatomical with metabolic activity or function of a specific region of interest under a given pathology.
Registration of medical images could also involve a single imaging modality but with two different radiotracers as in the widely used 18F-fluorodeoxyglucose (18F-FDG) radiotracer, which serves as a good imaging tool in Computed Tomography (CT) and is
2
essential for cancer diagnosis as FDG uptake is higher in cancerous lesions and lower in benign ones; while 18F-fluorothymidine (18F-FLT) uptake is shown to be closely correlated with cellular proliferation. The registration of both of these tracers, FDG and FLT, complement one another to increase both sensitivity and specificity for imaging cancer. Accurate registration of both of these imaging modalities is thus sought in this study, as an example, to optimize the results of the diagnosis. This paper describes a novel feature-based registration method, which employs affine transformation and linear interpolation for FDG_CT and FLT_CT image modalities. Instead of using one set of affine transformation parameters, three slices have been selected to calculate all of the transformation parameters for CT image registration by linear interpolation. Thus, effective registration of these two CT images could prove very useful for diagnosis, including improved means for quantization and visualization.
As another example of multimodal imaging registration is in integrating the use of MR and CT, as the former is better suited for delineation of tumor tissue (and has in general better soft tissue contrast), while the latter is needed for accurate computation of the radiation dose. Another eminent example is in the area of epilepsy surgery. Patients may undergo various MR, CT, and DSA studies for anatomical reference; ictal and interictal SPECT studies; MEG and scalp and/or intra-cranial (subdural or depth) EEG, as well as FDG and/or C-Flumazenil PET studies. Registration of the images from practically any combination will benefit medical experts in surgical planning.
3
In Alzheimer’s disease (AD) research, the interaction of amyloid load through PET imaging, and regional cortical thickness through MRI are also extensively studied; with some adding cognition and APOE genotype for a more thorough assessment by combining neuroimaging with neuropsychological testing and the APOE gene.
There are many different kinds of medical images that have both advantages and disadvantages, for example, computed tomography (CT) images, contrast CT images, magnetic resonance images (MRI), weighted MRI, positron emission tomography (PET), and so forth. Hence registering these modalities will consolidate their strengths while overcoming their singular limitations. CT is especially useful for soft tissue, such as the brain, the thoracic and abdominal viscera, providing precise details for the physician. However, CT scanning will expose patients to a dose of radiation many times higher than that of X-rays. MRI also provides precise imaging, especially for delineating tumors and for extracting key morphological measures and features. MRI does not expose patients to radiation, but certain patients do not tolerate the confinements of the scanner bore of MR machine, and others with medical implants or other non-removable metal devices implanted inside their bodies may are cautioned against such scans. PET, on the other hand, is a molecular imaging process that enables visualization and assessment of metabolic processes of living cells in the body to gauge physiologic activity, including nutrient metabolism and blood flow of the organ or organs being targeted; whereas CT and MRI scans can only show static images. PET is thus widely used to diagnose conditions, such as heart disease, brain disorders, the spread of cancer, certain forms of infection, bone disease, and thyroid disease, among others [1]. Registered medical images
4
can be used for diagnosis, planning therapy and monitoring disease progression or response to therapy. For instance, registering the pre-operation MRI images with an normal control MRI image could help physicians to plan the operation before intervening in the brain of the patient; registering the series of anatomy CT images obtained at different stages could help physicians find the development of the tumor without operation; registering multi-modality images, MRI with CT or MRI with PET, could integrate various information in both of the images, so physicians could take all the structural and functional information into consideration at once, and so on.
Image registration involves aligning different sets of images into a common coordinate system, which could involve both time and space alignments. It is a complex task that often requires several steps, including image pre-processing, noise removal, affine transformations, interpolation, and optimization. A comprehensive and structured record of approaches to the registration of medical images is presented in [2]. Since the review in [2] was made in 1998, a more extensive and up to date review is provided in [3], which emphasizes the shift from extrinsic registration (in relation to external objects or markers when imaging a patient) to intrinsic registration (in relation to information obtained from the patient or anatomical landmarks), the prevalence in the use of intensity-based registration methods over relying on segmentation or template matching, the advent of nonlinear registration methods, the progress in performing inter-subject registration as well, and the availability of different software packages, such as FSL and SPM that automate the process of registration.
5
Methods are classified according to the different aspects of mutual-information-based registration they use as detailed in [4], which also describes aspects of preprocessing of images, gray value interpolation, optimization, adaptations to the mutual information measure, and different types of geometrical transformations. Image interpolation techniques, described in [5], are often required for image generation and processing such as resampling or compression. Several interpolation kernels of finite size have been introduced and a comparison is done. The goal in [5] was not to determine an overall best method, but to enable the reader to select an optimal method for their specific application in medical imaging. The relationship between the variations in the images and the type of most appropriate registration method to be used is given through a comprehensive survey in [6]. The three major types of variations confronted in the registration process are often due to: 1) different acquisition methods that lead to image misalignment; 2) difference in acquisition and lighting conditions; 3) differences in the images due to object movement or other scene changes. This survey is useful for understanding the merits and relationships between the wide variety of existing techniques and selecting the best technique for a specific registration problem. The problem of medical image registration for brain images is addressed in [7]. It includes a survey of recent literature, CT/MR registration using mathematical image features such as edges and ridges, mono-modal SPECT registration, and CT/MR/SPECT/PET registration using image features extracted by the use of mathematically derived morphology. A classification scheme for multimodal image matching is considered in [8]. This classification scheme involves 2D and 3D images, and it also provides spatial insight into function or anatomy/structure, electro-encephalography (EEG) and magnetoencephalography (MEG).
6
A measure of regional and global cerebral volume change derived directly from registered repeat MR scans is proposed in [9]. The boundary shift integral (BSI) was used to determine brain volume loss in 21 control-scan pairs and 11 scan pairs from Alzheimer’s disease patients. The potential of accurate image registration for detecting subtle changes in the brain has been tested in [10]. By the sub-voxel registration, subtle changes in the brain were detected in a variety of physiological and clinical situations. A classification of image registration by type of transformation and by methods employed to compute the transformation is provided in [11]. Two approaches to modeling soft tissue deformation for applications in image-guided interventions are described in this study. Validation of image registration is vital if the algorithms are to be used in clinical settings. An automated method to register MRI volumetric datasets to a digital human brain model is described in [12]. The non-linear registration method reduces the inter-subject variability of homologous points in standardized space by 15% over linear registration methods. A general-purpose interpolation for labeled point data is developed in [13]. This method ties the geometry of image deformation to the classic biometric algebra of quadratic forms. A technique for building compact models of the shape and appearance of a flexible object such as organs seen in 2D images is described in [14]. This technique also can be simply extended to 3D object segmentation or structure tracking in image sequences.
When rotating an image, there is often some loss of image quality. To determine which function would provide the best interpolation, including nearest neighbor, linear, cubic B-spline, high-resolution cubic spline with edge enhancement, and high-resolution cubic
7
spline, these five functions were compared in [15]. A new interpolation based super-resolution method, named FIPOCS (Fractal interpolation with Improved Projection onto Convex Sets), is discussed in [16]. The new interpolation method shows advantages when compared to the bilinear interpolation. A new matching criterion, mutual information (MI), is applied to medical image registration in [17]. The MI is assumed to be maximal if the images are geometrically aligned. Maximizing the MI measure remains a powerful criterion because no assumptions are made regarding the nature of this dependence and no limiting constraints are imposed on the image content of the modalities involved. This study also confirmed the accuracy of the MI criterion for rigid body registration of computed tomography (CT), magnetic resonance (MR), and photon emission tomography (PET) images.
Various image registration techniques are introduced for the purpose of mapping functional activity into an anatomical image or a brain atlas. An overview of brain functional localization along with a survey and classification of the image registration techniques related to that problem is presented in [18]. Recently, a large number of medical image registration methods based on the use of metaheuristics such as evolutionary algorithms have been proposed, resulting in decisive results. The success of such methods is related to their ability to perform an effective and efficient global search in complex solution spaces. The most recognized feature-based medical image registration methods considering evolutionary algorithms and other metaheuristics are presented in [19]. An image registration method carried out by maximizing a Tsallis entropy-based divergence using a modified simultaneous perturbation stochastic
8
approximation algorithm is described in [20]. This method has been demonstrated on CT, MRI, and PET images. The registration accuracy is enhanced when using this method. A new optimization method, named Big Bang-Big Crunch, which generates random points in the Big Bang phase and shrinks those points to a single representative point via a center of mass or minimal cost approach in the Big Crunch phase, is presented in [21]. This method shows superiority over an improved and enhanced genetic algorithm. A novel mutual information-based registration method that integrates the use of a Genetic Algorithm (GA), the Powell method (PM), and Wavelet decomposition in order to register in an optimal fashion the fluorodeoxyglucose (FDG)_CT and fluorodeoxythymidine (FLT)_CT image modalities are described in [22]. Registration through these tracers, FDG and FLT, increase both sensitivity and specificity for imaging cancer and is essential for optimizing the results of the diagnosis.
Nowadays, there are many mature optimization methods for image registration. Those methods could be classified into two categories: local and global. Nature selection is the principal source for the global optimization method, such as the genetic algorithm (GA) and simulated annealing (SA) method. An original usage of genetic algorithms as a robust search space sampler in an application to 3D medical image registration is presented in [23]. It focuses on the use of genetic algorithms, and particularly on the problem of extracting the optimal solution among the final genetic population. The algorithm is applied to the Vanderbilt medical image database to affirm its robustness. The suitability of GA for the model objective-function/search procedure is presented in [24]. A robust and efficient mutual information based method has been proposed in [25]. It is efficient
9
as it prevents the search process from being trapped at a local maximum. A mutual information based MR and CT image registration method is presented in [26]. This study chose GA as an optimization technique and demonstrated robustness and efficiency. The point-matching problem in image registration was addressed by a nearest-neighbor based on the GA algorithm in [27]. A full implementation detail for a global optimization method is described in [28]. This method is found to be more reliable at finding the global minimum than several other existing methods. Those heuristic population-based search procedures are incorporating random variation and selection, which may result in heavy computational requirements. A novel hybrid global-local optimization method is discussed in [29]. The local optimization method, such as the Powell method (PM), is good at determining a local solution with reduced computational load but where the solution sought might not be optimal [28, 29].
The Golden Search algorithm employed by using the Powell method is discussed in [30]. The use of local optimization methods together with the standard multi-resolution approach is not sufficient to reliably find the global minimum. To address this problem, a global optimization method is proposed that is specifically tailored to this form of registration. That is why the proposed algorithm is structured to combine/integrate the strengths of both GA and PM along with the use of the wavelet decomposition method. The slice matching process was improved by calculating the Normalized Mutual Information (NMI). The registration results were enhanced by finely choosing the initial point of the second registration. The computational time of the GA has been reduced by the wavelet decomposition method. We also show that proposed algorithm avoided being
10
trapped in the local best solution. The registration results achieved a non-linear registration effect by applying segmented linear interpolation. The study assumes rigid body imaging during image acquisition, although difficult to control in a clinical setting. Image acquisition at different times, breathing movements, or the position of the subject when acquiring images and so forth, all of them could affect our registration results.
How to estimate the results of medical image registration is still a problem, because no “golden estimation criterion” has been proposed. An overview of existing estimation criteria for medical image registration is presented in [31], including the advantages and shortcomings of each estimation method, it also proposes some improved methods for estimation. An investigation of similarity and dissimilarity measures and performance evaluation is given in [32].
To evaluate the registration results of the proposed method, SPM and FSL have been deployed to register the same data and compare their results. The Statistical Parametric Mapping (SPM) software package has been designed for the analysis of brain imaging data. Images are realigned, spatially normalized into a standard space, and smoothed by SPM [33]. The FMRIB Software Library (FSL) is a comprehensive library of analysis tools for fMRI, MRI and DTI brain imaging data. FLIRT is the FMRIB’s linear image registration tool. It is a fully automated, robust and accurate tool for linear intra- and inter-modal brain image registration [34, 35]. The average Normalized Mutual Information between each pair of the reference image and the registered image, and computational time of each method will be assessed in the results section.
11 1.2 General Statement of the Research Area
This research seeks to align in time and space different imaging modalities in medical imaging through an accurate and computationally effective registration. It encompasses both brain and whole body multimodal imaging registration. The intent is to combine in one integrated algorithm methods that improve in one setting bot brain and whole body registration to attain a similar accuracy of FSL for brain registration, and SPM for whole body registration, while minimizing the computational requirements that either of these well-established software modules (FSL and SPM) would require.
1.3 Research Purpose
The main purpose of this research is to develop effective algorithms that will automatically register different imaging modalities to yield the required accuracy for optimal fusion of these modalities that ensure optimal diagnosis, decision making, and treatment planning. Several experiments with different medical implications are carried out to validate the merits and purpose of this research. For example, by combining the complementary strengths of the two proven tracers in FDG and FLT is shown to improve the delineation of tumors and planning of treatment; and by combining MRI and PET imaging helps in gauging the interplay between amyloid deposition observed and cortical thinning as seen in the MRI, thus helping identify early stages of Alzheimer’s disease.
1.4 Significance of the Research
12
could yield validated and more meaningful information from a given patient with quantitative measures about the spatial and temporal relationship between all the image information. Aligning the spatial and temporal dimensions remains to be a challenging problem that this research aims at resolving through an integrated registration approach.
1.5 Structure of the Research
Chapter 2 introduces a semi-automatic registration method of FDG_CT and FLT_CT images. A brief introduction to the main method and related work is given. Then, the data and methods, including control point selection, affine transformation, and interpolation, are presented. There are four implementation aspects: 1) Minimizing errors in manual selection of control points; 2) testing the middle slice of FDG_CT from set 1 to 5; 3) testing all slices in set 1 to 5; 4) performing the experimental procedure. This chapter looks also into the evaluation methods, which includes the mutual information, the normalized mutual information, and the alignment metric. Then, the experimental results are given. Finally, concluding remarks are made on this earlier research initiative.
Chapter 3 presents an automated registration method for FDG_CT and FLT_CT images. A brief introduction on the main method and related work are presented. The focus is on its two intrinsic aspects: the image pre-processing, and the procedures of the integrated Genetic-Powell-Wavelet (GPW) method. Two experiments support the improved method introduced in this Chapter, namely the verification of the Powell method and the verification of the Wavelet-Modified Genetic Algorithm. The experimental results and analysis are provided, followed by concluding remarks.
13
Chapter 4 provides a more thorough investigation on the challenging steps of multimodal image registration augmented with a comparative study which contrasts the results of the proposed method with the most notable and well-established software platforms results, which are FSL and SPM. The proposed multimodal medical image registration method is hence compared to the Statistical Parametric Mapping (SPM) method that excels in whole body registration, and to the FMRIB Software Library (FSL) that excels in brain registration. The main method and related research are introduced. The datasets used in this chapter are described. The experiments conducted include: (a) the goals sought of the four different experiments, (b) a description of the implementation steps for the proposed method, and the evaluation conducted in assessing the merits of this new approach. Then, optimizing methods are discussed in detail, including the Genetic Algorithm (GA), the Powell method (PM), and the wavelet decomposition considered for optimizing the computational requirements. The registration results of the three different methods are shown juxtaposed for visual appreciation. The average normalized mutual information of the registered images are provided for evaluating the registration accuracy of each of these methods, summarizing the strengths and limitations of each method, with concluding remarks on what could be envisioned for future research to improve even further the challenging problem of registration.
Chapter 5 summarizes the dissertation, provides key remarks on what was accomplished through this research endeavor. It also summarizes the gains made when the registration is performed well.
14
2. A SEMI-AUTOMATIC REGISTRATION METHOD OF COMPUTED TOMOGRAPHY IMAGES
2.1 Introduction
The widely used 18F-fluorodeoxyglucose (18F-FDG) serves as a good imaging tool in Computed Tomography (CT) and is essential for cancer diagnosis as FDG uptake is higher in cancerous lesions and lower in benign lesions, while 18F-fluorothymidine (FLT) uptake is closely correlated with cellular proliferation. The registration of both of these tracers, FDG and FLT, compensate one another to increase both sensitivity and specificity for imaging cancer. Consequently, accurate registration of both imaging modalities is essential for optimizing the results of the diagnosis. This chapter describes a novel feature-based registration method, which employs affine transformation and linear interpolation for FDG_CT and FLT_CT image modalities. Instead of using one set of affine transformation parameters, three slices have been selected to calculate all of the transformation parameters for CT image registration by linear interpolation.
This method has the merits of: a) improving the 3D registration results for CT images; b) avoiding the arbitrary selection of that one slice for calculating the transformation parameters for registration; c) being easy to realize and computationally efficient. Experimental results obtained come in support of these assertions.
15 2.2 Related Work
Medical imaging technologies, such as CT and PET, have a significant impact on medical research and diagnostic radiology [36]. As CT is known to generate detailed images of soft tissues in the body, combining the complementary strengths of two proven tracers like FDG and FLT will only improve the outcome of the diagnosis. Thus integrating images to get more subtle information is often a requisite task in seeking such an outcome.
Image registration is the one process required for aligning different sets of data into one coordinate system in order to fuse, compare and analyze the data. Pixel values reflecting structural and functional information along with their positions should be taken into account. Image registration often includes preprocessing, affine transformations, interpolation, and overall registration process optimization [37]. Feature-based registration methods find correspondence between image features, such as points and lines. By obtaining the correspondence between a number of points in images, a transformation is then determined to map the input image to the reference image, establishing as a consequence a point-by-point correspondence between a reference image and its input counterpart [38].
An overview of medical image registration methods reveals that significant progress remains to be made towards optimized registration [37]. Feature matching methods could make use of similarity measurements as in studies [39, 40]. Mutual information based registration method using the point feature location information was developed to
16
estimate the accuracy in aligning the corresponding images. A novel aspect of this method is the emergence of correspondence between the two sets of features as a by-product of information maximization [41]. An approach, which automatically learns new corresponding landmarks from a database of 3D whole-body CT scans, using a limited initial set of expert-labeled ground-truth landmarks was presented in [42]. Based on landmark detection and calibrated camera-projector system, another technique was proposed for registration in minimally invasive spinal surgery [43]. An automated method for vertebra-based registration systems is proposed and assessed in [44].
2.3 Methods
2.3.1 Control Points Selection
As a first registration step, a set of control points (cp) is chosen. The cpselect function is utilized to start the control point selection tool in MatLab. The input image and the base image are displayed in the window of the tool. A blue mark with number 1 will appear when the user clicks on the base image once, then by clicking on the corresponding point in the input image, another blue mark with number 1 will appear on it. Blue marks with number 2 form the second control-points set and so on. Four such control-points sets would complete the process.
17 2.3.2 Affine Transformation
Affine transformation preserves points, straight lines, and planes in affine space. Parallel lines remain parallel, and the ratios of distances between points lying on a straight line are preserved. Affine transformation includes translation, rotation, and scaling. Affine transformation as applied in this study could be formulated as follows:
𝑥
𝑦 = 𝑎𝑎(* 𝑎𝑎)+ 𝑢𝑣 + 𝑎/
𝑎0 (2.1)
According to this model, 𝑥, 𝑦 is a point in the reference image, and 𝑢, 𝑣 is the point in the input image. Six parameters (𝑎(, 𝑎), 𝑎*, 𝑎+, 𝑎/, 𝑎0) can be calculated from three pairs of set points. Therefore, to define an affine transformation, at least three points should be chosen from the input image and the reference image respectively [45].
2.3.3 Interpolation
Interpolation is used in this case to construct new data points within the range of a discrete set of known data points. For example, 3 sets of parameters could be obtained from the first, the middle, and the last slices pairs. Those 3 sets are the known data points. New data points can then be constructed within the range of set 1 to set 2, as well as within the range of set 2 to set 3 by interpolation. Thus, if the total number of slices is k, and the middle slice number is i, new data points are the parameters from slice 2 to slice (i-1), and slice (i+1) to slice k.
18
Instead of registering two CT images with a set of registration parameters, k sets of parameters have been used to register each pair of slices. When k is the total number of slices in the given CT image, k sets of parameters will thus be obtained through linear interpolation.
2.4 Data
This phase I pilot study includes data from five patients with resectable and unresectable pancreatic cancers who underwent 18F-FLT and 18F-FDG imaging, each acquired within a week’s duration for the same patient. In these 5 datasets that have been tested, it is noted that each of them had FLT_CT and FDG_CT taken in different days. FDG_CT, in this study, is used as the reference image, which is unmoved, while the FLT_CT is used as the input image, which is moving in seeking that perfect alignment. Except for data set 1 which was of size (512*512*186), all other sets were of size (512*512*244) for both FDG_CT and FLT_CT image modalities.
2.5 Experiments
2.5.1 Minimizing Errors in Manual Selection of Control Points
To calculate the parameters of the first step of the registration process, control points have been chosen manually. With the manual selection process, it is difficult to visually select exactly the same point in two CT images; but choosing four vertexes of a rectangle as the assumed control points is easier as there is more contextual information. As can be
19
seen in Fig. 2.1, the four vertexes of the rectangle have been marked with a “+”; thus an initial test would be that the input image could be simply obtained by rotating the reference image by 90 degrees counter-clockwise; Register those two images, and overlap the registered image with the original image. The intent here for this simple experiment is to see the marks overlap to each other with 100% accuracy. Thus, if the control points have been chosen correctly, this registration method would yield perfect registration results.
2.5.2 Testing the Middle Slice of FDG_CT from Set 1 to 5
For set 1, slice No. 93 is the middle slice of the FDG_CT. That slice has been chosen as the reference image because it has more structures that can be chosen as control points than the skull. The input image has been obtained by rotating the reference image 90 degrees for visual convenience. Then register those two images. Fig. 2.2 shows this test. For set 2 to 5, slice No. 122 has been taken as the reference image for the same reasons mentioned above.
2.5.3 Testing All Slices in Set 1 through 5
Select 3 pairs of slices, for example, the first slice, the middle slice, and the last slice in each set, and then register each pair in the corresponding FDG_CT and FLT_CT. This step constitutes the first part of the registration process. Using the 3 pairs of affine transformation parameters obtained thus far, determine all other parameters by linear interpolation.
20 2.5.4 Experimental Procedure
The objective here is to register the 3D reference image FDG_CT.nii, and the 3D input image FLT_CT.nii, where nii stands for Nifti format. The procedure consists of 5 steps: Step 1: choose the slices from each 3D image for the first registration step. For example, slice No. 1, No. i, and No. k of each 3D image have been chosen.
Step 2: choose control points manually in each slice to obtain the base points and the input points for the first part of the registration process. For affine transformations, at least 3 control-points sets should be chosen. In our study, 4 base points and 4 input points have been chosen in slice No.1 of FDG_CT and FLT_CT, respectively.
Step 3: register those pairs of slices chosen in step1 to obtain the needed affine transformation parameters. For example, if we choose 3 slices pairs, we will get 3 sets of registration parameter for set 1, set 2, and set 3.
Step 4: use the affine transformation parameters determined in step 3 to calculate all of the other parameters by linear interpolation. Take k slices in total; for example, we use parameter set 1 and set 2 to calculate the parameters of slice No. 2 to Slice No. (i-1) (0<i<k), then we use parameter set 2 and set 3 to calculate the parameters of slice No. (i+1) to slice No. (k-1). Finally, all the affine transformation parameters can be obtained from slice No. 1 to slice No. k.
Steps 5: the second part of the registration process registers each pair of slices of the FDG_CT and the FLT_CT by using all the affine transformation parameter sets.
21 2.6 Evaluation Methods
2.6.1 Mutual Information and Normalized Mutual Information
The mutual information (𝑀𝐼) between image A and image B is:
𝑀𝐼 𝐴, 𝐵 = 𝐻 𝐴 + 𝐻 𝐵 − 𝐻(𝐴, 𝐵) (2.2)
𝐻 𝐴 , 𝐻 𝐵 , 𝐻(𝐴, 𝐵) are the entropies of image A, image B, and the joint entropy of images A and B [8], where:
𝐻 𝐴 = − >𝑃:(𝑎)𝑙𝑜𝑔)𝑃:(𝑎) (2.3)
𝐻 𝐵 = − A𝑃?(𝑏)𝑙𝑜𝑔)𝑃?(𝑏) (2.4)
𝐻 𝐴, 𝐵 = − >,A𝑃:?(𝑎, 𝑏)𝑙𝑜𝑔)𝑃:?(𝑎, 𝑏) (2.5)
with 𝑎 ∈ 𝐴, 𝑏 ∈ 𝐵, and 𝑃: 𝑎 , 𝑃? 𝑏 , 𝑃:?(𝑎, 𝑏) define the probability distribution of gray
values of image A, B and the joint probability distribution of gray values of images A and B. The normalized mutual information (𝑁𝑀𝐼) can thus be defined as:
𝑁𝑀𝐼 = E : ∗E ?CD (2.6)
From here onward, this is the NMI measure used throughout this dissertation to gauge the accuracy of the registration process.
22 2.6.2 Alignment Metric
Images 𝐼( 𝑥, 𝑦 and 𝐼) 𝑥, 𝑦 are 𝑀×𝑁 images, and 𝐻( 𝑛 and 𝐻) 𝑛 are their corresponding histograms. The gray scale of the image is 0 ≤ 𝑛 ≤ 255. If 𝑛 = 𝑖 , 𝐻( 𝑛 and 𝐻) 𝑛 are the total number of pixels whose gray value is i in 𝐼( 𝑥, 𝑦 and 𝐼) 𝑥, 𝑦 . The ratios of gray value i in image 𝐼( 𝑥, 𝑦 and 𝐼) 𝑥, 𝑦 are determined as follows:
𝑝( 𝑖 = 𝐻( 𝑖 /(𝑀×𝑁) (2.7) 𝑝) 𝑖 = 𝐻) 𝑖 /(𝑀×𝑁) (2.8) For each gray scale n in image 𝐼( 𝑥, 𝑦 , 𝐻( 𝑛 is the total number of pixels whose gray value is n, Determine next the coordinates of those pixels in 𝐼( 𝑥, 𝑦 , using the same coordinates to search for those same pixels in image 𝐼) 𝑥, 𝑦 and sum the gray values in those positions, then we could get the mean vector 𝐸(,) 𝑛 and the relative variance 𝜎(,)) 𝑛 as follows: 𝐸(,) 𝑛 =E( R S DR T,U VS𝐼) 𝑥, 𝑦 (2.9) 𝜎(,)) 𝑛 = ( ER S (𝐼) 𝑥, 𝑦 − 𝐸(,) 𝑛 ) ) DR T,U VS (2.10)
Similarly, for each gray scale n in image 𝐼) 𝑥, 𝑦 , 𝐻) 𝑛 defines the total number of pixels whose gray value is n, Similarly, determine the coordinates of those pixels in 𝐼) 𝑥, 𝑦 , and using these same coordinates, search for the pixels in image 𝐼( 𝑥, 𝑦 and
23
sum the gray values in those positions, then we could get the mean vector 𝐸),( 𝑛 and the relative variance 𝜎),() 𝑛 as follows:
𝐸),( 𝑛 =E( W S DW T,U VS𝐼( 𝑥, 𝑦 (2.11) 𝜎),() 𝑛 = ( EW S (𝐼( 𝑥, 𝑦 − 𝐸),( 𝑛 ) ) DW T,U VS (2.12)
These variances based on 𝐼( 𝑥, 𝑦 and on 𝐼) 𝑥, 𝑦 can be determined as follows:
𝜎(,)) = 𝑝 ( S (𝑛)𝜎(,)) 𝑛 (2.13) 𝜎),() = 𝑝 ) S (𝑛)𝜎),() 𝑛 (2.14)
Let’s define the cross variance (CI) based on 𝐼( 𝑥, 𝑦 and 𝐼) 𝑥, 𝑦 as given below: 𝐶𝐼 𝐼(, 𝐼) = YR,WW
YWW + YW,RW
YRW (2.15)
where, 𝜇( and 𝜇) are the mean values, and where 𝜎() and 𝜎
)) are the variance of image
𝐼( 𝑥, 𝑦 and 𝐼) 𝑥, 𝑦 , respectively. 𝜎() = ( C[ (𝐼( x, y − 𝜇( ) ) (T,U) (2.16) 𝜎)) = ( C[ (T,U)(𝐼) x, y − 𝜇) )) (2.17) Obviously, 𝜎() and 𝜎
)) are constants. The better images are registered, the smaller are the
𝜎(,)) and 𝜎
24
alignment metric (AM) as below, where the AM would consequently increase as the two images are registered better.
𝐴𝑀 𝐼(, 𝐼) =^D DR,DW( (2.18)
2.7 Results
Fig. 2.1 shows the control markers, which as expected are almost perfectly overlapping with each other. Minimal errors are still observed however for the rectangle as shown in Table 2.1 to indicate that manual selection of the control points is still difficult to perfect even under visual scrutiny. Table 1 provides the computed MI, NMI, and AM measurements, which clearly prove the soundness of the proposed registration method between the output image and the reference image.
Fig. 2.2 shows the results when overlapping the output image to the reference image. According to the results in Table 1, when the input image is exactly the same as the reference image, the average of maximum MI, NMI, and AM are 1.65178, 0.49938, and 17.72104, respectively. The MI, NMI, and AM are higher when FDG_CT and FLT_CT have been registered.
25
(a) (b)
(c) (d)
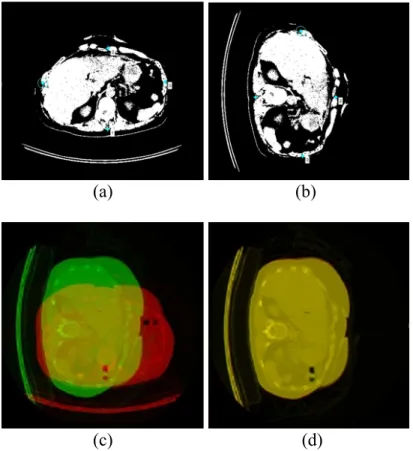
Fig. 2.2 Images (a) and (b) are the input image and the reference image with four blue control points marked in each of them. Image (c) is overlapping the green reference image, slice No. 93 of FDG_CT of set 1, and the red input image which is rotating the green image 90 degree counter-clockwise. Image (d) is overlapping the output image and the reference image.
Table 2.1 Evaluation for sets 1 through 5: I is the input image, R is the reference image, and O is the registered FLT_CT image
DATA SET1 SET2 SET3
IMAGES I&R O&R I&R O&R I&R O&R
MI 0.7199 1.9108 0.7647 1.6365 0.6548 1.6894
NMI 0.2065 0.5472 0.2140 0.4576 0.2061 0.5369 AM 0.9451 23.0493 1.0930 13.7417 0.7233 20.0637
DATA SET4 SET5 RECTANGLE
IMAGES I&R O&R I&R O&R I&R O&R
MI 0.6548 1.5133 0.7374 1.5089 0.0007 0.2300
NMI 0.2061 0.4776 0.2326 0.4776 0.0029 0.9094 AM 0.7233 11.8124 1.1149 19.9381 0.5022 26.9311
26
Fig. 2.3 Illustrates the results obtained by registering the 3 selected slices (using, in this case, the first, the middle, and last slices) in the first part of the registration process.
(a)
(b)
Fig. 2.3 Set 1: 3 slices for the first registration. Images (a) are the first, the middle, and last of the unregistered slices; Images (b) show the registered slices.
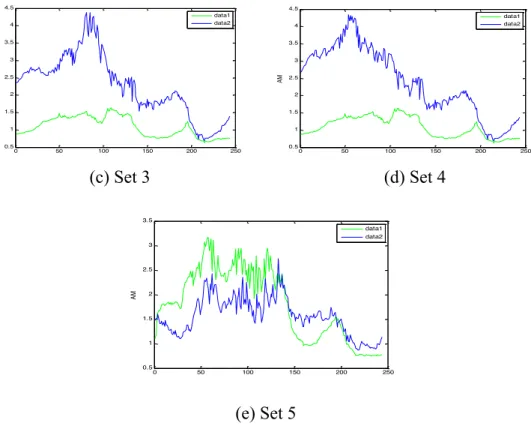
Fig. 2.4 shows the plots the AM measurements for all 5 sets for visual appreciation, and to see how these measurements vary depending on which parts of the body these slices belong to.
(a) Set 1 (b) Set 2
0 20 40 60 80 100 120 140 160 180 200 0.5 1 1.5 2 2.5 3 3.5 4 AM data1 data2 0 50 100 150 200 250 0.5 1 1.5 2 2.5 3 3.5 4 AM data1 data2
27
(c) Set 3 (d) Set 4
(e) Set 5
Fig. 2.4 The AM for set 1 to 5. Green data 1 is the AM of FLT_CT and FDG_CT; Blue data 2 is the AM of registered image and FDG_CT. Blue data is higher than green data (registration improved) in these parts: (a) from slice No.1 to slice No.11 and from slice No. 105 to slice No.186; (b) from slice No. 40 to slice No. 244; (c) and (d) all of the slices;(e)from slice No. 139 to slice No. 244 in set 5.
(a) Set 1 0 50 100 150 200 250 0.5 1 1.5 2 2.5 3 3.5 4 4.5 AM data1 data2 0 50 100 150 200 250 0.5 1 1.5 2 2.5 3 3.5 4 4.5 AM data1 data2 0 50 100 150 200 250 0.5 1 1.5 2 2.5 3 3.5 AM data1 data2
28 (b) Set 2
(c) Set 3
(d) Set 4
(e) Set 5
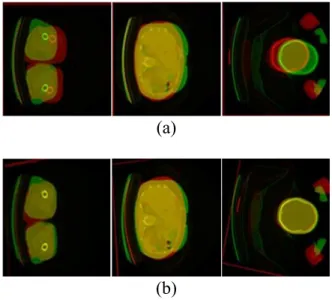
Fig. 2.5 Set 1 to 5: Overlapped the unregistered blue FLT_CT and red FDG_CT; overlapped are the registered green FLT_CT and red FDG_CT. These exemplify typical slice and whole body registration for all 5 patients
Fig. 2.5 Provides the results of the overall registration process illustrated through a typical dataset, with similar good results obtained for the other four datasets. For the visual appreciation of the merits of these registration results, focus on the ossature frame, and more specifically on the vertebrae as shown in the FDG_CT and their counterpart in the FLT_CT. Recall that these image modalities were obtained on different days.
29 2.8 Conclusion
To sum up, the method as proposed improved the CT registration of the FDG_CT and FLT_CT imaging modalities, in support of combining the strengths of both tracers in cancer diagnosis. The registration of these slices provides a comprehensive 3D whole- body combined FDG-FLT CT image. To avoid arbitrarily using one set of affine transformation parameters to register images, three (first, middle and last) slices were initially used to calculate the whole set of transformation parameters for the entire 3D whole body CT images through linear interpolation. Improvements could be observed obviously in the skull and the bottom parts of the whole body CT.
Computationally, this method can accomplish the registration of two 512*512*244 bit CT images in about 1 minute of processing time using MatLab on a Windows 7 workstation with 3.40 GHz Intel (R) Core (TM) i7-2600 CPU and 4GB RAM. Experimental results clearly demonstrate the soundness of the proposed method in terms of both small registration errors as indicated in Table 2.1 as well as and in terms of visual scoring or appreciation.
30
3. AUTOMATIC REGISTRATION OF FDG_CT AND FLT_CT IMAGES
3.1 Introduction
This chapter describes a novel mutual information-based registration method that integrates the use of a Genetic Algorithm (GA), the Powell method (PM), and Wavelet decomposition in order to register in an optimal fashion the 18fluorodeoxyglucose (FDG)_CT and 18fluorodeoxythymidine (FLT)_CT image modalities. By registering these two computed tomography (CT) modalities, we combine the strengths of the two radiotracers knowing that FDG uptake is higher in cancerous lesions, while FLT uptake is closely correlated with cellular proliferation.
Registration through these tracers, FDG and FLT, increase both sensitivity and specificity for imaging cancer and is essential for optimizing the results of the diagnosis. In this study, this integrated approach, which combines the Genetic Algorithm, Powell method augmented through the Wavelet decomposition, we refer to as the GPW method, focuses on solving three problems: (1) Reducing the computational time of GA required when it is searching for the best global solution; (2) Preventing the Powell method (PM) method to fall into a local solution while performing image registration; (3) Providing the necessary image pre-processing steps for enhanced feature analysis of FDG_CT and FLT_CT images. After registration, the location of the cancerous lesions on the liver could be observed directly on the FLT_CT image. When registering wavelet decomposed
31
images, the GA is used for determining the maximal value of the NMI between a reference image and a moving image, while the Powell method (PM) is implemented in search for the best solution starting from an initial set of registration points.
3.2 Related Work
Computed Tomography (CT) continues to yield a significant impact on medical research and remain one of the viable imaging modality for diagnosis [46]. Combining the complementary strengths of two proven tracers FDG and FLT is an effective way to improve diagnosis, overcoming their inherent limitations when used separately.
As indicated earlier, image registration is a subtle and yet complex task that often require several steps that include image pre-processing, use of affine transformations, interpolation, similarity metrics, and optimization [47]. This involves a thorough assessment of the feature space, determining what similarity metrics should be used to gauge the mutual information and frame a search strategy that will optimize the registration process in terms of both accuracy and computational simplicity.
An overview of different image registration methods reveals that significant progress remains to be made towards a more effective solution to registration [48]. William M. Wells III et al. proposed a registration method that was achieved by adjusting the relative position and orientation until the mutual information between the images is maximized [49]. Lisa Tang and her colleagues offer a registration method that was focused on optimizing the mutual information [50]. X. F. Wang et al. use a genetic-based image
32
registration method [51]. X. G. Du et al. propose instead a multi-modal medical image registration method based on the gradient of mutual information and hybrid genetic algorithm [52]. X. Du et al. describe a multi-resolution image registration method based on the so-called firefly algorithm and Powell method [53].
Genetic algorithms [51, 52] and Powell method (PM) [53, 54] remain the most popular optimization methods applied to mutual information-based medical image registration. Genetic algorithms are often used when seeking the best global solution within the whole range, which may result in heavy computational requirements; while the Powell method is good at determining a local solution with reduced computational load but where the solution sought might not be optimal.
In order to take the advantage of both GA and PM, an automatic registration method combining the strength of each, augmented with wavelet decomposition (GPW) is proposed in this Chapter, considered as the main contribution of this dissertation.
3.3 Methods
3.3.1 Image Pre-processing Methods
The image preprocessing steps assumed throughout this chapter can be summarized as outlined in Fig. 3.1. These pre-processing steps include image normalization, median filtering, Laplacian shaping, and histogram enhancement. Assume the pixel value at point (x, y) to be p(x, y), and where min[p(x, y)] and max[p(x, y)] are the minimum and
33
maximum of p(x, y), respectively, then expression {p(x, y) - min [p(x, y)]}/{ max[p(x, y)] - min[p(x, y)]} is used to normalize the original image. Median filtering is performed on the image using the default 3-by-3 neighborhood mask, to remove isolated or spurious noise points. Laplacian shaping removes the low-frequency components while keeping the high-frequency components in the Fourier domain. The edges thus become much more recognizable than in the original image. Histogram enhancement is applied to the Laplacian sharpened images in order to observe more details if needed. Fig. 3.2 shows the results of the pre-processing steps.
Fig. 3.1 Pre-processing steps Images→Normalization→Median filtering
→Laplacian shaping→Histogram enhancement→Pre-processed images
34
35 3.3.2 The procedures of GPW Method
The flow diagram of the GPW structure is shown in Fig.3.3. FDG_CT and FLT_CT are pre-processed as 512* 512 images.
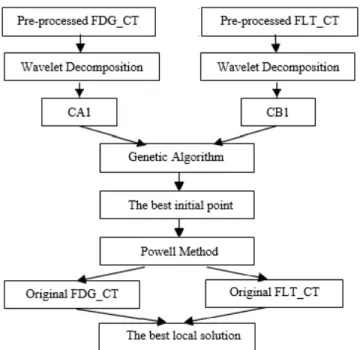
Fig. 3.3 The GPW integrated structure
First, the wavelet method is applied to both images, yielding two decomposed 256*256 images (CA1 and CB1). CA1 and CB1 are the low-frequency parts of FDG_CT and FLT_CT, respectively. The processing time was thus reduced significantly since the size of the images is decreased by half both dimensions from 512*512 to 256*256.
Second, the GA is used to search for the best global solution in the registration process and is applied only on the 256*256 CA1 and CB1, which are smaller than the pre-processed FDG_CT and FLT_CT images. Furthermore, to save time, the size of the
36
image could be further decomposed several times depending on the requirements and the application at hand.
Thirdly, the best global solution found by the GA is fed as an initial solution (point) to the Powell method (PM), which is applied to register the original 512*512 FDG_CT and FLT_CT images. Setting the initial point properly is very important when using PM; with the initial point being the global best here, searching near this point, PM could find the best local solution quickly.
The GA and PM algorithms are applied to the original FDG_CT images as described in Fig. 3.4 and Fig. 3.5.
Fig. 3.4 Registration with GA optimization
Fig. 3.5 Registration with PM optimization 3.4 Experiments
3.4.1 Performance Verification of the Powell Method (PM)
To verify that the Powell method has worked properly, the following experiments were conducted: Slice No. 93 (512*512) of FDG_CT used as the reference image, and its
37
rotated version by 90 degrees anti-clockwise serves as the moving image that is going to be registered to the reference image. The initial point of Powell method was set randomly, and the experiment was repeated 10 times with the results as shown in Table 3.1.
Table 3.1 Registration results of PM # (pixels) X Y (pixels) Angle (degrees) NMI MI T
(seconds) Local Global 1 -2.00 -3.4 -90.0 0.999 4.569 341 0 1 2 -2.85 -0.7 -89.7 0.186 0.850 549 1 0 3 0.25 0 -349.8 0.098 0.449 5783 1 0 4 -2.00 0 -90.0 0.999 4.568 423 0 1 5 -2.00 0 -90.0 0.999 4.569 321 0 1 6 -2.00 0 -90.0 0.997 4.559 423 0 1 7 -2.00 0 -90.0 0.999 4.566 519 0 1 8 -2.00 0 -90.0 0.997 4.559 437 0 1 9 -2.00 0 -90.0 0.999 4.566 541 0 1 10 -2.00 0 -90.0 0.997 4.559 438 0 1
According to the results of Table 3.1, experiment #1, and #4 to #10 achieved a normalized mutual information higher than 0.99, which means the registration is correct above 99%, which is the near perfect results that were expected at this point. And the average computational time is thus far 431 seconds for one slice. If the total slice number is 186, the approximate total computational time will be close to 22 hours. So PM did find the global best solution in those eight experiments. But in experiment #2 and #3, PM
38
fell into the local best solution. Thus, the success rate of registration using PM optimization is 80% (8 out 10) in this set of experiments.
This outcome highlights the importance of the initial point when applying the PM, as there are possibilities for failure, as was the case in experiments #2 and #3. Assuming setting the initial point right at or close to the global best point, PM may on the other lead to the right solution and faster. Since the GA is good at finding the best global solution, GA is assumed to optimize the search for a solution first, and then passing this best global point to the PM as the initial point.
Fig. 3.6 Registration results of experiment # 1 using PM
Fig. 3.6 shows the registration results of experiment #1: reference image (FDG_CT), moving image (90 degrees anti-clockwise FDG_CT), and the fusion of images before and after registration. For visual convenience, the reference image was put into the red