Durham Research Online
Deposited in DRO:31 July 2018
Version of attached le: Accepted Version
Peer-review status of attached le: Peer-reviewed
Citation for published item:
Shi, Lei and Cristea, A. I. (2015) 'Learners thrive when using multifaceted open social learner models.', IEEE MultiMedia., 23 (1). pp. 36-47.
Further information on publisher's website: http://dx.doi.org/10.1109/MMUL.2015.93
Publisher's copyright statement:
c
2015 IEEE. Personal use of this material is permitted. Permission from IEEE must be obtained for all other uses, in
any current or future media, including reprinting/republishing this material for advertising or promotional purposes, creating new collective works, for resale or redistribution to servers or lists, or reuse of any copyrighted component of this work in other works.
Use policy
The full-text may be used and/or reproduced, and given to third parties in any format or medium, without prior permission or charge, for personal research or study, educational, or not-for-prot purposes provided that:
• a full bibliographic reference is made to the original source • alinkis made to the metadata record in DRO
• the full-text is not changed in any way
The full-text must not be sold in any format or medium without the formal permission of the copyright holders. Please consult thefull DRO policyfor further details.
Durham University Library, Stockton Road, Durham DH1 3LY, United Kingdom Tel : +44 (0)191 334 3042 | Fax : +44 (0)191 334 2971
Original citation:
Shi, Lei (Researcher in Computer Science) and Cristea, Alexandra I.. (2016) Simplifying is not always best : learners thrive when using multifaceted open social learner models. IEEE MultiMedia , 23 (1). pp. 36-47.
Permanent WRAP url:
http://wrap.warwick.ac.uk/75813 Copyright and reuse:
The Warwick Research Archive Portal (WRAP) makes this work by researchers of the University of Warwick available open access under the following conditions. Copyright © and all moral rights to the version of the paper presented here belong to the individual author(s) and/or other copyright owners. To the extent reasonable and practicable the material made available in WRAP has been checked for eligibility before being made available.
Copies of full items can be used for personal research or study, educational, or not-for profit purposes without prior permission or charge. Provided that the authors, title and full bibliographic details are credited, a hyperlink and/or URL is given for the original metadata page and the content is not changed in any way.
Publisher’s statement:
“© 2016 IEEE. Personal use of this material is permitted. Permission from IEEE must be obtained for all other uses, in any current or future media, including reprinting
/republishing this material for advertising or promotional purposes, creating new collective works, for resale or redistribution to servers or lists, or reuse of any copyrighted component of this work in other works.”
A note on versions:
The version presented here may differ from the published version or, version of record, if you wish to cite this item you are advised to consult the publisher’s version. Please see the ‘permanent WRAP url’ above for details on accessing the published version and note that access may require a subscription.
Simplifying Is Not Always Best: Learners Thrive When Using
Multifaceted Open Social Learner Models
Lei Shi and Alexandra I. Cristea
Department of Computer Science, The University of Warwick
Abstract
This paper explores open social learner modeling (OSLM) – a social extension of open learner modeling (OLM). A specific implementation of this approach is presented, by which learners’ self-direction and self-determination in a social e-learning context could be potentially promoted. The proposed new approach, multifaceted-OSLM, allows, unlike in previous work, to seamlessly and adaptively embed visualization of both a learner’s own model and other learning peers’ models, into different parts of the learning content, for multiple axes of context, at any time during the learning process. It also demonstrates advantages of visualizing both learners’ performance and their contribution to a learning community. An experimental study showed that, contradictory to previous research, the richness and complexity of this new approach impacted positively on the learning experience, in terms of effectiveness, efficiency and satisfaction perceived by the learners.
1
Introduction
Social e-learning has been recently brought to the fore, impacting on people’s lives via formal and informal learning channels [1]. It is rooted in the social constructivist learning theory [2], which proposes that learners can acquire new knowledge through social interactions with peers. However, successful social e-learning requires novel tools to assist learners [3], especially with the rise of the Massive Open Online Courses (MOOCs) that provide a great variety of learning materials and diverse connections and interactions.
Adaptive Educational Hypermedia Systems (AEHSs) have a built-in component of learner modeling that maintains and updates information on each learner. Systems can thus adapt to individual learners, hereby reducing their cognitive burden, such as that caused by the variety of accessible resources. Traditionally, learner models were only used internally by the system, whilst recent studies argue in favor of exposing learner models to the learners. This approach, coined as Open Learner Modeling (OLM) [4], makes it possible for learners to observe their own progress, which can potentially promote metacognition, such as self-reflection, self-direction and transparency [2]. To diminish the impact of isolation in e-learning, more recent studies propose to allow learners to observe peer models and group models [5]. This new social OLM approach, called Open Social Learner Modeling (OSLM), benefits from both metacognitive and social aspects of learning [6].
This study furthers this research direction, by:
Building on the younger generation learners’ familiarity with Social Web techniques and online games, and their ability to navigate with ease in complex social spaces;
Combining the visualization of learner performance with contributions to a learning community; Adapting the visualization of the OSLM itself to the context of the learner;
Introducing and studying multiple axes of visualization context: hierarchical, based on the structure of the course; topical, based on the topics studied; social, based on the learner interactions and contributions;
Building a complex and rich OSLM, based on the principles above and evaluating it in two real-life case studies, in terms of effectiveness, efficiency and satisfaction, perceived by the learners.
In particular, this study explores multifaceted Open Social Learner Models (multifaceted-OSLM) in a social personalized adaptive e-learning system, and targets the following main research questions:
“What social and personal features should be provided to learners via open social learner modeling, and what interactive visualization thereof, in order to enhance social e-learning systems, and thus ensure a high level of effectiveness, efficiency and satisfaction perceived by the learners?”
In the following, firstly, section 2 reviews related work, focusing on limitations of existing studies and comparisons to the study presented in this article. Next, section 3 describes the new open learner modeling approach – Multifaceted Open Social Learner Modeling (Multifaceted-OSLM). Section 4 reports the evaluation procedure and results, followed by section 5 that discusses the findings and future research, and section 6, which concludes.
2
Related Work
2.1 Social E-Learning Context
Nowadays’ learners – especially the younger generations – are familiar with Social Web techniques embedded in their daily lives, having high abilities to use, navigate and function in social spaces [7]. These learners have different patterns of
attention and learning preferences. The ability of a system to cater for these preferences is crucial to improve user experience, such as providing an e-learning system that is user-friendly, engaging and efficient [3]. Traditional e-learning approaches thus should be adapted to the needs of this new ‘Social Web generation’, offering support for social learning. To date, many works have successfully used of Social Web techniques in educational settings, as summarized in a comprehensive review [1]. Principles for designing social experience, such as identity, connectedness and communication, are conforming to modern learning theories, such as connectivism and constructivism [2] – the learning process needs to be constructed by collaborative efforts of individual learners in groups [5]. Furthermore, in the social e-learning context, learners can be both content
consumers and producers [8]. They often produce content in a collaborative and competitive manner. For example, a question asked by one learner may trigger answers from other learners. Learners can discuss and rate these answers, in order to find the best one. This is in line with contribution-based pedagogies and competitive learning theories [9].
However, this area is not enough studied; such as to explore how popular Social Web techniques can be directly applied to help learners to create and maintain their own personal learning systems in a collaborative and interactive social e-learning context. Moreover, most experimental results reported focus on a single Social Web technique, whereas a combination of these techniques could be more adequate for learning scenarios. Therefore, this study seeks a more comprehensive approach to combine various Social Web techniques and utilize the combination directly in social e-learning systems. More detailed rationales regarding to the social perspective of the proposed approach are presented in Section 3.
2.2 Open Learner Model Approaches
Learner models refer to models of learners’ knowledge and other characteristics such as needs, goals, interests, preferences and learning styles. They are constructed from direct input or implicit observation of learning activities, and updated according to the learners’ current understanding of the target learning contents. Open Learner Modeling (OLM) [4] can support learners’ reflection on their own and their peers’ learning processes, and explain the reasons for getting a recommendation on what to do next and how to do it [10]. OLMs have been implemented using various modeling approaches, and their educational benefits are thoroughly discussed in the literature, such as raising learners’ self-awareness and possible self-regulation of the learning process [11]. Open Social Learner Modeling (OSLM) further allows fostering diversification of learner modeling, richer visualization and interaction of learner models [4], and accumulating a variety of theories and techniques to build e-learning systems with personalized, adaptive and social mechanisms. Below are a few more recent studies related to this work.
IntrospectiveViews [12] provides parallel views on models of a learner and their peers. Learners can compare their learning progress (completed, partially completed, pending, following) with either another peer’s learning progress or the average progress of the entire learning group. However, the comparisons have limited-level granularity representation of learning contents. QuizMap [13] has a 4-level hierarchical representation of a tree-map, and each level clusters different levels of information in detail (from entire class’s performance to individual’s performance on a single question). Learners can also observe their own performance, in comparison with the rest of the class. However, it cannot fit larger classes that generate too many cells. ProgressiveZoom [6] is built upon the Google-Maps paradigm, seeking to address information overload issues, by enabling learners to zoom in or out in a multi-layer fashion. However, it has limited ability to control comparisons between learners. Progressor+ [14] is visualizing sequence, identity, interactivity information and comparison, motivating thus the students to spend more time in learning with it. However, the visualization is relatively simple and the features are somewhat limited.
2.3 Other Related Researches
A cross-disciplinary work as the one presented here touches many areas. Whilst the two sections above describe both the main inspiration sources and some of the main competitors, this work also finds inspiration in the vast and quickly growing area of gamification [15] and learner analytics [16]. From gamification the implementation inherits mechanisms such as fast response time, emphasis on the visualization, competitions. From learner analytics the visualization uses various ways of user data gathering and analyzing, before visualization. These tools help in addressing the limitations as identified above.
Thus, we propose the new multifaceted-OSLM approach, which is seamlessly integrated at all granularity levels of learning contents; i.e., at course level, topic level, resource level, etc. This addresses the limited-level granularity learning content representations in IntrospectiveViews, and the concern of too crowded user interface in QuizMap. Moreover, the
multifaceted-OSLM allows a learner to compare to individuals and groups, unlike in Progressive Zoom. Additionally, unlike those approaches, multifaceted-OSLM is built with a Facebook-like and popular game-like visualization, which potentially makes functionalities easier to use by nowadays’ learners.
3
Multifaceted-OSLM
3.1 Multifaceted-OSLM RationaleThe proposed new OSLM approach is called “multifaceted”, as learners can access their model and their peers’ models
ubiquitously, and the system can adapt visualizations to fit various contexts, corresponding to a classic hierarchy: course,
topic, resource and profile pages. This aims to address limitations of existing approaches, as discussed in Section 2. For example, in our approach, when viewing a learning content page, the multifaceted-OSLM interface adapts to it, so that the presentation of and comparison between learner models is in the context of this current learning content. This approach provides a finer, context-based granularity of the learner model visualization, as well as reduces the learner’s burden, as this process is automatic and doesn’t require manually selecting through many criteria for adjusting the visualization. Besides, this approach provides various comparison modes, such as comparison between individuals and comparison to a certain learner group, or all other learners. These modes of multi-context and multi-cohort comparisons might lead to a greater engagement of learners, by arousing their competitive instincts, and thereby capturing their interest and increasing motivation, satisfaction and fun [9]. Importantly, this approach aims at introducing multiple functionalities without
overwhelming users, instead of just opting for simplification, as in prior research [15].
Additionally, this approach visually displays to learners both performance and contribution, reflecting not only a learner’s
role as a knowledge consumer, but also that of a knowledge producer, which could better integrate in the Social Web era. 3.2 Visualization Type
In the following, we briefly introduce five main visualization types of the multifaceted-OSLM interface.
a) Performance Visualization
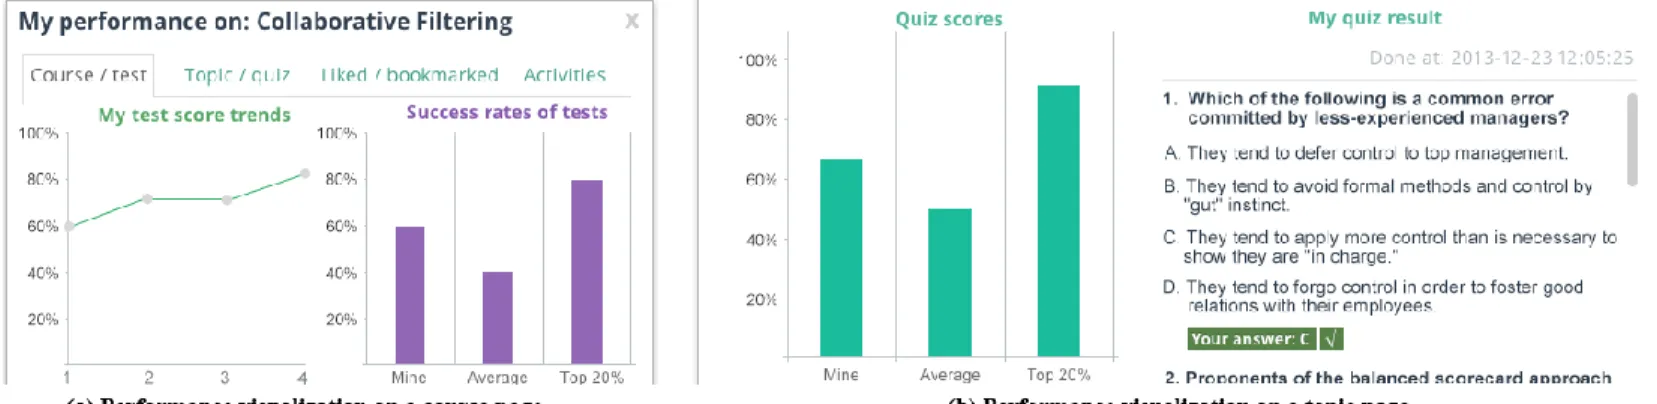
Performance visualization is included as one of the important albeit more common features in existing OSLM approaches (e.g. [13]), which may promote motivation [12]. Our approach additionally introduces a less frequently appearing feature, the timeline, by presenting e.g. test score trends, and, importantly, comparison features; e.g., comparison of test success rates between learners. Figure 1 shows examples of performance visualization for tests, which include (a) a time chart and (b) quizzes. Both exemplify also comparisons between the current learner, the top 20% learners and the whole class. Although these two examples (the former in a course page; the latter in a topic page) show the performance visualization in different formats, both visualizations are triggered by clicking on the same button, ‘My Performance’, located in the same place on the webpage. This exemplifies mechanisms introduced to reduce the learners’ burden (section 3.1).
Figure 1 Performance Visualization
b) Contribution Visualization
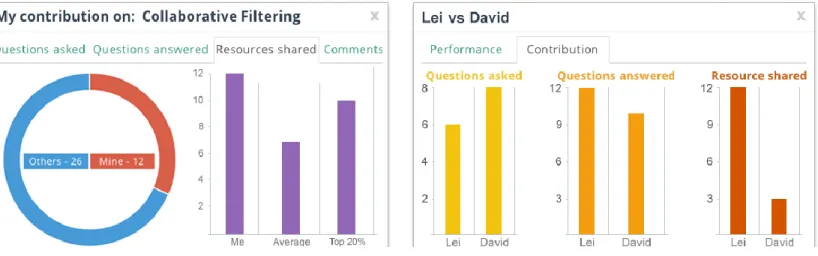
In social e-learning systems, learners move beyond passive recipients, and can also be authors of learning contents. They contribute by, e.g., sharing, commenting, asking and answering (Figure 2 (a)). Here we support the notion that visualization of learners’ contribution potentially encourages contributing more, being a more active member of the learning community, as seeing each other’s contribution may stimulate imitation, collaboration or competition.
Figure 2 Contribution Visualization
c) Comparison Visualization
This approach visualizes a direct comparison of performance or contribution between the current learner, and the profile page’s owner. For example, Figure 2 (b) compares the contribution of Lei, the current learner, to David, another learner.
Contributions include the number of questions asked and answered, and resources shared. Performances include correct tests, topic completion rates, and the number of shared resources “liked” or bookmarked by others. Comparison visualization is implemented based on the competition-based learning theory and gamification [15], which can generate benefits: such as the increase in performance, enjoyment and motivation [9]. This is also built upon the younger generation learners’ familiarity with online games, where they are used to compete against each other on a one-to-one basis, via avatars. Note, however, that privacy concerns that are raised by the disclosure of the learner model to others are not the main purpose of this study, and hence not directly addressed.
d) Learning Path Visualization
A learning path is visualized as a hierarchical tree, representing the whole course structure and the learner’s progress. Figure 3 (a) shows structured topics within the course: a hollow circle shows that the learner has not learnt this topic; a solid circle shows that the learner has learnt this topic; an unlocked lock shows that the learner is ready to learn this topic; a locked lock shows that the learner should finish learning all the prerequisite topics before starting to learn this topic; and the
highlighted text “Up next” recommends to the learner the next most appropriate topic to learn. This allows a learner to have
an overview of the course learning progress, and recommends the next step to do. This is made possible by combining content-based recommendation and learner modeling. Different from most existing approaches, where learners can only access recommended and previously seen material, our approach allows accessing locked topics. However, a confirmation-request-step lowers the possibility of inadvertently accessing inappropriate topics, whilst improving the adaptability, controllability and accessibility of the system.
e) Learning Activity Visualization
The proposed approach exposes learners to their activity logs, as in [16], but it adds a social layer, where learners can “like” or comment-on each other’s activity logs. This feature is designed based on our expectation that observation of activity logs of learners and their peers’ can stimulate interactions, hereby improving learners’ engagement. Furthermore, based on one of our design principles of allowing multiple ways of access to functionality, the system provides two ways of viewing learners’ activity logs. One is on the main system page (Figure 3 (b)), where a learner can filter to view her own activity logs or to view all learners’ activity logs; the other is on a learner profile page, where a learner can view the profile owner’s activity logs, including her own, to allow various paths to information. As visualization principle, as evident in Figure 3(b), we use a Facebook-like appearance, on the basis that this will build on the younger generation learners’ familiarity with Social Web techniques.
3.3 Use Case
In the following, a use case demonstrates how a learner could use various multifaceted-OSLM functionalities. This is to point out in practice the merits of the proposed multifaceted-OSLM approach.
John is a postgraduate student, studying a course on ‘collaborative filtering’, as an online option at the university. He has learnt 16 out of 20 (80%) topics in the course, using the system. He is taking a break and browsing randomly through the system. He arrives on the course page. He clicks on the button ‘My Performance’, and a pop-up view shows. He then clicks on the tab ‘Topic/quiz’, which shows the ‘topic completion rates’ comparison between him, all the students and the top 20% students. He realizes that his topic completion rate (80%) is higher than the average (65%), but lower than the top 20% (90%). As such, he believes he can reach the top 20% students, and decides thus to start learning a new topic. Therefore, he clicks on the button ‘Learning path’. He finds 4 new topic left to study, and 2 of them are unlocked. Although the system recommends the topic ‘evaluation of accuracy’ to study next, he is more interested in the locked topic ‘social navigation’. Clicking on this topic title, the system reminds him that this topic is locked and asks confirmation to start studying. He clicks on the button ‘Yes’. Thereafter, he is directed to this topic page. After reading a few resources shared here by other students, he notices that one student, Emilia, shares most of them. He is curious about Emilia’s learning progress, so he clicks on her avatar. The system presents a pop-up view with options to send a message to Emilia or go to her profile page. John chooses the latter. Now he is on Emilia’s profile page, which lists what she has done so far, such as questions recently asked, a list of resources recently shared, a list of topics she is currently learning. John clicks on the button ‘vs’, and then a pop-up view shows. He can see the comparisons of their performance including tests, contributions and comments. Indeed, Emilia has shared many resources, and she has also asked many questions. John closes this pop-up view and goes to Emilia’s question list. A question asking about ‘collaborative filtering in the Python implementation’ is at the top of the list, as it received the most ‘likes’ and ‘bookmarks’. John reads several answers from other students and then writes down his answer.
4
Experimental Study
4.1 MethodologyIn order to evaluate the proposed multifaceted-OSLM approach, this study, containing two experiments, was performed during two real-life university courses, with university students, the target users. The first experiment was conducted at the University of Warwick, UK, where 15 postgraduates were learning a course on ‘Collaborative Filtering’ using Topolor 2. The experiment included 4 stages:
Two time-controlled 1-hour learning stages (students sat in a classroom);
One flexible (non-time-controlled) learning stage (students accessed Topolor 2 at their preferred time and location); The survey stage (coordinator-led optional questionnaire answering, functionality by functionality, to make sure
students understood clearly which question referred to which functionality).
Students were explicitly told that their participation in the survey had no impact on course results. 10 of them submitted questionnaires.
The second experiment was conducted at the Department of Economics, Sarajevo School of Science and Technology, Bosnia and Herzegovina, where 20 undergraduates, 2 observers and 1 course instructor participated in the 1.5-hour online learning session – using Topolor 2 to teach/learn a course on ‘Control (management)’. After the online learning session, students were encouraged to further use Topolor 2 to revise the learning materials, for 2 weeks (allowing for a longitudinal study). Then, students were asked to complete an optional online survey. 15 students completed the same online survey as in the first experiment.
In total, 25 questionnaires were collected from the 2 experiments. Section 5 further discusses the reason for conducting 2 separate experiments, and issues possibly raised by the data collating process. It also explains that the evaluation with this number of test persons is to be seen as qualitative, showing tendencies.
Traditionally, e-learning system evaluation relies mainly on accuracy of content recommendation and learners’ performance; e.g., test scores. Thus, the perceived learning impact was evaluated (section 0). However, over the years, researchers have reached a consensus on the necessity of taking into consideration cognitive aspects, such as learners’ perception of the system usage, including effectiveness, efficiency and satisfaction. ISO 9241-111 defines effectiveness as “the accuracy and completeness with which specified users can achieve specified goals in particular environments”; efficiency as “the resources expended in relation to the accuracy and completeness of goals achieved”; and satisfaction as “the comfort and acceptability of the work system to its users and other people affected by its use”.
This work evaluates:
learners’ perceived effectiveness, by asking if the multifaceted-OSLM functionalities were useful (for their goals), and
perceivedefficiency by asking if the functionalities were easy to use (effort required) (section 4.2). Regarding the evaluation of satisfaction, learners were asked to score a set of statements (section 0).
To establish what functionalities should be provided, it is important to evaluate them from both the point of view of their perceived usefulness and ease of use, as this comparison allows for determining if a certain functionality is important, needs a better implementation, or should be removed.
4.2 Effectiveness and Efficiency
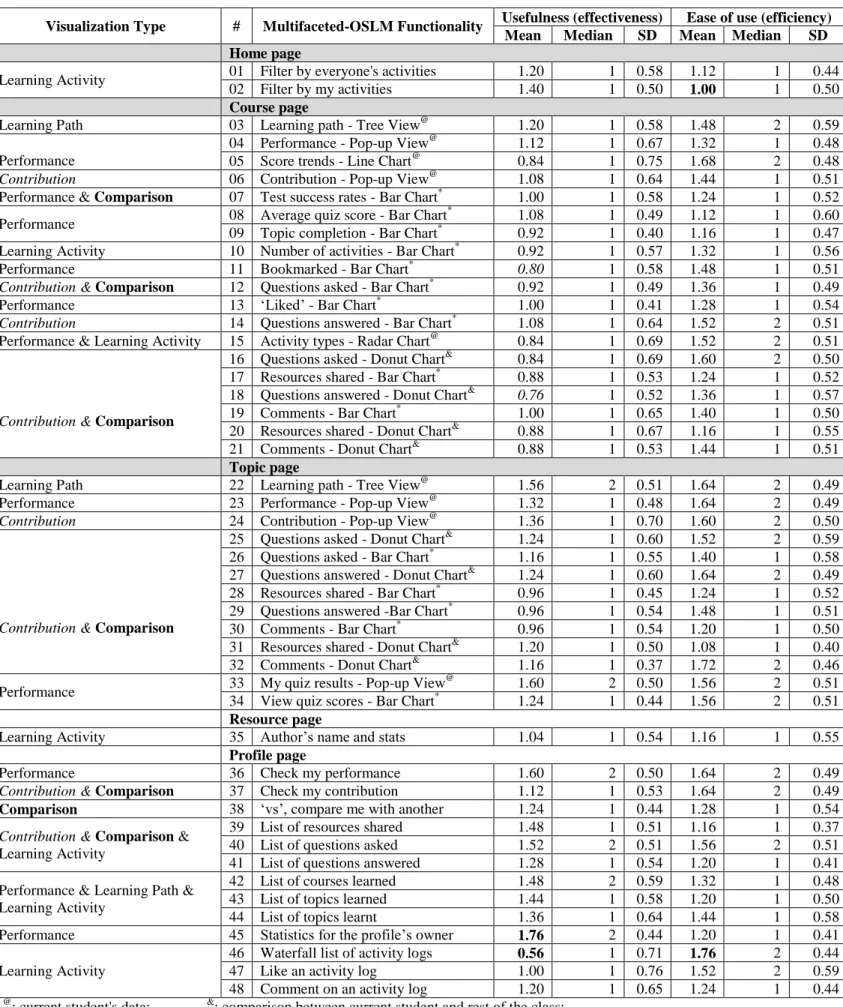
48 multifaceted-OSLMfunctionalities (Table 1) were individually evaluated, on a 5-point Likert scale, ranging from -2 (very useless/hard to use) to 2 (very useful/easy to use). In the table, these functionalities are grouped based on the different axes of context, and based on the visualization types. Table 1 also shows the results including means, medians and standard deviations (SD).
The results indicate that the proposed multifaceted-OSLM approach positively impacts upon learners perceived effectiveness – one of the objectives of the approach (see section 4.1) – as all the meansare greater than the neutral response (0), ranging between 0.56-1.76, with mediansbetween 1-2, and SD between 0.37-0.76.
Similarly, the approach is perceived as leading to an even higher degree of efficiency (see section 4.1), with means between 1.70-1.76, medians between 1-2, and SD between 0.37-0.60. This is encouraging, as it could further support our hypothesis that using a Facebook-like appearance and a game-inspired paradigm can quickly transform learners into expert users of the system.
Moreover, the results are reliable, as indicated by Cronbach’s Alpha for usefulness and ease of use of 0.85 and 0.8, respectively, both ≥0.8.
In analyzing the extreme means, results show that functionality 45 “statistics for the profile’s owner” received the highest
usefulness mean. This indicates learners being very interested in seeing overviews of their own activities, and comparing them to their peers’. This possibly indicates the success of our approach that exposes learner data and supports various comparisons. Interestingly, functionality 46 “waterfall list of activity logs” received the highest ease of use mean, but the lowest (whilst still high) usefulness mean, suggesting this functionality may need removed or improved. For example, a future system could also suggest further actions that learners can perform, to increase usefulness. Similarly, a moderate mean was received by functionality 18 “questions answered”, which indicates students possibly needing more encouragement to
help their peers by answering their questions. Longitudinal follow-up studies are planned to clarify this. Students were also not enthusiastic about functionality 11 “bookmarked”. Here we believe it is possible that they didn’t directly see the benefit of
Table 1 Multifaceted-OSLM Functionalities and Evaluation Results
Visualization Type # Multifaceted-OSLM Functionality Usefulness (effectiveness) Ease of use (efficiency)
Mean Median SD Mean Median SD
Home page
Learning Activity 01 Filter by everyone's activities 1.20 1 0.58 1.12 1 0.44
02 Filter by my activities 1.40 1 0.50 1.00 1 0.50
Course page
Learning Path 03 Learning path - Tree View@ 1.20 1 0.58 1.48 2 0.59
Performance
04 Performance - Pop-up View@ 1.12 1 0.67 1.32 1 0.48
05 Score trends - Line Chart@ 0.84 1 0.75 1.68 2 0.48
Contribution 06 Contribution - Pop-up View@ 1.08 1 0.64 1.44 1 0.51
Performance & Comparison 07 Test success rates - Bar Chart* 1.00 1 0.58 1.24 1 0.52
Performance 08 Average quiz score - Bar Chart
* 1.08 1 0.49 1.12 1 0.60
09 Topic completion - Bar Chart* 0.92 1 0.40 1.16 1 0.47
Learning Activity 10 Number of activities - Bar Chart* 0.92 1 0.57 1.32 1 0.56
Performance 11 Bookmarked - Bar Chart* 0.80 1 0.58 1.48 1 0.51
Contribution & Comparison 12 Questions asked - Bar Chart* 0.92 1 0.49 1.36 1 0.49
Performance 13 ‘Liked’ - Bar Chart* 1.00 1 0.41 1.28 1 0.54
Contribution 14 Questions answered - Bar Chart* 1.08 1 0.64 1.52 2 0.51
Performance & Learning Activity 15 Activity types - Radar Chart@ 0.84 1 0.69 1.52 2 0.51
Contribution & Comparison
16 Questions asked - Donut Chart& 0.84 1 0.69 1.60 2 0.50
17 Resources shared - Bar Chart* 0.88 1 0.53 1.24 1 0.52
18 Questions answered - Donut Chart& 0.76 1 0.52 1.36 1 0.57
19 Comments - Bar Chart* 1.00 1 0.65 1.40 1 0.50
20 Resources shared - Donut Chart& 0.88 1 0.67 1.16 1 0.55
21 Comments - Donut Chart& 0.88 1 0.53 1.44 1 0.51
Topic page
Learning Path 22 Learning path - Tree View@ 1.56 2 0.51 1.64 2 0.49
Performance 23 Performance - Pop-up View@ 1.32 1 0.48 1.64 2 0.49
Contribution 24 Contribution - Pop-up View@ 1.36 1 0.70 1.60 2 0.50
Contribution & Comparison
25 Questions asked - Donut Chart& 1.24 1 0.60 1.52 2 0.59
26 Questions asked - Bar Chart* 1.16 1 0.55 1.40 1 0.58
27 Questions answered - Donut Chart& 1.24 1 0.60 1.64 2 0.49
28 Resources shared - Bar Chart* 0.96 1 0.45 1.24 1 0.52
29 Questions answered -Bar Chart* 0.96 1 0.54 1.48 1 0.51
30 Comments - Bar Chart* 0.96 1 0.54 1.20 1 0.50
31 Resources shared - Donut Chart& 1.20 1 0.50 1.08 1 0.40
32 Comments - Donut Chart& 1.16 1 0.37 1.72 2 0.46
Performance 33 My quiz results - Pop-up View
@ 1.60 2 0.50 1.56 2 0.51
34 View quiz scores - Bar Chart* 1.24 1 0.44 1.56 2 0.51
Resource page
Learning Activity 35 Author’s name and stats 1.04 1 0.54 1.16 1 0.55
Profile page
Performance 36 Check my performance 1.60 2 0.50 1.64 2 0.49
Contribution & Comparison 37 Check my contribution 1.12 1 0.53 1.64 2 0.49
Comparison 38 ‘vs’, compare me with another 1.24 1 0.44 1.28 1 0.54
Contribution & Comparison & Learning Activity
39 List of resources shared 1.48 1 0.51 1.16 1 0.37
40 List of questions asked 1.52 2 0.51 1.56 2 0.51
41 List of questions answered 1.28 1 0.54 1.20 1 0.41
Performance & Learning Path & Learning Activity
42 List of courses learned 1.48 2 0.59 1.32 1 0.48
43 List of topics learned 1.44 1 0.58 1.20 1 0.50
44 List of topics learnt 1.36 1 0.64 1.44 1 0.58
Performance 45 Statistics for the profile’s owner 1.76 2 0.44 1.20 1 0.41
Learning Activity
46 Waterfall list of activity logs 0.56 1 0.71 1.76 2 0.44
47 Like an activity log 1.00 1 0.76 1.52 2 0.59
48 Comment on an activity log 1.20 1 0.65 1.24 1 0.44
@: current student's data; &: comparison between current student and rest of the class; *: comparison between current student, the whole class and the top 20% of the class.
Table 2 aggregates the results per visualization type, as described in section 3.2. The averages in this table are computed as mean of all Multi-faceted-OSLM functionalities created for that particular type of visualization, as shown in the first two columns in Table 1.
Table 2 Results per Visualization Type
Visualization Type Usefulness (effectiveness) Ease of use (efficiency)
Mean Median SD Mean Median SD
Performance 1.21 1.18 0.31 1.40 1.44 0.18
Contribution 1.09 1.08 0.21 1.40 1.40 0.18
Comparison 1.08 1.00 0.21 1.38 1.38 0.18
Learning path 1.41 1.44 0.14 1.42 1.44 0.17
Learning activity 1.19 1.24 0.29 1.32 1.28 0.21
Table 2 shows in a more compact way that, whilst both usefulness and ease of use categories were highly rated, the tool’s
ease of use, for all visualization types, is higher. This specifically supports our visualization approach. From the usefulness point of view, the learning path visualization was most appreciated – possibly as it is the most well known. Learners also liked knowing about their own performance and that of others, showing that the openness of the learner model, together with its visualization techniques, was highly regarded. Contribution and comparison, whilst considered very usable, were considered only moderately useful. As these are very novel features, some initial reluctance in the acceptance is to be expected. Having passed the very hard and important hurdle of the usability, it is clear that more work is needed, to estimate better ways in which to analyze these functionalities in depth. Our planned longitudinal studies can bring more insight, as it is very likely that the usefulness of peer interactions is only evident in longer-term use (due to known issues, e.g., the cold start
problem). Such studies will show if more or different motivational elements are needed, to induce peers to more often contribute – whilst still keeping in place or extending mechanisms of quality of contribution check. From the point of view of this study, it is very relevant that the complexity of the functionality offered – one of the major issues in any new systems, and especially in e-learning systems – could be balanced with good visualization techniques based on familiar paradigms, which opens up avenues for further research focusing on optimizing the functionality.
4.3 Satisfaction and Learning Impact
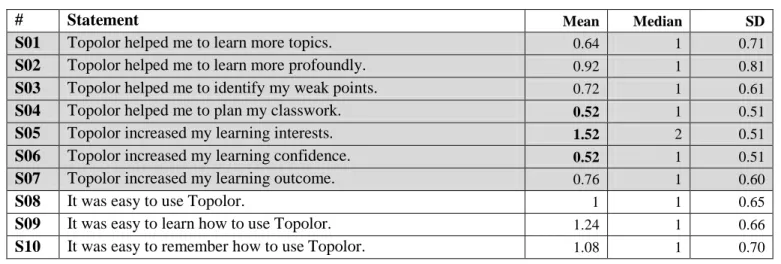
Table 3 shows 16 statements designed to evaluate learners’ satisfaction (S01-S16) and in particular, perceived learning impact (S01-S07). These statements were measured on a 5-point Likert scale ranging from -2 (strongly disagree) to 2 (strongly agree). Table 3 also shows the results: the means are greater than the neutral response (0) ranging between 0.52-1.52, mediansbetween 1-2, with standard deviations (SD) between 0.51-0.81. Additionally, Cronbach's alpha of 0.80 (≥0.8) indicates a ‘good’ level of reliability.
These results indicate that the learners were generally satisfied with the multifaceted-OSLM functionalities, and that the
perceived learning impact was positive, even very high in some areas. For instance, statement S05 “Topolor increased my learning interests” received the highest mean (1.52). This is encouraging, as motivating the new generation of learners was an
important aspect of our approach. Nevertheless, statements S04 “Topolor helped me to plan my classwork” and S06 “Topolor increased my learning confidence” received the lowest (whilst still high) score. These results suggested further enhancement
of the approach. For example, in the future, we could allow learners to manipulate their classwork plan based on system recommendations.
Table 3 Statements in the satisfaction questionnaire and the results
# Statement Mean Median SD
S01 Topolor helped me to learn more topics. 0.64 1 0.71
S02 Topolor helped me to learn more profoundly. 0.92 1 0.81
S03 Topolor helped me to identify my weak points. 0.72 1 0.61
S04 Topolor helped me to plan my classwork. 0.52 1 0.51
S05 Topolor increased my learning interests. 1.52 2 0.51
S06 Topolor increased my learning confidence. 0.52 1 0.51
S07 Topolor increased my learning outcome. 0.76 1 0.60
S08 It was easy to use Topolor. 1 1 0.65
S11 It was easy to discuss with the peers. 0.80 1 0.58
S12 It was easy to share content with peers. 1 1 0.58
S13 It was easy to access the content shared by peers. 1 1 0.50
S14 It was easy to tell peers what I liked/disliked. 1.12 1 0.67
S15 The statistical numbers (mine & peers’) engaged me to learn more. 1 1 0.65
S16 Topolor helped me engaged in interacting with peers. 1.2 1 0.50
5
Discussion and Future Studies
To reduce bias, two different experiments were conducted, involving students from different disciplines: i.e., computer science and economics. Computer science students (participating in the first experiment) might have a better understanding of system development, thus their response might not purely reflect perceptions about the learning process. The two different student groups, despite potential advantages, could have introduced additional problems, such as a great variety in data, not allowing for a coherent combined analysis. However, the settings of the two experiments were very similar, to prevent such problems. For example, both contained time-controlled and a non-time-controlled learning processes; both used the same questionnaire. Indeed, the separate pilot analysis on the data showed that the results from them were very similar.
The results may appear possibly counter-intuitive, as the high number of functionalities may appear complex to learners. However, in fact, we have found that using a Facebook-like appearance, and a game-inspired paradigm, quickly transformed learners into expert users of the system. Due to the low number of learners, no definite conclusions can be drawn, and the results are illustrative. However, as the learners individually scored these functionalities, we were able to receive an initial feedback for individual functionalities and some measure of their relative importance. This suggests answers for the research question on what features and visualisations should be provided via OSLM:e.g., functionality 45 “statistics for the profile’s
owner” (see section 4.2). An important follow-up question – why these features are important – has been speculated upon in
section 4. Follow-up longitudinal experiments are already running in Jordan University and Pittsburgh University to delve more in depth in such issues. Overall, evaluation results have revealed the potential benefits of applying the proposed multifaceted-OSLM approach in social personalized adaptive e-learning. The high means and medians of the Likert-scale questionnaire survey results, along with the high reliability scores, have suggested that this approach is promising.
In this experimental study, as the system was new to learners, we found a large percentage of exploratory activities. For example, some of them tried various functionalities in a relative short period of time. This did not demonstrate a focused learning process. However, such behaviors might also occur when learners are familiar with the system, for instance when they are bored or lost, hereby randomly checking out various functionalities. Therefore, we have planned further longitudinal studies to analyze any changes in behavior with learners that are more familiar with the system. Nevertheless, these exploratory behaviors did not obstruct the importance of the results and the lessons learnt presented in this study, as students’ exploration allowed them to consider and feedback on various types of individual functionality (section 4.2).
Moreover, evaluation of learners’ performance is important in evaluating an e-learning system. Topolor 2 allows for storing of various quiz and test results, as well as learning record status - such as “known”, “unknown” and “learning”, which are inherited from traditional user modeling approaches in adaptive educational hypermedia. However, the exploratory behaviors caused learners to not take enough quizzes or tests for us to be able to evaluate objective learning outcomes and performances. Although the focus of the study was to investigate subjective perception of effectiveness, efficiency and
satisfaction, this has been a limitation. However, in this study we have asked students specific questions about their perceived learning impact, and current outcomes are positive (section 4.3). Moreover, to address this limitation, we have already started running follow-up longitudinal experiments in Jordan and Pittsburgh; we have also planed more controlled experiments ensuring collecting more quiz and test scores from students.
Furthermore, whilst most visualization of comparisons between learners and their learning group, e.g., top 20% learners of the class – hide other learners’ data, the “vs” mode does not – which may raise ethical and privacy issues. However, establishing the best practices for the private handling of the data was not the purpose of this work, and there are other studies applicable directly to this approach. Further work is thus looking into introducing privacy management mechanisms based on previous studies, to allow learners to expose data to different groups in different ways. Potential solutions are disclosure on a voluntary basis (like in Facebook, sharing different parts of the private information with different users). Moreover, none of the students in any of the studies presented here, or the follow-up studies, raised privacy concerns – possibly as their performance in the system didn't affect any grades, and was entirely voluntary.
Besides the quantitative results from the questionnaire survey, some qualitative feedback was also received from the course instructor, the observers and the students. It was generally consistent with the quantitative results. A number of participants made positive remarks and expressed interest in further using Topolor 2. Yet, a negative feedback provided by the observers was that some students, who were using smart phones to access Topolor 2, complained that it was not obvious
what they should do next. This indicated that the device types might also influence user experience. Whilst Topolor 2 was designed mainly for laptop/desktop use, it is clear that nowadays the ability to adapt to the hardware context is essential, as mobile use is widespread, and users perceive it as a natural way of accessing e-learning systems and contents. Therefore, the adaptation of the learner data visualization to different hardware context has been on our follow-up research agenda.
6
Conclusions
This work has explored the novel approach of multifaceted open social learner modeling (multifaceted-OSLM), and demonstrated it via an implementation, i.e., the new multifaceted-OSLM functionalities in Topolor 2, and an experimental study on evaluating learners’ perception of effectiveness, efficiency and satisfaction including satisfaction with learning impact. This paper has discussed limitations and lessons learnt, and follow-up experiments towards addressing limitations and strengthening the results.
Unlike prior approaches, the proposed multifaceted-OSLM approach visualizes not only learners’ performance, but also their contribution to a learning community, which can potentially cater for a social e-learning context, where learners are “prosumers” – both learning content producers and consumers. Additionally, this new approach provides various comparison modes that allow for visualizing the differences between learners’ history, e.g., in terms of test score trends, between them
and another learner, and between them and a group (i.e., the whole class and the top 20% of the class). Moreover, this new approach is integrated and adapted to learning contents, so that its ubiquity and context-awareness could improve the balance of adaptivity and adaptability of an adaptive social e-learning system.
In conclusion, we suggest considering the proposed multifaceted-OSLM approach when developing or improving a social e-learning system. More specifically, and to answer the research question stated in section 1, we claim that interactive multifaceted visualization of learners’ performance, contribution, comparison, learning path and learning activity, rooted in and taking benefits from various learning theories, such as connectivism, constructivism, and competitive learning ([2], [9]) can enhance social e-learning systems, and thus provide a high level of effectiveness, efficiency and satisfaction perceived by the learners, as long as it is based on social media visualization principles.
References
[1] F. Rennie and T. Morrison, E-learning and social networking handbook: Resources for higher education. Routledge, 2013.
[2] C. Tschofen and J. Mackness, “Connectivism and dimensions of individual experience,” The International Review of Research in Open and Distance Learning, vol. 13, no. 1, pp. 124–143, Jan. 2012.
[3] L. Shi, “Scaffolding for social personalised adaptive e-learning,” University of Warwick, 2014.
[4] S. Bull and J. Kay, “Open Learner Models as Drivers for Metacognitive Processes,” in International Handbook of Metacognition and Learning Technologies, vol. 28, R. Azevedo and V. Aleven, Eds. Springer New York, 2013, pp. 349– 365.
[5] J. Vassileva, “Motivating participation in social computing applications: a user modeling perspective,” User Modeling and User-Adapted Interaction, vol. 22, no. 1–2, pp. 177–201, 2012.
[6] M. Liang, J. Guerra, G. E. Marai, and P. Brusilovsky, “Collaborative e-learning through open social student modeling and Progressive Zoom navigation,” in Collaborative Computing: Networking, Applications and Worksharing, 2012 8th International Conference on, 2012, pp. 252–261.
[7] M. Castells, The rise of the network society: The information age: Economy, society, and culture, vol. 1. John Wiley & Sons, 2011.
[8] J. Donaldson, “Learners as Producers: Structuring Courses around Open Resource Production by Students,” in OCWC Global Conference 2013, 2013.
[9] J. C. Burguillo, “Using game theory and Competition-based Learning to stimulate student motivation and performance,”
Computers & Education, vol. 55, no. 2, pp. 566–575, Sep. 2010.
[10] J. Kay, “Stereotypes, student models and scrutability,” in Intelligent Tutoring Systems, vol. 1839, G. Gauthier, C. Frasson, and K. VanLehn, Eds. Springer Berlin Heidelberg, 2000, pp. 19–30.
[11] V. Bremgartner, J. Netto, and C. Menezes, “Using Agents and Open Learner Model Ontology for Providing Constructive Adaptive Techniques in Virtual Learning Environments,” in Advances in Artificial Intelligence – IBERAMIA 2014, A. L. C. Bazzan and K. Pichara, Eds. Springer International Publishing, 2014, pp. 625–636.
[12] I.-H. Hsiao, F. Bakalov, P. Brusilovsky, and B. König-Ries, “Open Social Student Modeling: Visualizing Student Models with Parallel IntrospectiveViews,” in User Modeling, Adaption and Personalization, vol. 6787, J. Konstan, R. Conejo, J. Marzo, and N. Oliver, Eds. Springer Berlin Heidelberg, 2011, pp. 171–182.
[13] P. Brusilovsky, I.-H. Hsiao, and Y. Folajimi, “QuizMap: Open Social Student Modeling and Adaptive Navigation Support with TreeMaps,” in Towards Ubiquitous Learning, vol. 6964, C. Kloos, D. Gillet, R. Crespo García, F. Wild, and M. Wolpers, Eds. Springer Berlin Heidelberg, 2011, pp. 71–82.
[14] I.-H. Hsiao and P. Brusilovsky, “Motivational social visualizations for personalized E-learning,” in 21st Century Learning for 21st Century Skills, vol. 7563, A. Ravenscroft, S. Lindstaedt, C. Kloos, and D. Hernández-Leo, Eds. Springer Berlin Heidelberg, 2012, pp. 153–165.
[15]K.M. Kapp, "The gamification of learning and instruction: game-based methods and strategies for training and education." John Wiley & Sons, 2012.
[16] G. Siemens, & P. Long. "Penetrating the Fog: Analytics in Learning and Education." EDUCAUSE review 46.5 pp30, 2011.
[17] N. Ahmad, “Users’ trust in open learner models,” Jul-2014.
[18] R. Martínez, A. Collins, J. Kay, and K. Yacef, “Who did What? Who said That?: Collaid: An environment for capturing traces of collaborative learning at the tabletop,” in Proceedings of the ACM International Conference on Interactive Tabletops and Surfaces, New York, NY, USA, 2011, pp. 172–181.