FINANCIAL REPORTING: THE APPLICATION OF PROFESSIONAL DEVELOPMENT AND RESEARCH
by Hannah C. Hilton
A thesis submitted to the faculty of The University of Mississippi in partial fulfillment of the requirements of the Sally McDonnell Barksdale Honors College.
Oxford, MS May 2019
Approved by ______________________________ Advisor: Dr. Victoria Dickinson ______________________________ Reader: Dean Mark Wilder
! ii © 2019 Hannah C. Hilton ALL RIGHTS RESERVED
! iii ABSTRACT
HANNAH C. HILTON: Financial Reporting: The Application of Professional Development and Research
(Under the direction of Victoria Dickinson)
Financial reporting is the basis upon which investors and other users make financial decisions; therefore, it is important that the information be accurate and complete in accordance with Generally Accepted Accounting Principles (GAAP). This thesis sought to study different areas within financial reporting, such as stockholders’ equity, revenue recognition, deferred income taxation, accounts receivable, and other relevant items in compliance with financial reporting standards. The information included in this thesis was gathered through the execution of a series of twelve case studies. The case studies, as completed, apply accounting concepts in conformity with GAAP, International Financial Reporting Standards (IFRS), and the FASB Codification.
This thesis required application of the accounting concepts taught in accounting courses to real-life companies, both domestic and foreign. Analysis of the complex topics included in the case studies required dissection of financial statements, such as the
Balance Sheet, Income Statement, Statement of Cash Flows, as well as the notes to the financial statements. Companies often report significant supplementary information within the notes; therefore, analysis of these disclosures, in addition to the financial statements, aided my research. Application of this financial research further expanded and enhanced my knowledge of challenging accounting concepts to utilize within my future career in public accounting. This thesis was created with the intent to investigate critical accounting concepts and principles in compliance with professional rules and regulations. On my Honor, I pledge that I have neither given, received, or witnessed any unauthorized help on these case studies.
! iv
TABLE OF CONTENTS
LIST OF FIGURES AND APPENDICES.……….v
CASE STUDY 1: Home Heaters, Inc………..1
CASE STUDY 2: Molson Coors Brewing Company………18
CASE STUDY 3: Pearson, PLC………24
CASE STUDY 4: Time Value of Money—A Step-by-Step Guide………...34
CASE STUDY 5: Palfinger AG………....40
CASE STUDY 6: Volvo Group……….……50
CASE STUDY 7: Hadoop Data Analytics Tool………58
CASE STUDY 8: Rite Aid Corporation………66
CASE STUDY 9: Merck & Co., Inc………..75
CASE STUDY 10: State Street Corporation……….82
CASE STUDY 11: ZAGG, Inc………..91
CASE STUDY 12: Apple, Inc……….101 v 1 18 24 34 40 50 58 66 75 82 91 101
! v LIST OF FIGURES AND APPENDICES CASE STUDY 1: Home Heaters, Inc.
Figure 1-1: Eads Heaters, Inc. Income Statement……….. Figure 1-2: Glenwood Heating, Inc. Income Statement……… Figure 1-3: Eads Heaters, Inc. Statement of Retained Earnings……… Figure 1-4: Glenwood Heating, Inc. Statement of Retained Earnings……….. Figure 1-5: Eads Heaters Inc. Classified Balance Sheet……… Figure 1-6: Glenwood Heating, Inc. Classified Balance Sheet………. Figure 1-7: Eads Heaters, Inc. Ratio Analysis………... Figure 1-8: Glenwood Heating, Inc. Ratio Analysis……….. Appendix A-1: Home Heaters, Inc. First Year Transactions………. Appendix A-2: Home Heaters, Inc. Trial Balance………. Appendix A-3: Eads Heaters, Inc. Adjusting Transactions………... Appendix A-4: Eads Heaters, Inc. Adjusted Trial Balance………... Appendix A-5: Glenwood Heating, Inc. Adjusting Transactions……….. Appendix A-6: Glenwood Heating, Inc. Adjusted Trial Balance……….. CASE STUDY 3: Pearson, PLC.
Figure 3-1: Allowance for Doubtful Accounts T-Account……… Figure 3-2: Allowance for Sales Returns and Allowances T-Account………. Figure 3-3: Accounts Receivable T-Account……… CASE STUDY 5: Palfinger AG
Figure 5-1: Straight-Line Depreciation Table……… Figure 5-2: Double-Declining-Balance Depreciation Table……….. CASE STUDY 6: Volvo Group
Figure 6-1: Product and Software Development T-Account………. Figure 6-2: Product and Software Development Intangible Asset Table……….. Figure 6-3: Navistar Research and Development Comparative Table……….. Figure 6-4: Volvo Net Sales and Total Assets Table………. CASE STUDY 8: Rite Aid Corporation
Figure 8-1: Rite Aid Corporation Bond Amortization Table………. CASE STUDY 9: Merck & Co., Inc.
Figure 9-1: Merck & Co. Financial Information………... Figure 9-2: Merck & Co. Dividend Ratios………
4 5 6 6 7 8 9 9 ! 10 11 12 14 15 17 29 31 32 47 48 54 55 56 56 73 80 81 !
! 1
! 2
CASE STUDY 1: Home Heaters, Inc.
Eads Heaters, Inc. and Glenwood Heating, Inc. are two home heating companies based out of Colorado. Both companies began identical operations in the year 20X1. Although both companies had identical transactions, each manager made different accounting decisions when preparing the financial statements at the end of the year. The purpose of this report is to analyze the accounting choices made by the managers of both companies to ultimately decide which company is the better investment.
After thorough analysis of transactions made by each company and running the respective financial statements, it has been determined that Glenwood Heating, Inc. is the most profitable company. At the end of the first year, Glenwood Heating had a net
income of $94,742, whereas Eads Heaters finished with a net income of $70,515.1
Glenwood Heating also had a 14.43 percent return on assets and a 40.40 percent return on equity.2 In contrast, Eads Heaters’ return on assets and return on equity were 10.01
percent and 34.01 percent, respectively. Investors of Glenwood Heating can expect earnings per share of $17.84, while those invested in Eads Heaters can expect $13.56. Additional information can be found in the financial statements included in this report.
The year-end accounting decisions made by the manager of Glenwood Heating, Inc. led the company to have higher current assets, higher net income, and fewer liabilities than Eads Heaters had. Such decisions include estimating less uncollectible accounts, depreciating long term assets using solely straight-line depreciation, as well as booking leased equipment as an operating expense rather than capitalizing the leased
!!!!!!!!!!!!!!!!!!!!!!!!!!!!!!!!!!!!!!!!!!!!!!!!!!!!!!!!
1!Net Income can be found pages 4 and 5. 2 Ratios can be found on page 9.!!
! 3
equipment. As Glenwood Heating, Inc. is the most profitable company with the highest returns and net income, it would give investors a higher return on their investment. Therefore, Glenwood Heating, Inc. would be the recommended company in which to invest.
After reviewing these differing accounting decisions, I now understand how different choices and estimates can have a large impact financial statement information. Even the smallest of choices can lead to an investor choosing a competitor instead. In the future, I will use this knowledge to think more wisely when applying generally accepted accounting principles and to better make recommendations to advisory clients.
Glenwood Heating, Inc. reported a higher net income than Eads Heaters, Inc. because of the differing accounting choices. When estimating receivables, the manager of Eads Heaters, Inc. estimated that five percent of ending accounts receivable would be uncollectible. As the Accounts Receivable account was $99,400 at year-end, the
allowance for bad debts was $4, 970. In regards to cost of goods sold, the manager chose the LIFO method to calculate, which decreased the Inventory account by $188,800. The manager made the decision to enter into a capital lease agreement rather than rent equipment on a yearly basis, which added leased equipment worth $92,000 to the company’s assets. 25 percent of Net Income was expensed for Income Tax.
In contrast, the manager of Glenwood Heating, Inc. estimated that one percent of ending accounts receivable would be uncollectible. As the Accounts Receivable account was $99,400 at year-end, the allowance for bad debts was $994. In regards to cost of goods sold, the manager chose the FIFO method to calculate, which decreased the Inventory account by $177,000. The manager made the decision to rent equipment on a
! 4
yearly basis, which led to a Rent Expense of $16,000. Finally, an estimated 25 percent of Net Income was expensed for Income Tax. The figures included in this case study are provided to supplement the analysis of the two heating corporations.
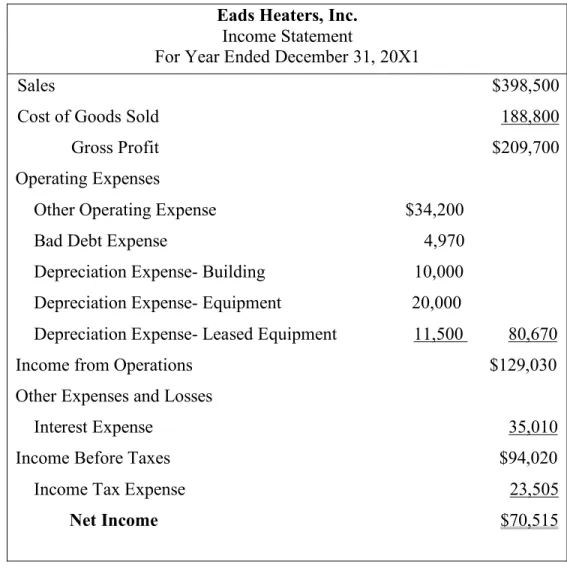
Figure 1-1: Eads Heaters, Inc. Income Statement Eads Heaters, Inc.
Income Statement
For Year Ended December 31, 20X1
Sales $398,500 Cost of Goods Sold 188,800 Gross Profit $209,700 Operating Expenses
Other Operating Expense $34,200 Bad Debt Expense 4,970 Depreciation Expense- Building 10,000 Depreciation Expense- Equipment 20,000
Depreciation Expense- Leased Equipment 11,500 80,670 Income from Operations $129,030 Other Expenses and Losses
Interest Expense 35,010 Income Before Taxes $94,020 Income Tax Expense 23,505 Net Income $70,515
! 5
Figure 1-2: Glenwood Heating Inc, Income Statement Glenwood Heating, Inc.
Income Statement
For Year Ended December 31, 20X1
Sales $398,500 Cost of Goods Sold 177,000 Gross Profit $221,500 Operating Expenses
Other Operating Expense $34,200 Bad Debt Expense 994 Depreciation Expense- Building 10,000 Depreciation Expense- Equipment 9,000
Rent Expense- Leased Equipment 16,000 70,194 Income from Operations $151,306 Other Expenses and Losses
Interest Expense 27,650 Income Before Taxes $123,656 Income Tax Expense 30,914 Net Income $92,742
! 6
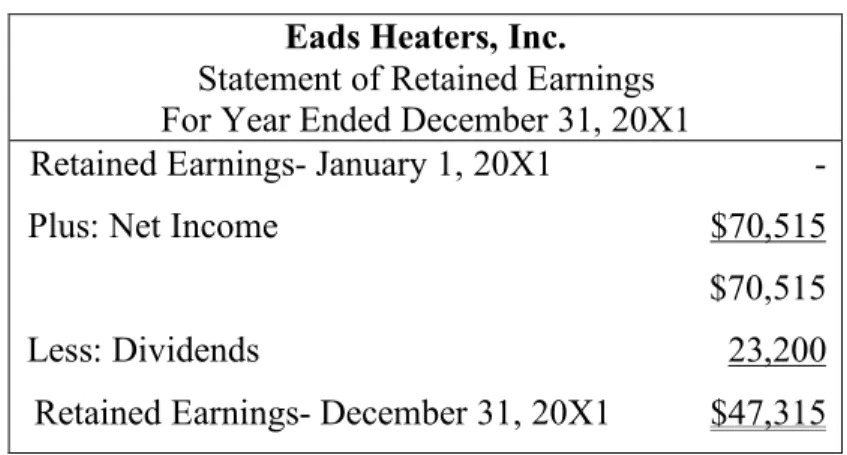
Figure 1-3: Eads Heaters, Inc. Statement of Retained Earnings Eads Heaters, Inc.
Statement of Retained Earnings For Year Ended December 31, 20X1
Retained Earnings- January 1, 20X1 - Plus: Net Income $70,515 $70,515 Less: Dividends 23,200 Retained Earnings- December 31, 20X1 $47,315
Figure 1-4: Glenwood Heating, Inc. Statement of Retained Earnings Glenwood Heating, Inc.
Statement of Retained Earnings For Year Ended December 31, 20X1
Retained Earnings- January 1, 20X1 - Plus: Net Income $92,742 $92,742 Less: Dividends 23,200 Retained Earnings- December 31, 20X1 $69,542
! 7
Figure 1-5: Eads Heaters, Inc. Classified Balance Sheet Eads Heaters, Inc. Classified Balance Sheet As of December 31, 20X1
Assets Current Assets
Cash $7,835 Accounts Receivable 99,400
Less: Allowance for Doubtful Accounts 4,970 94,430 Inventory 51,000 Total Current Assets 153,265 Property, Plant and Equipment
Land 70,000 Building 350,000
Less: Accumulated Depreciation- Building 10,000 340,000 Equipment 80,000
Less: Accumulated Depreciation- Equipment 20,000 60,000 Leased Equipment 92,000
Less: Accumulated Depreciation- Leased Equipment 11,500 80,500 Total Property, Plant and Equipment 550,500 Total Assets $703,765
Liabilities and Stockholders’ Equity Current Liabilities
Accounts Payable $26,440 Interest Payable 6,650 Lease Payable 83,360 Total Current Liabilities 116,450 Long-Term Liabilities
Note Payable 380,000 Total Liabilities $496,450 Stockholders’ Equity
Common Stock, authorized and issued, 3,200 shares 160,000 Retained Earnings 47,315 Total Stockholders’ Equity $207,315 Total Liabilities and Stockholders’ Equity $703,765
! 8
Figure 1-6: Glenwood Heating, Inc. Classified Balance Sheet Glenwood Heating, Inc.
Classified Balance Sheet As of December 31, 20X1
Assets Current Assets
Cash $426 Accounts Receivable 99,400
Less: Allowance for Doubtful Accounts 994 98,406 Inventory 62,800 Total Current Assets 161,632 Property, Plant and Equipment
Land 70,000 Building 350,000
Less: Accumulated Depreciation- Building 10,000 340,000 Equipment 80,000
Less: Accumulated Depreciation- Equipment 9,000 71,000 Total Property, Plant and Equipment 481,000 Total Assets $642,632
Liabilities and Stockholders’ Equity Current Liabilities
Accounts Payable $26,440 Interest Payable 6,650 Total Current Liabilities 33,090 Long-Term Liabilities
Note Payable 380,000 Total Liabilities $413,090 Stockholders’ Equity
Common Stock, authorized and issued, 3,200 shares 160,000 Retained Earnings 69,542 Total Stockholders’ Equity $229,542 Total Liabilities and Stockholders’ Equity $642,632
! 9 Figure 1-7: Eads Heaters, Inc. Ratio Analysis Current Ratio = 30.87%
Current Assets / Current Liabilities = $153,265 / $496,450 Return on Assets = 10.01%
Net Income / Average Total Assets = $70,515 / $703,765 Return on Equity = 34.01%
Net Income / Average Stockholders’ Equity = $70,515 / $207,315 Profit Margin Ratio = 17.70%
Net Income / Sales = $70,515 / $398,500 Earnings Per Share = $13.56
Net Income / Number of Common Shares Outstanding = $70,515 / 5,200 shares
Figure 1-8: Glenwood Heating, Inc. Ratio Analysis Current Ratio = 39.13%
Current Assets / Current Liabilities = $161,632 / $413,090 Return on Assets = 14.43%
Net Income / Average Total Assets = $92,742 / $642,632 Return on Equity = 40.40%
Net Income / Average Stockholders’ Equity = $92,742 / $229,542 Profit Margin Ratio = 23.27%
Net Income / Sales = $94,742 / $398,500 Earnings Per Share = $17.84
! 10
APPENDICES—CASE STUDY 1: Home Heaters, Inc.
The following figures were used to determine the financial information included in the body of this case.
Appendix A-1: Home Heaters, Inc. First Year Transactions ASSETS
Transaction Cash Accounts Receivable
Inventory Land Building Equipment No.1 No. 2 No. 3 No. 4 No. 5 No. 6 No. 7 No. 8 No. 9 No. 10 No. 11 No. 12 $160,000 400,000 (420,000) (80,000) 229,100 (213,360) (41,000) (34,200) (23,200) $358,500 (229,100) $239,800 $70,000 $350,000 $80,000 Balances $47,340 $99,400 $239,800 $70,000 $350,000 $80,000
LIABILITIES STOCKHOLDERS’ EQUITY Transaction Accounts Payable Notes Payable Interest Payable + Common Stock Retained Earnings No.1 No. 2 No. 3 No. 4 No. 5 No. 6 No. 7 No. 8 No. 9 No. 10 No. 11 No. 12 $239,800 (213,360) $400,000 (20,000) $6,650 $160,000 $398,500 (21,000) (34,200) (23,200) (6,650) $26,440 $380,000 $6,650 $160,000 $313,450
! 11
Eads Heaters, Inc. and Glenwood Heating, Inc. completed identical transactions in their first year of operations. Each entry was recorded the same in accordance with
generally accepted accounting principles.
Appendix A-2: Home Heaters, Inc. Trial Balance Home Heaters Trial Balance As of December 31, 20X1 Debits Credits Cash $47,340 Accounts Receivable 99,400 Inventory 239,800 Land 70,000 Building 350,000 Equipment 80,000 Accounts Payable $26,440 Note Payable 380,000 Interest Payable 6,650 Common Stock 160,000 Dividends 23,200 Sales 398,500 Other Operating Expenses 34,200
Interest Expense 27,650__________ Total $971,590 $971,590
! 12 Appendix A-3: Eads Heaters, Inc. Adjusting Transactions
ASSETS
Allowance
Accts. for Bad Leased Accumulated Transactions Cash Rec. Debts Inventory Land Building Equipment Equipment Depreciation Balance: Part A $47,340 $99,400 $239,800 $70,000 $350,000 $80,000 Part B: 1)! Bad Debts ($4,970) 2)! COGS (188,800) 3)! Depreciation Building ($10,000) Equipment (20,000) 4)! Equipment Lease $92,000 Lease Payment (16,000) Depreciation (11,500) 5)! Income Tax (23,505)_______________________________________________________________________________ Balances $7,835 $99,400 ($4,970) $51,000 $70,000 $350,000 $80,000 $92.000 ($41,500)
! 13 Appendix A-3 Continued
LIABILITIES STOCKHOLDERS’ EQUITY Transactions Accounts Interest Notes Lease Common Retained
Payable Payable Payable Payable Stock Earnings Balance: Part A $26,440 $6,650 $380,000 $160,000 $313,450 Part B: 1)! Bad Debts (4,970) 2)! COGS (188,800) 3)! Depreciation Building (10,000) Equipment (20,000) 4)! Equipment Lease $92,000 Lease Payment (8,640) (7,360) Depreciation (11,500) 5)! Income Tax_______________________________________________ ________________(23,505) Balances $26,440 $6,650 $380,000 $83,360 $160,000 $47,315
! 14
Appendix A-4: Eads Heaters, Inc. Adjusted Trial Balance Eads Heaters, Inc.
Trial Balance As of December 31, 20X1
Debits Credits Cash $7,835
Accounts Receivable 99,400
Allowance for Bad Debts $4,970 Inventory 51,000
Land 70,000 Building 350,000
Accumulated Depreciation- Building 10,000 Equipment 80,000
Accumulated Depreciation- Equipment 20,000 Leased Equipment 92,000
Accumulated Depreciation- Leased Equipment 11,500 Accounts Payable 26,440 Note Payable 380,000 Interest Payable 6,650 Lease Payable 83,360 Common Stock 160,000 Dividends 23,200 Sales 398,500 Cost of Goods Sold 188,800
Other Operating Expense 34,200 Bad Debt Expense 4,970 Depreciation Expense- Building 10,000 Depreciation Expense- Equipment 20,000 Depreciation Expense- Leased Equipment 11,500 Interest Expense 35,010
Provision for Income Tax 23,505___________ Total $1,101,420 $1,101,420
! 15 Appendix A-5: Glenwood Heating, Inc. Adjusting Transactions
ASSETS
Allowance
Accts. for Bad Accumulated Transactions Cash Receivable Debts Inventory Land Building Equipment Depreciation Balance: Part A $47,340 $99,400 $239,800 $70,000 $350,000 $80,000 Part B: 1)! Bad Debts (994) 2)! COGS (177,000) 3)! Depreciation Building (10,000) Equipment (9,000) 4)! Equipment Rental Payment (16,000) 5)! Income Tax (30,914_____________________________________________________________________________ Balances $426 $99,400 ($994) $62,800 $70,000 $350,000 $80,000 ($19,000)
! 16 Appendix A-5 Continued
LIABILITIES STOCKHOLDERS’ EQUITY Transactions Accounts Interest Notes Common Retained
Payable Payable Payable Stock Earnings Balance: Part A $26,440 $6,650 $380,000 $160,000 $313,450 Part B: 1)! Bad Debts (994) 2)! COGS (177,000) 3)! Depreciation Building (10,000) Equipment (9,000) 4)! Equipment Rental Payment (16,000) 5)! Income Tax ______________________________________________________ (30,914) Balances $26,440 $6,650 $380,000 $160,000 $69,542
! 17
Appendix A-6: Glenwood Heating, Inc. Adjusted Trial Balance Glenwood Heating, Inc.
Trial Balance As of December 31, 20X1
Debits Credits Cash $7,835
Accounts Receivable 99,400
Allowance for Bad Debts $994 Inventory 62,800
Land 70,000 Building 350,000
Accumulated Depreciation- Building 10,000 Equipment 80,000
Accumulated Depreciation- Equipment 9,000 Accounts Payable 26,440 Note Payable 380,000 Interest Payable 6,650 Lease Payable 83,360 Common Stock 160,000 Dividends 23,200 Sales 398,500 Cost of Goods Sold 177,000
Other Operating Expense 34,200 Bad Debt Expense 994 Depreciation Expense- Building 10,000 Depreciation Expense- Equipment 9,000 Rent Expense 16,000 Interest Expense 27,650
Provision for Income Tax 30,914___________ Total $991,584 $991,584
! 18
! 19
CASE STUDY 2: Molson Coors Brewing Company
Molson Coors Brewing Company is a company committed to producing high-quality beers with brands designed to appeal to a variety of customers and their preferences. Through the interpretation of Molson Coors Brewing Company financial statements, users are able to learn about the company’s performance. This report is designed to help these users learn the meaning of specific financial statement items, as well as how they should be interpreted. All information comes from the financial statements of Molson Coors Brewing Company.
From the Molson Coors Brewing Company case study, I gained new knowledge regarding income statement information. I learned the differing classifications of income and expenses, such as operating or non-operating. In addition, I learned about the following: special line items related to unusual transactions, comprehensive income, unrealized gains and losses, and effective tax rates. The case study increased my ability to analyze income statement information, which can be applied in my future career.
Income Statement line items vary according to industry; however, the major classifications generally include Revenues and Expenses. The Income Statement is divided into sections, which include Operating, Non-Operating, Income Tax, Discontinued Operations, Non-Controlling Interest, as well as Earnings Per Share. The Operating section includes Sales or Revenues less Expenses such as Cost of Goods Sold, Selling Expenses, and Administrative Expenses. The Non-Operating section states other Revenues, Gains, Expenses, and Losses not related to the company’s daily operations. Income Tax,
! 20
Discontinued Operations, Non-Controlling Interest, and Earnings Per Share are also involved in the calculation of Net Income or Net Loss.
As United States Generally Accepted Accounting Principles (GAAP) encourage internal controls and discourages any fraudulent acts, companies in the United States are required to provide “classified” income statements. A classified income statement aids an investor in making more informed decisions. By
separating operating and non-operating activities, it allows an investor to better understand the profitability of the company based on its everyday operations. In addition, the going concern of a company can be better analyzed. For example, a company may experience many unusual transactions that boost net income for the year, but the company may not have profitable operations. The Classifying
various categories of revenues and expenses gives users a more in depth understanding of the company’s operations and ability to continue as an entity.
Financial statement users, particularly investors and creditors, may be interested in a measure of persistent income as it allows them to compare income over many periods. Persistent income helps users to more accurately predict earnings in the future or ability to pay debt as it becomes due. A creditor would be more apt to lend financial resources to a company with consistent or increasing yearly earnings. Additionally, an investor may find past earnings useful to value the company in the future. Therefore, a measure of persistent income may be essential for creditors and investors prior to lending or investing.
Comprehensive Income encompasses the total change in the equity of a company from non-owner sources. Comprehensive Income includes net income
! 21
plus unrealized gains and losses incurred. An unrealized gain or loss is incurred when an asset or security changes in value after it has been purchased, but before it is resold. Reporting an unrealized gain or loss allows a company to value their securities or other assets at fair value. Fair value is increased or decreased through unrealized gains and losses for valuation purposes. Net Income, although similar, does not include these changes in equity as they have not been realized yet.
The income statement of Molson Coors reports sales and net sales
differently and separately. The difference between sales and net sales on Molson Coors’ income statement is that the reported sales amount does not include the money paid to the government in the form of excise taxes. Excise taxes apply when purchases are made on specific goods such as alcohol, which is Molson Coors main product. Molson Coors reports these two items separately to clarify the net amount of revenue received through sales, which is the monetary price less excise tax.
Molson Coors lists a line item on their income statement called “Special Items, net,” as well as additional note disclosures regarding the special items. In general, the special items Molson Coors includes in the line item “Special items, net” are charges or gains that do not coincide with their core operations. This includes employee-related charges, impairments, unusual items, and more.
Molson Coors reports these special items on a separate line item rather than with another expense item as to make note of the unusual and infrequent nature of these charges or gains. Molson Coors classifies these special items as operating expenses, rather than non-operating expenses. I do not agree with this
! 22
classification, as the items are not a part of Molson Coors’ daily operations. For example, one special item records the reimbursement of insurance due to losses caused by flooding in the Czech Republic. As this is not a daily occurrence that coincides with operating and producing beer, it is a non-operating expense and should be reported as such.
In addition to special items, Molson Coors reports “Other income
(expense), net” with note disclosures. The income statement item “Other income (expense), net” includes expenses not related to operating; however, they are more likely to reoccur in future periods. As previously mentioned, the special line items should also be classified as a non-operating expense as they are more unique and less likely to occur in future periods. Although these are both non-operating expenses, “Other income (expense), net” occurs more frequently than special line items.
The amount of comprehensive income in 2013 is $765.4 million, less $5.2 million attributable to non-controlling interests, for a total of $760.2 million in comprehensive income attributable to Molson Coors. This amount is $187.7 million more than the net income in 2013 of $572.5 million. Comprehensive income for 2013 differs from net income, as it includes unrealized gains and losses, whereas net income does not include these items. The items included in Molson Coors’ comprehensive income are related as they recognize unrealized gains on instruments, adjustments for foreign currency, and more. Comprehensive income also includes the distribution of income to non-controlling interests, which pays the minority owner of Molson Coors’ subsidiaries.
! 23
Molson Coors’ effective tax rate in 2013 is 12.8 percent. This rate was calculated by dividing the Income Tax Expense of $84 million by the Pre-Tax Income of $654.5. The effective tax rate is the average rate at which pre-tax profits are taxed. Following the tax reform beginning in 2019, corporate tax rates are now a flat 21 percent. This is down from 35 percent in years prior, therefore corporations will be at an advantage as compared to prior years.
! 24
! 25
CASE STUDY 3: Pearson, PLC.
Pearson, PLC. is an international company with a variety of operations relating to education, business information, and consumer publishing. Pearson is connected to a variety of countries; thus, its financial statements are prepared according to IFRS. With sales of £5.6 billion and receivables of over £1.28 billion in 2009, Pearson is a great example of a large company that must estimate
uncollectible accounts and sales returns. The purpose of this report is to analyze financial statements in order to explain terminology related to accounts receivable and its contra receivable accounts, as well as to identify the amounts that
correspond with these accounts.
This case has allowed me to take a look at international financial
statements to learn how many differences there may be, especially in regards to IFRS and United States GAAP. For example, Provisions for Bad and Doubtful Debts is translated to Allowance for Doubtful Accounts in United States GAAP. Through analyzing specific financial statement parts and line items, I have gained a deeper understanding about accounts receivable, the different approaches to estimating bad debts and sales returns, and how uncollectible accounts are written off. I learned that not all accounts receivable are going to be collected; therefore, an estimate of bad debts must be made to report accounts receivable at their net realizable value. Furthermore, it was refreshing to get to view financial statements prepared according to IFRS. In the future, I will put this case knowledge to use when I, myself, will be estimating uncollectible items or auditing a company that has had to.
! 26
PART A: What is an account receivable? What other names does this go by? An account receivable is recorded when a customer owes an amount to a company for goods or services purchased. For example, when a customer
purchases an item on credit, accounts receivable is increased. This asset can also be referred to as “trade receivables.” Accounts receivable have a normal debit balance.
PART B: How do accounts receivable differ from notes receivable?
Accounts receivable are different than notes receivable in terms of when cash is collected, as well as from differing transaction types. Cash is usually collected for accounts receivable within 30 to 60 days, whereas for notes receivable cash is collected on a specific date in the future. Accounts receivable mainly relate to sales of goods and services, while notes receivable may relate to sales, financing, or other transactions. In addition, notes receivable are often interest-bearing, while accounts receivable are not. Therefore, Pearson will receive additional earnings on the note.
PART C: What is a contra account? What two contra accounts are associated with Pearson’s trade receivables (see Note 22)? What types of activities are captured in each of these contra accounts? Describe factors that managers might consider when deciding how to estimate the balance in each of these contra accounts.
A contra account on a balance sheet decreases the related asset, liability, or owners’ equity account. The two contra accounts associated with Pearson’s trade receivables are Anticipated Future Sales Returns and Provisions for Bad and
! 27
Doubtful Debts. In United States GAAP, these account names translate to Allowance for Sales Returns and Allowances and Allowance for Doubtful Accounts, respectively.
For Allowance for Sales Returns and Allowances, activities such as estimating Sales Returns and Allowances increase the account balance, while actual sales returns decrease the account balance. For Allowance for Doubtful Accounts, activities such as estimating Bad Debt Expense increase the account balance, while write-offs for specific accounts decrease the account balance. Factors managers might consider when estimating the balance in these contra accounts include past bad debt expenses and relationships with customers to estimate the likelihood of their payment.
PART D: Two commonly used approaches for estimating uncollectible accounts receivable are the percentage-of-sales procedure and the aging-of-accounts procedure. Briefly describe these two approaches. What
information do managers need to determine the activity and final account balance under each approach? Which of the two approaches do you think results in a more accurate estimate of net accounts receivable?
The percentage-of-sales procedure is an income statement approach for estimating bad debts. Past performance and other factors are the basis for the percentage calculated. Bad Debts Expense is calculated by multiplying the calculated percentage by credit sales. This is followed by an adjusting entry to recognize bad debts and decrease accounts receivable.
! 28
The aging-of-accounts procedure sorts accounts receivable in
chronological order according to dates of unpaid invoices. An aging schedule will perhaps include under 30 days, 30-60 days, 61-90 days, and so on; the later the periods the higher the percentage estimated to be uncollectible. The purpose is to have an accurate valuation of receivables on the balance sheet that will be paid in cash at some point. The aging-of-accounts approach is a more accurate estimate of net accounts receivable as it identifies specific accounts and days past due. PART E: If Pearson anticipates that some accounts will be uncollectible, why did the company extend credit to those customers in the first place? Discuss the risks that managers must consider with respect to accounts receivable.
Pearson extended credit to specific customers as to be unbiased, even if they could reasonably estimate there would be uncollectible amounts. There are risks involved with every business decision, but it is important to recognize when the benefits outweigh the costs. Managers must consider that accounts receivable may not always be paid in full, nor on time; however, the benefit of these sales generally outweigh the risks.
The following information relates to Part F i through iii: Note 22 reports the balance in Pearson’s provision for bad and doubtful debts (for trade receivables) and reports the account activity (“movements”) during the year ended December 31, 2009. Note that Pearson refers to the trade receivables contra account as a “provision.” Under U.S. GAAP, the receivables contra account is typically referred to as an “allowance” while the term provision is used to describe the
! 29
current-period income statement charge for uncollectible accounts (also known as bad debt expense).
PART F(i): Use the information in Note 22 to complete a T-account that shows the activity in the provision for bad and doubtful debts account during the year. Explain, in your own words, the line items that reconcile the change in account during 2009.
Figure 3-1: Allowance for Doubtful Accounts T-Account Allowance for Doubtful Accounts (in millions)
Beginning Balance 72 Exchange Differences 5
Utilised 20 Income Statement Movements 26 Acquisition through Business Combination 3
Ending Balance 76
The line items that reconcile the change include:
Exchange Differences— these differences represent foreign transactions and the differences between currencies when accounts are paid.
Utilised— this line item represents the amount written off for specific accounts. Income Statement Movements— this line item represents the bad debts expense amount on the income statement.
Acquisition through Business Combination— this line item represents the doubtful accounts recognized when a subsidiary or other business is combined with Pearson’s current operations.
! 30
PART F(ii): Prepare the journal entries that Pearson recorded during 2009 to capture 1) bad and doubtful debts expense for 2009 (that is, the “income statement movements”) and 2) the write-off of accounts receivable (that is, the amount “utilised”) during 2009. For each account in your journal entries, note whether the account is a balance sheet or income statement account. The journal entries are as follows. All amounts are in millions of pounds sterling (£).
Bad Debt Expense (Income Statement) 26
Allowance for Doubtful Accounts (Balance Sheet) 26 Allowance for Doubtful Accounts (Balance Sheet) 20
Accounts Receivable (Balance Sheet) 20 PART F(iii): Where in the income statement is the provision for bad and doubtful debts expense included?
The provision for bad and doubtful debts expense, otherwise known as bad debts expense, is located on the income statement under operating expenses. It is specifically located under Selling, General and Administrative Expenses.
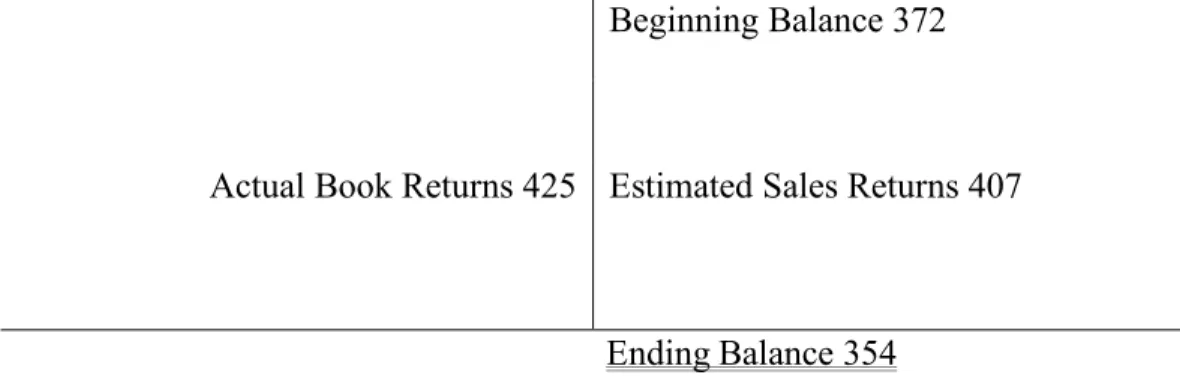
The following information relates to Part G i through iii: Note 22 reports that the balance in Pearson’s provision for sales returns was £372 at December 31, 2008 and £354 at December 31, 2009. Under U.S. GAAP, this contra account is typically referred to as an “allowance” and reflects the company’s anticipated sales returns.
! 31
PART G(i): Complete a T-account that shows the activity in the provision for sales returns account during the year. Assume that Pearson estimated that returns relating to 2009 Sales to be £425 million. In reconciling the change in the account, two types of journal entries are required, one to record the estimated sales returns for the period and one to record the amount of actual book returns.
Figure 3-2: Allowance for Sales Returns and Allowances T-Account Allowance for Sales Returns and Allowances (in millions)
Beginning Balance 372
Actual Book Returns 425 Estimated Sales Returns 407
Ending Balance 354
PART G(ii): Prepare the journal entries that Pearson recorded during 2009 to capture, 1) the 2009 estimated sales returns and 2) the amount of actual book returns during 2009. In your answer, note whether each account in the journal entries is a balance sheet or income statement account.
The journal entries are as follows. All amounts are in millions of pounds sterling (£).
Sales Returns and Allowances (Income Statement) 407
Allowance for Sales Returns and Allowances (Balance Sheet) 407 Allowance for Sales Returns and Allowances (Balance Sheet) 425
Accounts Receivable (Balance Sheet) 425! !
! 32
PART G(iii): In which income statement line item does the amount of 2009 estimated sales returns appear?
Estimated sales returns do not appear in a line item on the income statement, but is instead deducted from the total amount of Sales.
PART H: Create a T-account for total or gross trade receivables (that is, trade receivables before deducting the provision for bad and doubtful debts and the provision for sales returns). Analyze the change in this T-account between December 31, 2008 and 2009. (Hint: your solution to parts f and g will be useful here). Assume that all sales in 2009 were on account. That is, they are all “credit sales.” You may also assume that there were no changes to the account due to business combinations or foreign exchange rate changes. Prepare the journal entries to record the sales on account and accounts receivable collection activity in this account during the year. Figure 3-3: Accounts Receivable T-Account
Accounts Receivable (in millions) Beginning Balance 1342
Sales 5624 Cash Collection 5237
Write-Off of Doubtful Accounts 20 Actual Book Returns 425
Ending Balance 1284 !
! 33
The journal entries are as follows. All amounts are in millions of pounds sterling (£).
Accounts Receivable 5624
Sales 5624
Cash 5237
! 34
! 35
CASE STUDY 4: Time Value of Money—A Step-by-Step Guide
The time value of money is a concept that is extremely important not only for use in accounting applications, but also for many personal applications, such as for planning for retirement or even a future vacation. The time value of money relates to the way investments grow over time with compound interest. The purpose of this report is to show an individual with little to no knowledge of the time value of money how to work a problem step by step. This report will be helpful to these individuals, as it will allow them to apply these concepts when investing.
Through this case I was able to become familiar with time value of money problems. I can apply this valuable knowledge in the future when I begin saving towards retirement, the college funds for my future children, or intend to find the value of a bond and much more. I learned that compound interest greatly
increases the value of an investment, though the original principal may not be touched by the investor for many years at a time. The present value of an annuity is the current value of a series of future payments. The present value of a single sum is the current value of a single sum of money. The future value of an annuity is the value of a series of payments at a future date. The future value of a single sum is the amount an investment will accumulate to by a future date. The following case includes cases of individuals considering the amount of periodic payments needed to invest over a defined period or the lump-sum to invest at a given date to receive a single payment or a series of payments in the future.
! 36
1.! What is the amount of the payments that Ned Winslow must make at the end of each of 8 years to accumulate a fund of $90,000 by the end of the eighth year, if the fund earns 8% interest, compounded
annually?
To work this particular problem, one must begin by classifying whether this amount is a lump sum or an annuity. Since Ned will be making payments each year for 8 years at a rate of 8%, this is an annuity problem. As the payments are at the end of the year and the last cash flow earns zero periods of interest, it is an ordinary annuity. $90,000 is a future value, thus it is a future value ordinary annuity problem. To find the future value of an ordinary annuity for 8 periods at 8%, one must refer to your Future Value of an Ordinary Annuity of 1 table, where in row 8 under the 8% column one would find 10.63663 as the annuity factor. Then one would divide the accumulated fund of $90,000 by the annuity factor, 10.63663. Finally, the amount of $8,461 is found to represent the payment made at the end of each of 8 years.
! 37
2.! Robert Hitchcock is 40 years old today and he wishes to accumulate $500,000 by his sixty-fifth birthday so that he can retire to his summer place on Lake Hopatcong. He wishes to accumulate this amount by making equal deposits on his fortieth through sixty-fourth birthdays. What annual deposit must Robert make if the fund will earn 8% interest compounded annually?
The first step to this problem is determining the number of cash flows and the type of annuity. As the deposits are on his fortieth through fourth birthdays and the $500,000 must be accumulated by his sixty-fifth birthday, this is an annuity due problem with 25 periods as the last cash flow earns one period of interest. $500,000 is a future value, so a future value of an annuity due factor will be used. In the Future Value of an Annuity Due table in row 25 under the eight percent column, one would find the future value of an annuity due factor of 78.95442. Next, one must divide $500,000 by this factor, 78.95442. The amount calculated is $6,332.77, meaning Robert Hitchcock must deposit $6,332.77 on his birthday for the next 25 years.
! 38
3.! Diane Ross has $20,000 to invest today at 9% to pay a debt of $47,347. How many years will it take her to accumulate enough to liquidate the debt?
To begin, one must classify whether this is a single-sum or an annuity problem. As there is only one deposit of $20,000, this is a single-sum problem. The goal of the problem is to find out how many years until her initial investment will reach $47,347, therefore a future value of a single sum factor must be used. To find the factor, one must divide $47,347 by $20,000 to find the factor, which is 2.36735. It is known that the interest rate is nine percent, so on the Future Value of 1 table one would be searching for the value of 2.36735 under the nine percent column. This factor correlates to ten periods at nine percent. This means that it would take Diane’s initial investment of $20,000 ten years to grow to $47,347.
! 39
4.! Cindy Houston has a $27,600 debt that she wishes to repay 4 years from today; she has $19,553 that she intends to invest for the 4 years. What rate of interest will she need to earn annually in order to accumulate enough to pay the debt?
Step one of this problem is to determine whether this is a single-sum or an annuity problem. Since there is only one investment, it is a single-sum problem. As $27,600 is the amount to be repaid 4 years from now, a future value of a single sum factor is used. The factor is found by dividing the amount to be repaid, $27,600 by the initial investment, $19,553. The factor calculated is 1.41155. The investment will gain interest for 4 periods; however the interest rate is unknown. The interest rate is found by looking at the Future Value of 1 table under row 4, searching over to find 1.44258 under the nine percent column. Therefore, for Cindy’s debt of $27,600 to be repaid in 4 years, she must deposit $19,553 at an interest rate of nine percent
! 40
! 41
CASE STUDY 5: Palfinger AG
Palfinger AG is an Austrian manufacturer of hydraulic lifting, loading, and handling solutions, with operations worldwide. Palfinger offers a variety of
products, including cranes, container handling systems, transportable forklifts, and more. The company serves industries that range from construction to
recycling. As an international company, Palfinger prepares its financial statements according to International Financial Reporting Standards (IFRS). The purpose of this report is to examine Palfinger’s Property, Plant, and Equipment to further understand depreciation, capitalization, and other items related to fixed assets.
After reviewing Palfinger’s Property, Plant, and Equipment, I now I have a more in-depth understanding of treatment for fixed assets. This case has also allowed me to view the way international companies record Property, Plant, and Equipment according to IFRS, which helps me to widen my array of knowledge regarding IFRS and GAAP. In addition, applying the different approaches for depreciation and expenditures helped me to learn the difference between straight-line depreciation and double-declining balance depreciation. I learned that the straight-line method is easier to utilize, as the depreciation expense remains fixed over the useful life of a capital asset. I also learned that the useful life of an asset may be difficult to determine and is often an estimate made at management’s discretion. In the future, I will use this new knowledge to ensure property, plant, and equipment are valued and recorded correctly in either my own books or my client’s.
! 42
PART A: Based on the description of Palfinger above, what sort of property and equipment do you think the company has?
As described, Palfinger AG’s core operations include manufacturing hydraulic lifting, loading, and handling solutions. Palfinger caters to a variety of industries such as construction, agriculture, and more. Therefore, there would be a large amount of property, plant, and equipment. An example of property used by the company would be large plants for production and potentially distribution, including preparation of new sites and all land improvements. Within the plants, there would be equipment such as knuckle lifts, bucket trucks, and hydraulic elevators to move the substantially sized products, as well as machinery for production of the items. Equipment may include trucks and other tangible property included in Palfinger’s business operations.
PART B: The 2007 balance sheet shows property, plant, and equipment of €149,990. What does this number represent?
The number €149,990 shown on the balance sheet represents the historical cost of property, plant, and equipment as of 2007, adjusted for depreciation. Depreciation is calculated under the straight-line method, with anticipated useful life of 3-15 years for plant and machinery, 3-10 years for fixtures, fittings, and equipment, and 8-50 years for buildings. Palfinger notes that if a fixed asset is marked for sale, the asset is still included in PPE. The asset is reported at net realizable value less selling costs, and is no longer depreciated. Land, however, is not depreciated. This number also represents all permanent land improvements, such as trees or shrubbery.
! 43
PART C: What types of equipment does Palfinger report in notes to the financial statements?
In the notes to the financial statements, Palfinger reports equipment as a variety of items. They report own buildings and investments in third-party buildings, undeveloped buildings, prepayments and assets under construction, plant and machinery, as well as fixtures, fittings, and equipment. They note that interest on borrowings are not capitalized, so they are not included in PPE. Replacement investments and value enhancing investments are capitalized and depreciated; therefore, they are included in PPE.
PART D: In the notes, Palfinger reports “Prepayments and assets under construction.” What does this sub-account represent? Why does this account have no accumulated depreciation? Explain the reclassification of €14,958 in this account during 2007.
In this case, Palfinger has reported “Prepayments and assets under
construction.” In United States GAAP, this account is known as “Self Constructed Assets” and includes Construction in Process. Self Constructed Assets are built by the company and include the costs associated with materials and labor involved in the construction. As these are not typical buildings, they should not be classified as so, therefore, this account is used. The account does not have accumulated depreciation, as the assets under construction have not entered their useful life. The reclassification of €14,958 in “Prepayments and assets under construction” suggests that Palfinger distributed this amount to property, plant, and equipment
! 44
to reclassify the asset from construction in process to fixed assets. Thus, these assets will begin their useful life and start to be depreciated.
PART E: How does Palfinger depreciate its property and equipment? Does this policy seem reasonable? Explain the trade-offs management makes in choosing a depreciation policy.
Palfinger depreciates its property and equipment through the straight-line depreciation method. The straight-line depreciation method is used as a function of time, not of usage. While Palfinger’s buildings and plants in use may be reasonably estimated through the straight-line method, it is not reasonable for the manufacturing equipment due to inconsistent usage. As Palfinger’s property and equipment are both used within many processes, it is much more appropriate to depreciate these assets based on use. The main advantage of the straight-line method is that it is easy to calculate and is consistent over many years; however, it is much too simple to allocate costs this way for this specific company due to the inconsistent usage. Rather, an activity-based allocation would provide a more accurate depreciation expense.
PART F: Palfinger routinely opts to perform major renovations and value-enhancing modifications to equipment and buildings rather than buy new assets. How does Palfinger treat these expenditures? What is the alternative accounting treatment?
As disclosed in the notes, Palfinger classifies major renovations and value-enhancing modifications as capital expenditures. These replacement investments and value-enhancing investments are capitalized and then depreciated as a part of
! 45
the enhanced or modified asset. The assets are depreciated over the new or original useful life. There are two alternatives to this accounting treatment. The first alternative is the substitution approach, which is appropriate if the carrying amount of the old asset is readily available. The cost of the old asset is then replaced with the cost of the new asset. The second alternative is to charge to accumulated depreciation. This option is used when the company does not improve the asset itself, but extends the useful life. This is not the case for
Palfinger; therefore, the capitalization of the renovations and modifications is the correct approach.
The following information relates to Part G i through iv: Use the information in the financial statement notes to analyze the activity in the “Property, plant and equipment” and “Accumulated depreciation and impairment” accounts for 2007. Determine the following amounts:
PART G(i): The purchase of new property, plant and equipment in fiscal 2007.
€61,444 represents the cost of the purchase of new property, plant and equipment in fiscal 2007. This amount is the total cost of additions in 2007, less the cost of additions for prepayments and assets under construction.
PART G(ii): Government grants for new purchases of new property, plant and equipment in 2007. Explain what these grants are and why they are deducted from the property, plant, and equipment account.
Government grants would total €733 and are deducted from “Land and buildings” and “Plant and Machinery.” Government grants may be given in the
! 46
form of assets and may be set up in one of two ways. The grant may be presented as deferred income, or in the case of Palfinger, deducted from the carrying amount of the asset. Through these government grants, Palfinger is physically receiving resources and assets, rather than a monetary grant.
PART G(iii): Depreciation expense for fiscal 2007.
The depreciation expense for fiscal 2007 is €12,557. This was calculated using the straight-line depreciation method, with regard to the useful life of each category of PPE, as disclosed in the notes and mentioned earlier in this report. PART G(iv): The net book value of property, plant, and equipment that Palfinger disposed of in fiscal 2007.
The net book value of property, plant, and equipment that Palfinger disposed of in fiscal 2007 was €1,501. The net book value is calculated by subtracting the depreciation of disposals in 2007, €12,298, from the value of Disposals in 2007 at acquisition cost, €13,799.
PART H: The statement of cash flows (not presented) reports that Palfinger received proceeds on the sale of property, plant, and equipment amounting to €1,655 in fiscal 2007. Calculate the gain or loss that Palfinger incurred on this transaction. Hint: use the net book value you calculated in part g iv, above. Explain what this gain or loss represents in economic terms.
As the net book value of disposal of property, plant, and equipment is €1,501, Palfinger will incur a gain on sale of €154. In economic terms, a gain arises when a company sells or disposes of an asset at a price higher than the
! 47
current value of the asset. The proceeds of €1,655 is more than the book value of €1,501, therefore Palfinger will recognize a gain.
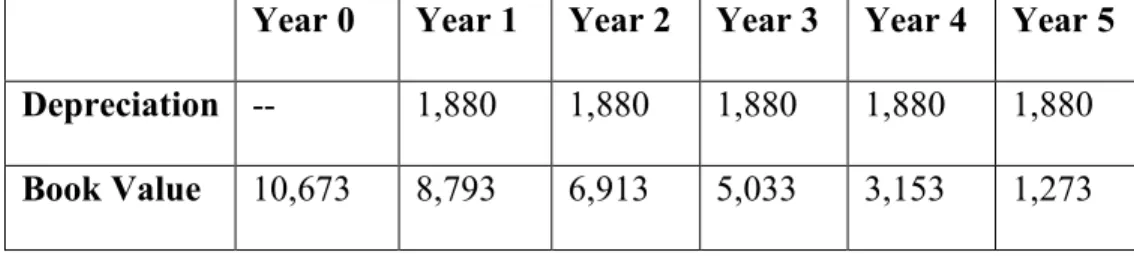
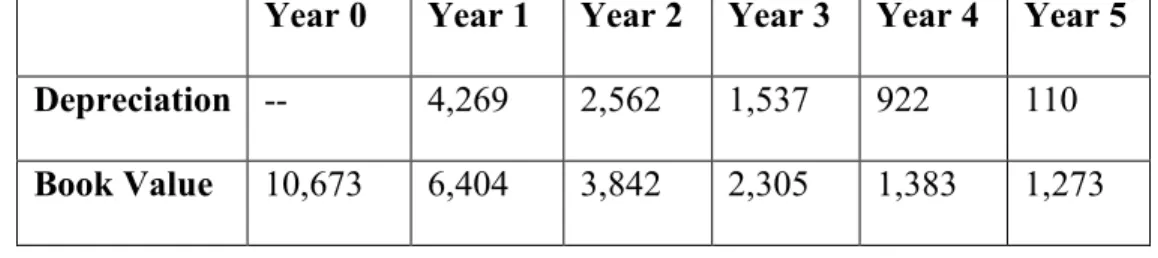
PART I: Consider the €10,673 added to “Other plant, fixtures, fittings, and equipment” during fiscal 2007. Assume that these net assets have an expected useful life of five years and a salvage value of €1,273. Prepare a table showing the depreciation expense and net book value of this equipment over its
expected life assuming that Palfinger recorded a full year of depreciation in 2007 and the company uses:
a)! Straight-line depreciation.
The depreciation expense using the straight-line method is calculated by subtracting the salvage value of €1,273 from the cost of €10,673, divided by the five-year useful life.
Figure 5-1: Straight-Line Depreciation Table
Year 0 Year 1 Year 2 Year 3 Year 4 Year 5 Depreciation -- 1,880 1,880 1,880 1,880 1,880 Book Value 10,673 8,793 6,913 5,033 3,153 1,273
b)! Double-declining-balance depreciation.
The depreciation expense calculation using the double-declining-balance method is more complex than with the straight-line method. First, the depreciable base must be found by taking the salvage value of €1,273 and subtracting that from the purchase price of €10,673, which amounts to a depreciable base of €9,400. After dividing the base by the five-year useful
! 48
life, depreciation expense is found to be €1,880. The straight-line depreciation rate is then calculated by dividing the depreciation expense of €1,880 by the depreciable base of €9,400. This rate is equal to 20%. As this is the double-declining depreciation method, the depreciation rate is multiplied by two for a depreciation rate of 40%. This rate is multiplied by the new book value calculated each year.
Figure 5-2: Double-Declining-Balance Depreciation Table
Year 0 Year 1 Year 2 Year 3 Year 4 Year 5 Depreciation -- 4,269 2,562 1,537 922 110 Book Value 10,673 6,404 3,842 2,305 1,383 1,273
PART J: Assume that the equipment from part i. was sold on the first day of fiscal 2008 for proceeds of €7,500. Assume that Palfinger’s accounting policy is to take no depreciation in the year of sale.
a)! Calculate any gain or loss on this transaction assuming that the company used straight-line depreciation. What is the total income statement impact of the equipment for the two years that Palfinger owned it? Consider the gain or loss on disposal as well as the total depreciation recorded on the equipment.
Using the straight-line method, the net book value at the end of year one is €8,793. The net book value less the net proceeds of €7,500, amounts to a disposal loss of €1,293. The total income statement impact of the equipment for the two years that Palfinger owned it would be the initial disposal loss of
! 49
€1,293 plus another year of depreciation, €1,880, for a total impact on the income statement of €3,173.
b)! Calculate any gain or loss on this transaction assuming the company used double-declining-balance depreciation. What is the total income statement impact of this equipment for the two years that Palfinger owned them? Consider the gain or loss on disposal as well as the total depreciation recorded on the equipment.
Using the double-declining-balance method, the net book value at the end of year one is €6,404. The net book value subtracted by proceeds of €7,500, give a total disposal gain of €1,096. Once this number is subtracted from the depreciation expense of €4,269, the impact recognized is €3,173.
c)! Compare the total two-year income statement impact of the equipment under the two depreciation policies. Comment on the difference.
The total two-year income statement impact of the equipment under the two depreciation policies is exactly the same, €3,173. Although two different methods were used to calculate this number, they value the depreciation at the same amount.
! 50
! 51
CASE STUDY 6: Volvo Group
Volvo Group, headquartered in Sweden, is a supplier of commercial vehicles, construction equipment, engines, drive systems, and aircraft engine components. To remain ahead of their competition, Volvo invests approximately 13 billion Swedish Krona in research and development (R&D). Volvo focuses on technological advances to reduce impact on the environment as well as a variety of other breakthroughs. This case is centered around Volvo’s research and
development activities and how they are reflected on various financial statements. Prior to this case, I had little knowledge of R&D and did not know how it was to be capitalized, expensed, and amortized. This case goes into depth on R&D and allowed me to learn the differing ways to report expenses related to R&D. After reviewing Volvo Group, I have a greater understanding of research and development and the many ways it can be reported. I learned that research and development is a large aspect in continuing innovation of a company that will lead to increased profits and a stronger future for a company. According to IFRS, R&D costs may be capitalized and amortized over the applicable periods of use. Not all of the cost is incurred as an expense or “used up” in a given period under the IFRS method in contrast to the GAAP method, which may be beneficial in accurately reporting the value of a company. I now understand more about the differences between United States GAAP and IFRS related to capitalization and expenditures of certain costs. In the future, I can use this knowledge to help with audits, or to aid others who may be unsure of how to report their research and development costs.
! 52
PART A: The 2009 income statement shows research and development expenses of SEK 13,193 (millions of Swedish Krona). What types of costs are likely included in these amounts?
As Volvo Group focuses on being at the forefront of technological
advances, research and development is a large part of their expenses. A variety of costs may be included in these amounts to accomplish these breakthroughs. Types of costs likely included in these R&D amounts are materials, equipment, facilities, personnel, purchased intangibles, contract services, and indirect costs.
PART B: Volvo Group follows IAS 38- Intangible Assets, to account for its research and development expenditures (see IAS 38 excerpts at the end of this case). As such, the company capitalizes certain R&D costs and expenses others. What factors does Volvo Group consider as it decides which R&D costs to capitalize and which to expense?
When making the decision on which R&D costs to capitalize and which to expense, Volvo Group considers many factors. These factors include whether there is a high degree of certainty that expenditures will result in future financial benefits, and if it is possible to prove the technical functionality of a new product before its development is reported as an asset. To be reported as an asset and capitalized, these conditions must be met. In addition, expenditures may only be capitalized during the industrialization phase of a product development project.
! 53
PART C: The R&D costs that Volvo Group capitalizes each period (labeled Product and software development costs) are amortized in subsequent periods, similar to other capital assets such as property and equipment. Notes to Volvo’s financial statements disclose that capitalized product and software development costs are amortized over three to eight years. What factors would the company consider in determining the amortization period for particular costs?
In determination of the amortization period for particular costs, the company would consider the estimated amount of time the costs would provide financial benefits to the company, otherwise known as its useful life. The costs may be applied to multiple accounting periods as the costs are utilized for the research and development purpose.
PART D: Under U.S. GAAP, companies must expense all R&D costs. In your opinion, which accounting principle (IFRS or U.S. GAAP) provides financial statements that better reflect costs and benefits of periodic R&D spending?
In my opinion, IFRS does a better job of reflecting costs and benefits of periodic R&D spending, as it gives the company the option to capitalize the costs as an asset. In doing so, the benefit is recognized more clearly than if it was purely charged as an expense. R&D costs increase the value of the company’s assets within IFRS, as they are beneficial in furthering company innovation. Although there is a benefit, only 3-5% of projects result in revenue. Therefore, the U.S. GAAP procedure of expensing R&D costs is just as acceptable.
! 54
PART E(i): What is the amount of the capitalized product and software development costs, net of accumulated amortization at the end of fiscal 2009? Which line item on Volvo Group’s balance sheet reports this intangible asset?
At the end of fiscal 2009, the amount of capitalized product and software development costs net of accumulated amortization at the end of fiscal 2009 is SEK 11,409. The line item on Volvo Group’s balance sheet that reports this intangible asset is Intangible Assets; however, this line item includes other intangibles as well. These other items include patents, trademarks, and Goodwill. PART E(ii): Create a T-account for the intangible asset “Product and
software development,” net of accumulated amortization. Enter the opening and ending balances for fiscal 2009. Show entries in the T-account that record the 2009 capitalization (capital expenditures) and amortization. To simplify the analysis, group all other account activity during the year and report the net impact as one entry in the T-account.
Figure 6-1: Product and Software Development T-Account
Product and Software Development (in SEK millions) Beginning Balance 12,381 3,126 Amortization Amounts Capitalized 2,602 448 Adjustment
! 55
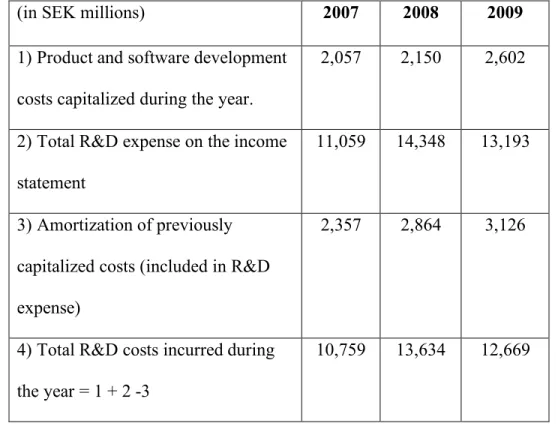
PART F(i): Complete the table below for Volvo’s Product and software development intangible asset.
Figure 6-2: Product and Software Development Intangible Asset Table
(in SEK millions) 2007 2008 2009
1) Product and software development costs capitalized during the year.
2,057 2,150 2,602
2) Total R&D expense on the income statement
11,059 14,348 13,193
3) Amortization of previously capitalized costs (included in R&D expense)
2,357 2,864 3,126
4) Total R&D costs incurred during the year = 1 + 2 -3
10,759 13,634 12,669
PART F(ii): What proportion of Total R&D costs incurred did Volvo Group capitalize (as product and software development intangible asset) in each of the three years?
To calculate the portion, product and software development costs capitalized during the year are divided by total R&D costs incurred during the year. The proportions for 2007, 2008, and 2009 were 19.12%, 15.77%, and 20.54%, respectively.
! 56
PART G: Assume that you work as a financial analyst for Volvo Group and would like to compare Volvo’s research and development expenditures to a U.S. competitor, Navistar International Corporation. Navistar follows U.S. GAAP that requires that all research and development costs be expensed in the year they are incurred. You gather the following information for
Navistar for fiscal year end October 31, 2007 through 2009. Figure 6-3: Navistar Research and Development Comparative Table
PART G(i): Use the information from Volvo’s eleven-year summary to complete the following table:
Figure 6-4: Volvo Net Sales and Total Assets Table
(in SEK millions) 2007 2008 2009
Net sales, industrial operations 285,405 303,667 218,361 Total assets, from balance sheet 321,647 372,419 332,265
(in US $ millions) 2007 2008 2009
Total R&D costs incurred during the year, expensed on the income statement
375 384 433
Net sales, manufactured products 11,910 14,399 11,300
Total assets 11,448 10,390 10,028