1
ASHESI UNIVERSITY
USING ANALYTICAL CRM SYSTEM TO REDUCE CHURN IN THE
TELECOM SECTOR: A MACHINE LEARNING APPROACH
APPLIED PROJECT
B.Sc. Computer Science
Faith Mueni Kilonzi
2019
Page | 1
Branding and Identity Guide
The Ashesi brand and logo are integral parts of our worldwide image and identity. We must be careful of how and where the Ashesi is used to ensure we maintain the integrity of our organization. This guide has been developed to help you clearly understand our policies towards the use of the Ashesi logo in a variety of mediums, as well as type faces and a color palate to help you produce materials that maintain the brand’s integrity. We would request that you seek approval from the Ashesi University College Marketing Committee before creating any media that reproduces the Ashesi logo.Contents
The Logo ... 2Using the Logo ... 3
Clear Space and Logo Design ... 5
Unacceptable Logo Uses ... 6
The Ashesi Seal ... 7
Color Palette ... 8
Fonts... 8
2
ASHESI UNIVERSITY
USING ANALYTICAL CRM SYSTEM TO REDUCE CHURN IN THE TELECOM SECTOR: A MACHINE LEARNING APPROACH
APPLIED PROJECT
Applied Project submitted to the Department of Computer Science, Ashesi
University in partial fulfilment of the requirements for the award of
Bachelor of Science degree in Computer Science.
Faith Mueni Kilonzi
April 2019
i I hereby declare that this applied project is the result of my own original work and that no part of it has been presented for another degree in this university or elsewhere.
Candidate’s Signature:
……… Candidate’s Name:
……… Date: ………
I hereby declare that preparation and presentation of this applied project were supervised in accordance with the guidelines on supervision of applied project laid down by Ashesi University. Supervisor’s Signature: ……… Supervisor’s Name: ……… Date: .………
ii
ACKNOWLEDGEMENT
My sincere gratitude to my supervisor, Stephane Nwolley and the other faculty members of Ashesi University for their invaluable guidance, comments, and suggestions throughout the course of this project.
I would also like to thank my well-wishers, parents and friends who helped me in my pursuit for my undergraduate degree.
iii
ABSTRACT
Customers are considered to be the most valuable assets of any business, and thus their loyalty is key to profitability as they indulge in repeat purchases and attract their colleagues through word-of-mouth. In competitive markets such as telecommunications, customers have a lot of flexibility due to the variety of service providers available and the introduction of mobile number portability (MNP) thus they can easily switch services and service providers. Customer churn is, therefore, a major problem among telecommunication companies hence their quest to reduce customer churn rate and retain an existing customer. Customer relationship management systems have been used over the years to track patterns within the customer data, but this could be improved notably with the technological advances hitting the universe on a daily basis. We have moved past the age of innovations around steam engines, electricity, computers, mobile, internet to the current technology trends in artificial intelligence and big data. We are at the cusp of a new wave where enterprises have embraced the application of machine learning in streamlining different business processes. Telecom companies have the advantage of mining large customer datasets that can be leveraged on for predictive analysis using data science. This project explores the use of analytical CRM system in reducing customer churn in the telecom industry using machine learning algorithms to predict customer behavior in order to retain them. Its goal is to analyze all relevant customer data and develop focused customer retention programs. This is on the focus that if you could somehow predict in advance which customers are at risk of leaving, you could develop focused customer retention programs to reduce customer churn.
iv TABLE OF CONTENTS DECLARATION ... i ACKNOWLEDGEMENT ... ii ABSTRACT ... iii TABLE OF CONTENTS ... iv LIST OF FIGURES ... vi CHAPTER 1: INTRODUCTION ... 1 1.1 Background ... 1 1.2 Problem statement ... 3 1.3 Project Objectives ... 4 1.4 Related Work ... 4
CHAPTER 2: REQUIREMENTS SPECIFICATIONS ... 7
2.1 Requirements Overview ... 7 2.3 Requirements Analysis ... 8 2.3.1 System Requirements ... 8 2.3.2 Non-functional requirements ... 8 2.3.3 Functional requirements ... 9 2.4 Use Cases ... 10
CHAPTER 3: SYSTEM DESIGN AND ARCHITECTURE ... 13
3.1 Overview... 13
3.2 System Architecture ... 13
3.2.1 The Model View and Controller ... 14
3.2.2 Data-Centered Architecture ... 15
3.3 Framework ... 15
3.4 Software Modules ... 15
3.4.1 Task Management Module ... 16
3.4.2 User Management Module ... 16
3.4.3 Data Upload Module ... 16
3.4.4 Data Visualization Module ... 16
3.4.5 Data Preprocessing Module ... 16
3.4.6 Modelling Module ... 17
v 3.4.8 Results Module ... 17 3.5 Class Diagrams ... 17 3.6 Activity Diagrams ... 18 CHAPTER 4: IMPLEMENTATION ... 20 4.1 Overview... 20
4.2 Implementation Tools and Technologies ... 20
4.2.1 Languages ... 20
4.2.2 Frameworks ... 21
4.2.3 Libraries ... 21
Data analytics and machine learning libraries: ... 22
4.3 Backend... 23
4.4 Environment Setup ... 23
4.6 Flask dependencies and libraries imported ... 24
4.7 Implementation Design and techniques ... 25
CHAPTER 5: TESTING ... 31 5.1 Testing Overview ... 31 5.2 Development Testing ... 31 5.2.1 Unit Testing ... 31 5.2.2 Component Testing ... 31 5.2.3 System Testing ... 32 5.3 Release Testing ... 32 5.4 User Testing ... 32
5.4.1 Test Case: Login into the system ... 33
4.4.2 Test Case: Logout of the system ... 33
Test 5.4.3 test case: Adding a new user ... 34
Test 5.4.4 test case: Removing a user from the system ... 35
Test 5.4.5 test case: Updating a user in the system ... 36
Test 5.4.6 test case: Analyzing Customer data ... 37
CHAPTER 6: RECOMMENDATIONS AND CONCLUSION ... 38
6.1 Recommendations and future work ... 38
6.2 Conclusion ... 39
References... 40
vi
LIST OF FIGURES
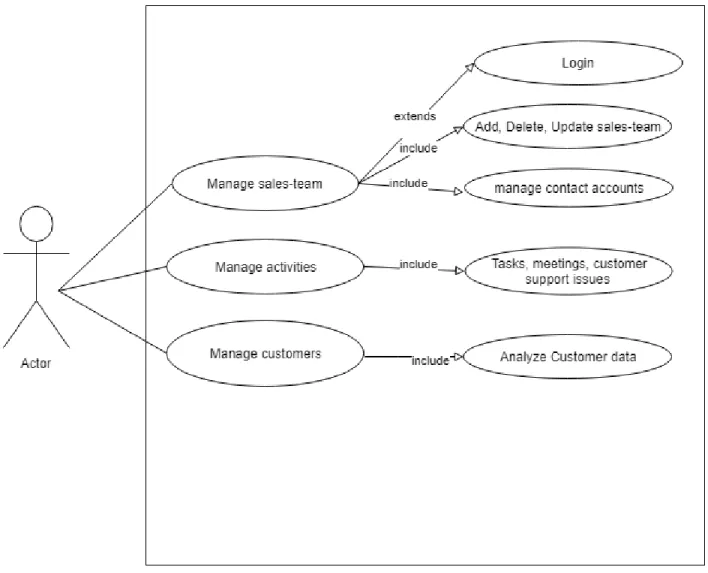
Figure 1 Use case diagram for CRM component ... 11
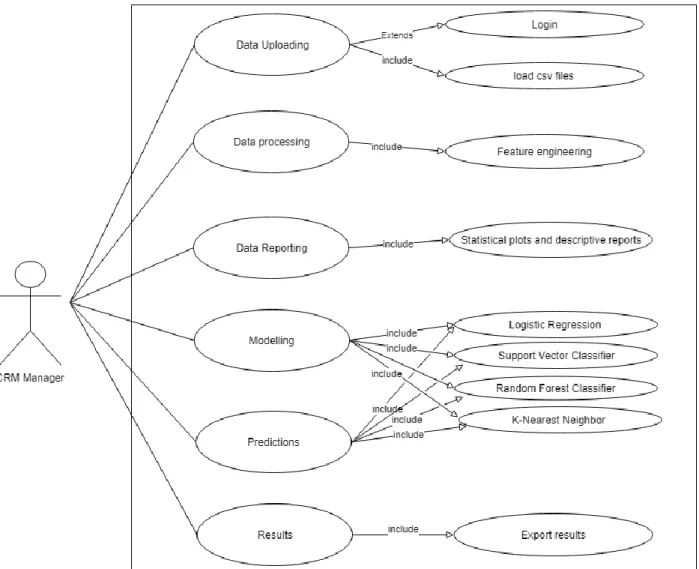
Figure 2 Use case diagram for customer data analytics ... 12
Figure 3 System overview ... 13
Figure 4 MVC architecture (Source: Sommerville Software Engineering) [1] ... 14
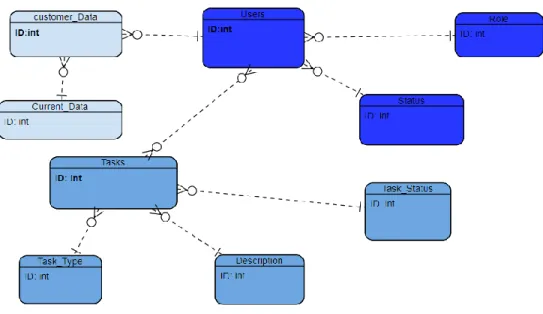
Figure 5 Extended Entity Diagram for the database design and representation ... 18
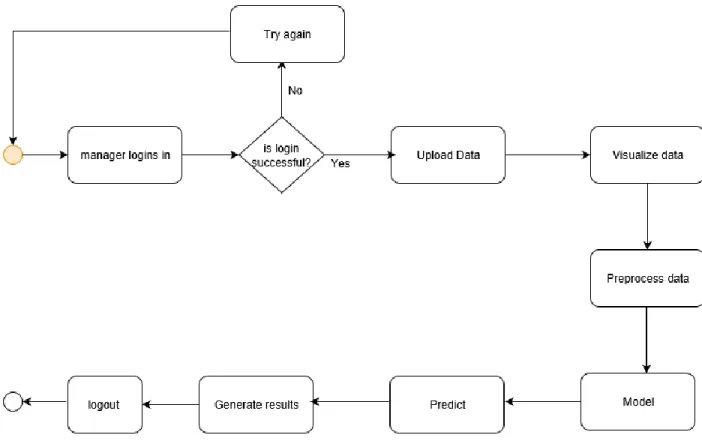
Figure 6 Activity diagram for CRM management ... 18
Figure 7 Activity diagram for customer data analytics ... 19
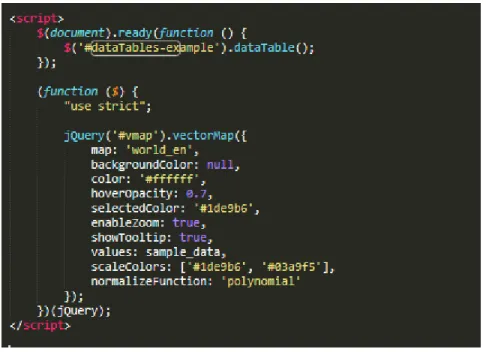
Figure 8 An example of jQuery in use ... 22
Figure 9 Flask dependencies and libraries imported ... 24
Figure 10 The login page of the user. ... 25
Figure 11 The landing dashboard ... 25
Figure 12 User management module ... 26
Figure 13 Updating user module ... 26
Figure 14 Deleting user module... 27
Figure 15 Task management module ... 27
Figure 16 Data analytics: uploading datasets interface ... 28
Figure 17 Visualization of Data interface ... 28
Figure 18 Churn prediction results ... 29
Figure 19 Data preprocessing sample code ... 30
Figure 20 Random forest classifier sample code ... 30
Figure 21 Initialization and activation of the virtual environment ... 42
Figure 22A sample output of the algorithm prediction. Confusion matrix of logistic regression ... 43
1 1.1Background
We have all in one way or another, been customers of a certain product or service and paid for that particular product or service subscriptions. Customers pay for the quality of the product/service mostly and how the provider treats them determines whether they will stay loyal to the provider or not. The customers are considered one of the most critical asset for any business in numerous dynamic and competitive industry[3] [4] There has been a high rate of customers switching service or even the provider in competitive markets where customers have a wide variety of choices of service providers. Such propensity where customers switch their subscriptions from one service provider to another is known as customer churn. [5] Telecommunications is an industry founded on the phenomenon of churn. It experiences an average of 30-35 percent annual churn rate.[6] Additionally, It has been reported that the associated cost of acquiring a new customer is often more than retaining the existing customers with the cost range going as much as 5-10 times. [5] This means that churn is not only an inevitable part of operating a telecommunication company, but it is also a costly experience.
The telecom industry is one of the fastest growing and most significant business in the world. The sector is historical, very capital-intensive due to fixed costs associated with standard digital transformations. Therefore, most telecom service operators face a lot of pressure in controlling their variable costs, particularly human capital. Over the past years, the telecom market has grown into a state of saturation and fierce competition which has intensified the tension surrounding profitability among telecom service providers. The telecom customers have the freedom to choose from multiple service providers especially with the introduction of the Mobile Number Portability (MNP) where customers can port their phone numbers from one
2 network provider to another. For instance, in Ghana, 21,000 users switched service providers 25 days after the implementation of the MNP service.[7] This number has since grown into hundreds of thousands new annual subscriptions. Thus, customers actively demand better services at low prices. The service providers focus on customer retention as the key business goal for revenue optimization and profitability by meeting customers’ service quality expectations. The focus of the telecom sector has therefore shifted from acquiring a new customer to retaining existing customers because of the associated high cost of acquiring new customers.
While it is easier for a customer to switch among mobile service providers, this comes at a cost to the company from which the customer is churning. The most significant consequence of customer churn is in the loss of revenue in the company. Some companies try to reduce customer churn by lowering prices through retention campaigns without logically analyzing the underlying factor leading to the customer churn and therefore end up cutting their revenues. The main concern lies in the question of how telecom service providers can move beyond traditional primary sales-tracking customer relationship management (CRM) systems to robust analytical CRM platforms designed to unify insights around customer interactions and transaction processing to reduce customer churn. The CRM is a marketing and customer service where the service providing organization focuses on developing and maintaining a long-term relationship with the customer. The organization identifies the repeat customers of their product or service then uses this data to gather insights on how to convert the customers into clients. Therefore, CRM is the key to better customer relationships in an organization.
With the emergence of artificial intelligence (AI) and big data technologies, telecom companies need to tap into the power of customer data to better manage customer relationships
3 which would help them analyze and make profitable decisions including customer retention ways. Tractica, an analyst firm predicts that the AI enterprise will grow revenue from $644 million up to $39 billion by 2025.[8] This is because AI is often injected in various modern applications and technology innovations thus enabling companies to maximize some core business operations while improving customer experience and employee productivity as well as growing revenue streams. Even though the trends in data science and artificial intelligence are relatively new, the original concepts of extracting value from data have been there for a long time. With the discovery around big data, companies are leveraging on the use of machine learning and data science techniques to optimize the value extraction from the existing data. Enterprises can now analyze the previously untapped data sources independently or together with the existing enterprise data to gain new insights and thus maximizing the business value.[9]
The explosive growth of data in the globe across economic sectors has led to rapid development and diffusion of digital media technologies especially in developed countries such as China and the United States. According to the McKinsey Global Institute research report, ‘the use of big data will underpin the waves of productivity and consumer surplus across the companies which leverage its power.’[9]With the great advancements surrounding AI and big data, there is the need for telecommunications companies to tap into the constant customer connectivity and data flow involving customer relationships to invest in intelligent CRM systems for customer churn reduction.
1.2 Problem statement
The Ghanaian telecommunication industry has grown into a competitively saturated market especially because of high penetration rate and technological advancements in the digital information sector. As per the National Communications Authority report in July 2018, at the end of July 2018, the total number of mobile voice subscriptions was 40,089,004, which
4 represents a percentage increase of 1.83% from June 2018’s figure of 39,367,236. [10] The total penetration rate for the month under review was 137.38%.[10] [6]These trends in the industry cause companies to face the problem of churning which is also contributed by the wireless mobile number portability policy. Therefore, it is of great essence for Ghanaian and sub-Saharan African telecommunication companies to adopt a system and an effective method of customer retention of the existing customers since the cost of acquiring a new customer is usually higher than retaining an existing one.
Using data analytics platform to predict churn in telecommunications companies will enable the company to predict which customers are at the risk of leaving and then device target solutions and incentives to retain them which would save the company the revenue lost in churn and the subsequent customer re-acquisition. The facts described above ultimately stipulate that the customer churn prediction is an indispensable part of the competitiveness of telecom companies staying relevant in the market and maintaining an effective and analytical CRM.
1.3 Project Objectives
This project’s focus is to build an intelligent, analytical CRM system for the telecom sector to reduce customer churn. The project also seeks to take a new approach based on original CRM concepts while adding the idea of applying machine learning in customer data analytics. In addition to the traditional CRM subsystem functionalities such as customer care support and task management, we incorporate a churn prediction functionality which uses a machine learning approach to give insights surrounding customer experiences.
1.4 Related Work
Using analytical CRM systems to solve customer churn is not an uncommon endeavor in the technology world and especially among the well-established companies in the developed
5 nations. There are, in fact, other CRM systems that have been implemented such as Salesforce, Oracle’s NetSuite, SugarCRM, Microsoft Dynamics CRM, Sage CRM, and SAP All-In-One CRM. Although all these CRM systems solve the problem of customer relationship management and data analytics well, none of them is focused specifically on the telecom sector. Salesforce is a world’s leading CRM platform that uses cloud-based applications for sales, service, and marketing. It uses the Amazon Web Services (AWS) cloud services to transform enterprise datasets into useful insights through churn analysis using machine learning models. Telecom companies may leverage this platform to manage customer relations and predict churn. However, Salesforce CRM is expensive as it includes implicit costs; it has limited deployment options, a limited number of international data centers and the companies’ employees require extensive training to learn the system.
Most shortcomings of the existing solutions are complexity, pricing, and integration into existing software systems. Despite these successes in the current stated works, there are a few shortcomings especially in their application within the small companies in sub-Saharan Africa and Ghana. For instance, their usability is quite complicated which is additional work to the user especially when they are learning how to use them.
Most of these systems are built using a more generalized approach which does not focus on a particular case such as churn prediction and analysis; hence algorithm optimization is not much of a priority. Additionally, although these approaches achieve the set goals of customer relationship management and data analytics, they are not modular and portable enough to be integrated into the existing business software system without significant setup costs. In this project, a solution that is modular, cheap and portable, and will cater for both small-scale and large-scale businesses would be developed. The project will be implemented in simple yet
6 powerful tools to give data analytics power to the client while enabling them to achieve efficient results through our intelligent CRM platform.
7
CHAPTER 2: REQUIREMENTS SPECIFICATIONS
2.1 Requirements Overview
This section describes the feature specifications of what the analytical customer relationship management system should do and all the underlying constraints regarding its different functionalities. The requirements of a system would also be elicited to define in detail, how efficiently it should be made to work according to the system needs.
The principal users of this analytical CRM system include marketing department, technical personnel and data managers who directly or indirectly deal with customer issues and data.
2.2 Requirements Elicitation
The observational study, secondary research, and interviews were the fundamental techniques used for requirements gathering and elicitation. Some of the primary resources used for this include exploration of the existing analytical CRM systems from crucial stakeholders, companies and individual clients in the telecom sector as well as the evaluation of various machine learning models and their data mining techniques. The insights gained during the study were compiled into requirements and analyzed for this project while trying to improve the existing systems and bringing the most effective analytical CRM system into the market. Some of the information sorted from the resources include:
• How does a telecom company keep track of customer data?
• How can a telecom company leverage on customer data to gather insights and manage customer relationships?
• What are efficient data mining and analytics approaches that help predict customer churn?
8 • How can machine learning models be optimized to make best an analytical CRM system
more intelligent to reduce customer churn? 2.3 Requirements Analysis
2.3.1 System Requirements
• The CRM should be able to archive information without deletion and allow new datasets while maintaining historical data reports.
• The CRM should be able to accurately control data access based on the user permissions assigned for every category of users.
• The CRM should be able to store data persistently.
• The CRM system should allow uploading of new datasets and their analysis. • The CRM system should support all kinds of browsers.
• The CRM system should generate data reports and support results’ saving.
2.3.2 Non-functional requirements
According to Sommerville, non-functional requirements do not relate directly to specific services of the system, but they are underlying attributes that ensure system’s functionality efficiency. [2] The non-functional requirements considered in this project include: performance, usability, availability, data persistence, authentication and security, and model optimization.
• Performance requirement: Users of this system will require active internet connection running through a compatible web browser to access this web application.
• Usability requirement: The system is implemented using very user-friendly and responsive frameworks and interfaces. Novice users would be able to use the system comfortably and with few system errors.
9 • Data Persistence: the CRM system should have a centralized database system that allows storage of huge datasets persistently. It should enable data archiving without deleting it permanently, and the system should be secure enough with backup.
• Authentication and security: All the users of the system should be authenticated before they log onto the system to ensure secure data access. The records should be encrypted for extra security.
• Model optimization and accuracy: Several machine learning models, are available for data analytics, from which the best model will be used to generate the analytics reports. The models’ hyperparameters should be tuned to ensure that the models are optimized enough, and their accuracy improved.
2.3.3 Functional requirements This CRM system product will:
• Manage Contacts: The system will have a centralized functionality of synchronizing all its users using access permissions as well the customers. The CRM manager, will create, view, update and delete users from the system and assign roles and tasks to them. • User account management: The system administrators have the privilege of creating
and updating the users’ account passwords.
• Manage Tasks: The various tasks, and customer support issues will be managed to ensure task allocation and task-status tracking. The various users will resolve problems and update tasks assigned to them accordingly.
• Analyze customer data: The system will analyze the customer data fed through datasets using various machine learning algorithms- logistic regression, random tree
10 classifiers, and neural networks to generate insights on customer churn rates. Different activities under data analytics include:
o Load data- the user will be able to upload datasets in the form of CSV and excel spreadsheets for analytics into the system.
o Visualize data-the user will use the input data to plot the data statistically and inferentially.
o Pre-process data- the user will take the input data and clean it by removing duplicates, feature selection, and engineering, column merging and removing empty cells to ensure accurate modelling.
o Build models-the user will then choose from a list of models such as list logistic regression, k-nearest neighbor, random forest classifier and support vector machine classifier to build models for data analytics. The user would regularize the training data features and tune parameters for accurate model building. o Make customer churn predictions- the user will be able to use the constructed
model to make projections of the customers who are likely to leave the service. o Save results- the user will be able to view the results of the predictions and save
the reports. 2.4 Use Cases
Use case diagrams are used to define the interactive actions of the system’s user. The following figures (Figure 2.1 and Figure 2.2) outline the list of activities the CRM manager engages in the CRM management and data analytics components respectively.
11
12
13
CHAPTER 3: SYSTEM DESIGN AND ARCHITECTURE
3.1 Overview
This section discusses the high-level system architectural, human interface and the architectural design of the analytical CRM system. It also provides an outline of the reasons for the choice of the different tools and the limitations of the chosen design and architectural paradigm.
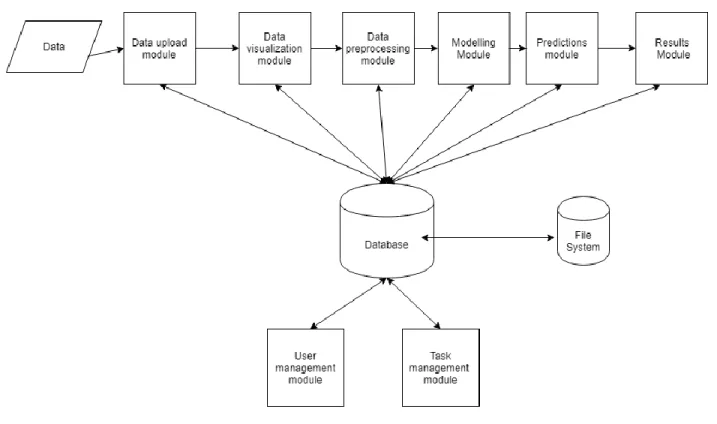
Figure 3 System overview
3.2 System Architecture
The architectural design of this system follows a combination of the Model-View-Controller (MVC) and the data-centric repository pattern. Since this system is a web-based application, MVC architecture design is recommended because it enables separation of modules and modular code implementation.[2]
14 3.2.1 The Model View and Controller
The MVC architecture has been known for its standard use in the industry especially in its user-interaction management in software projects especially web applications. It is a three-way factoring pattern where an application is divided into three logical components: models, views and controllers. The Model component is used to simulate the application domain where it manages all the data stored in the system. It also interfaces the system database with all the components integrated with the system to facilitate data operations. The View component is used to display and define how the data retrieved from the database is presented to the users on the interface. The Controller component is a link through which user’s interaction with the database and the interface is done. The MVC architecture was used in this project because it increases modularity in software development by providing a flexible way of modifying different application modules independently which also helps in code reuse. MVC’s primary advantage is its ability to improve the scalability and maintainability of large applications by separating modules more intuitively.[2]
15 3.2.2 Data-Centered Architecture
This system’s main analytical functionality depends heavily on vast amounts of data and hence need for a robust architecture that would accommodate that. In data-centered architecture, the data is accessed frequently from a central repository for modifications and sharing. Data is fed into the system using datasets; then it is stored in a central repository, and different directories are made for analytics purposes. Various components of the systems such as reporting module depend on the centralized data repository to display the various data reports and insights.
3.3 Framework
This project was implemented on a Flask microframework written in Python. Flask ensures efficiency and simplicity when using Python for scripting and routing through URL redirection. It has a built-in development server and a fast debugger with integrated unit-testing support. It also ensures security and privacy of data through client-side sessions support through secure cookies. In this project, Python was essential in data analytics especially because it supports several machine-learning and statistical libraries. Flask framework also supports Jinja2 templating where HTML web pages can be customized and filled in using the Bootstrap front-end framework. Bootstrap framework is quite efficient in creating responsive web applications and standard styling of web pages.
3.4 Software Modules
As outlined in Figure 3.1, the analytical CRM system is divided into two main components: the CRM management system and data analytics component. Under each component, there are several modules. The CRM management component has two main modules: activities(task) management module and user management module. The data analytics
16 component is divided into five modules, data uploading, visualization-reprocessing, modelling, prediction and results module.
3.4.1 Task Management Module
The CRM manager creates, views, edits, deletes and assigns tasks to the responsible sales-team personnel to resolve them. The different activities could be meetings, customer support issues, and other management notification tasks’ status.
3.4.2 User Management Module
The CRM manager creates and updates the users of the system and assigns them to their respective roles in the system.
3.4.3 Data Upload Module
The CRM manager uploads customer dataset files into the system through the data upload module. The uploaded data serves as the input to different system modules such as visualization and preprocessing modules.
3.4.4 Data Visualization Module
The uploaded data is visualized using different statistical inferential and descriptive methods through the data visualization module. In this module, data plots in the form of graphs and tables are displayed.
3.4.5 Data Preprocessing Module
This module is responsible for cleaning the input data, handling duplicates, outliers and column merging and encoding into required data types. Tokenization and feature engineering of different data attributes are also done here to prepare the data for efficient and uniform training of data for modeling. Thus, the preprocessed data is used as input for the modelling module.
17
3.4.6 Modelling Module
The user builds machine learning models for predicting customer churn using either logistic regression, k-nearest neighbor classifier, support vector classifier, and random forest classifier. The input data is split into training and a testing set which is then used to measure the model’s accuracy. Different parameters of the dataset are tuned to achieve the best results possible.
3.4.7 Prediction Module
In this module, the modeled classifier’s results are displayed. The outcome of the machine learning model is used to project the results of any new data added by the user. In this case, customer churn predictions are made here.
3.4.8 Results Module
The user exports the prediction reports and results. He or she then saves them in the form of a text file, image or spreadsheet.
3.5 Class Diagrams
Class diagrams are a type of structures in Unified Modelling Language (UML) that are used to describe the different classes of the system as well as their attributes. In this project, the various modules are managed using classes with a set of descriptive attributes. Decomposition of some entity classes has also been done to maintain data consistency and modularity throughout the database schema.
18
Figure 5 Extended Entity Diagram for the database design and representation
3.6 Activity Diagrams
The activity diagrams are structures that represent the flow of user interactive actions with the system, step-wise. The activity diagrams below show the process flow of the system user in the CRM management component and the data analytics component in the same order.
19
20
CHAPTER 4: IMPLEMENTATION
4.1 Overview
This chapter describes in detail, the various implementation techniques and considerations that influenced the choice of technologies and tools used in the development of the system. It also shows the appropriate design interfaces and code snippets of the system components developed.
4.2 Implementation Tools and Technologies
This section shows and describes the choice of the different programming languages, libraries, and frameworks used in building the application.
4.2.1 Languages
• Python: a server-side scripting language that can be used to create web applications. It is flexible, pragmatic, has simple syntax and an ability to scale quickly. It was used in this project because it contains many data analytics and machine learning libraries and packages. It is also compatible with a lot of browsers and supports a wide range of databases especially when used with Flask framework for web development.
• HTML: HyperText Markup Language is a mark-up language that describes the structure of web pages and their contents using different building blocks such as headings, paragraphs, and divisions. HTML helps in rendering the contents of a web page on the browser in which the application is being run.
• CSS: Cascading Style Sheetsare used to control the layout of web pages by describing how the HTML elements are displayed on the browser.
• JavaScript: a client scripting as well as an object-oriented programming language. It supports dynamic web application development and user interaction on the web pages.
21 JavaScript was used in this project because it is lightweight and can render interactive effects on the web browser and aid in user input validation.
4.2.2 Frameworks
• Bootstrap 4- is an open source front-end web development tool. It is a collection of HTML, CSS and JavaScript files which ensure the creation of a cross-platform and responsive web application.
• Flask 3- Flask is a micro-framework written in Python. It supports various interface components and dependencies which are easy to extend, and it is supported by very comprehensive documentation. It is based on Jinja2 template engine and the Werkzeug WSGI toolkit which act as external libraries. Flask was used in this project because it is fast and supports efficient routing, has a built-in development server and a fast debugger with integrated unit-testing support. It is also lightweight, and hence there are no much code footprints in the application.
4.2.3 Libraries
• J-Query- a lightweight JavaScript library that is used to simplify HTML documentation event handling, document traversing and interactions on the web. Its key advantage is that it is fast and helps in streamlining and standardizing communications across the web application user views. In this project, J-Query was very instrumental in active display of data on the web using data tables and other inbuilt functions.
22
Figure 8 An example of jQuery in use
• AJAX- Asynchronous JavaScript And XML is a JavaScript library that enables data to be asynchronously exchanged between web pages and the web server. It employs the browser’s XMLHttpRequest object and the HTML DOM for data communications and display. For instance, to display the updated records asynchronously, AJAX was used to ensure searching, editing and adding items to the tables is live and faster.
Data analytics and machine learning libraries:
o Matplotlib:A Python 2D plotting library which is used to create graphs and plots using python scripts. It contains several modules such as pyplot which is a plotting framework for graphs and plots. Matplotlib library was mostly used in the visualization module where the datasets are represented in form of charts and plots.
o Sklearn: an open-source python library for data analysis and machine learning. It provides machine learning algorithms and preprocessing built-in functionality for data. In this project, the Sklearn library was very significant in preprocessing and modelling modules due to its high level of robustness, performance, and accuracy.
23 o NumPy: a fundamental scientific package that supports multidimensional arrays and matrices for data analysis. The library was used to showcase a matrix comparison of results using model confusion matrices.
o Pandas: a python data analysis library which is quite useful in data wrangling and it supports high-level data structures that manipulate the data for faster and secure analysis.
o Seaborn: a statistical data visualization library based on matplotlib and is used to
provide a high-level interface for drawing informative statistical graphics such as confusion matrices.
4.3 Backend
• Flask-SQLAlchemy is a library that extends from the Flask framework to facilitate Object Relational Mapping (ORM) between the python application and the databases. It provides virtual object databases and supports other relational databases such as SQL, Postgres, and SQLite. It provides functions and model helpers which simplifies the writing of basic query statements.
• SQLite is a relational database management system embedded into the end program in the form of a file system. SQLite was used in this project because it is portable, flexible, self-contained and highly reliable especially because of its ability to support file system mode of data storage.
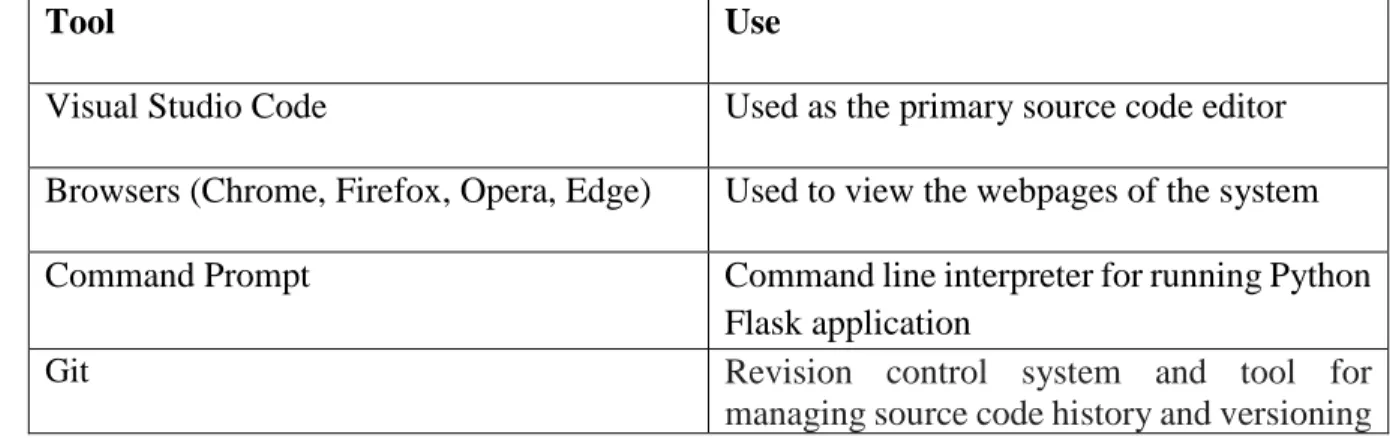
4.4 Environment Setup
This system is a web-based application that can be hosted on a web server or run using docker as a stand-alone application. All the browsers on any device also support it.
24
Tool Use
Visual Studio Code Used as the primary source code editor
Browsers (Chrome, Firefox, Opera, Edge) Used to view the webpages of the system
Command Prompt Command line interpreter for running Python
Flask application
Git Revision control system and tool for
managing source code history and versioning
4.6 Flask dependencies and libraries imported
25 4.7 Implementation Design and techniques
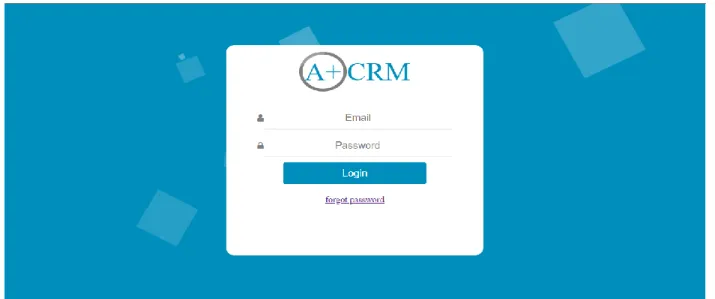
Figure 10 The login page of the user.
26
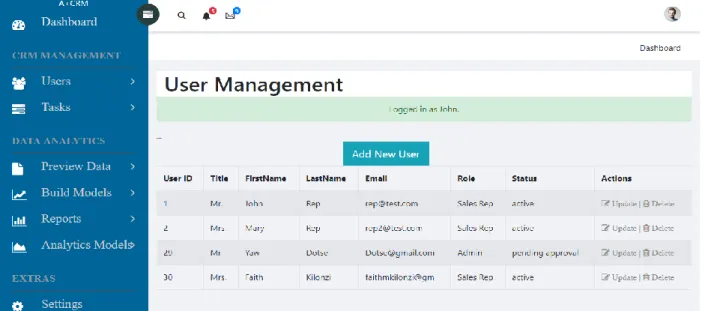
Figure 12 User management module
27
Figure 14 Deleting user module
28
Figure 16 Data analytics: uploading datasets interface
In figure 16, a form input is provided for the user to upload datasets in the form of comma-separated values files for analysis.
29 In figure 17, the uploaded data is visualized in graphs and tables for better understanding before building the machine learning models.
Figure 18 Churn prediction results
In figure 18, the uploaded datasets have been analyzed and models made using Random Forest Classifier. The user can choose from four machine learning algorithms: Random Forest Classifier, K-nearest neighbor classifier, logistic regression and Support Vector Classifier. The results are tabulated in a confusion matrix with the algorithm accuracy indicated. The represented customer churn results would then be used to make decisions concerning the retention and customer relationship management.
The following figures show the implementation of data preprocessing after upload and modelling using random forest classifier using python flask. Both functionalities are done through the use of libraries and Flask dependencies then the results are routed in the various application pages. The active data being worked on is stored in file systems for easy access and then stored in the database.
30
Figure 19 Data preprocessing sample code
31
CHAPTER 5: TESTING
5.1 Testing Overview
After the software has been implemented, it needs to be tested. Testing is intended to show that a program does what it is intended to do and to discover program defects before it is put into use.[2] To test a software, a program is executed using artificial data as part of the verification and validation goals. At the validation stage, a developer usually tests whether he/she is building the right product while verification tests if he/she is building the product right. The testing results are run to check for anomalies, errors and the information about the program’s non-functional attributes. Three principal types of testing were used for this program: development testing, release testing and user testing.
5.2 Development Testing
Development testing is the process which spans throughout the implementation phase where the developer identifies and fixes bugs and defects in the system. Development testing comes in three stages: unit, component and system testing as listed below:
5.2.1 Unit Testing
During unit testing, the individual program units were tested to validate the object functionalities of the system such as classes, database queries, and data visualization techniques. For instance, some data analytics visuals were printed on the console and database queries executed directly before passing the results to the webpages.
5.2.2 Component Testing
During component testing, several individual units were integrated to modules and tested to check for any integration incompatibilities between single program units. For instance, the basic functionalities (view, delete, add and update of the tasks and users), were integrated
32 into task management and user management components respectively. Component testing was used to verify that the integration of the individual objects did not cause any anomalies.
5.2.3 System Testing
After a successful component testing, individual modules of the system were further integrated into a whole system. The tests run on the complete system were focused on testing the effectiveness of component interactions. The system takes in various inputs of different types, and the process flow is observed with validation of the output.
5.3 Release Testing
During release testing, the system was deployed on a live server aside the local development server to ensure it meets the intended specifications. For instance, docker container deployment ascertained that the path dynamism had not been well implemented. The feedback from this was used to make changes to the system to ensure it meets the already set user’s specifications before releasing to the market.
5.4 User Testing
During the user testing stage, various users of the system were asked to use the system in the observation of the developer to discover the flow of events from a customer’s point of view. The insights gathered from user testing were applied to make changes to the various objects of the system. For instance, system usability was iteratively redesigned to fit the various users who had navigation problems.
The following shows some of the test suites and cases carried out in the course of the testing.
33
5.4.1 Test Case: Login into the system
Test Suite 1 Testing the login functionality
Objective To test the different scenarios that might
arise while a user is trying to login into the system
Case Precondition Post
Condition
Execution Steps
Expected Output Verify that an
existing user can log in with correct email and password
The user must have registered with ACRM and have their correct credentials The user is logged in and can access the dashboard Type user email Type password Click login
The user is redirected to the CRM dashboard
Verify that a person who does not have an account cannot log in
The user enters invalid input credentials The user is denied login Type user email Type password Click login No page redirection, login error is displayed on the login page
4.4.2 Test Case: Logout of the system
Test Suite 1 Testing the logout functionality
Objective To test the case of a user trying to log out
Case Precondition Post
Condition Execution Steps Expected Output Verify that an already logged in user can log out of the system
The user must be logged in already The user is logged out of the CRM system Click the logout button
The user is logged out and redirected to the index page
34
Test 5.4.3 test case: Adding a new user
Test Suite 1 Testing adding a new user’s functionality
Objective To test the different scenarios that might
arise while a new user is being added
Case Precondition Post
Condition
Execution Steps
Expected Output 1.Verify that a user
who is an admin can add a new user (sales personnel, admin, manager)
The user must be an admin to add other users
The new user’s credentials are stored into the database and a success message printed on the dashboard. Type new user’s credentials email Click add button Success message displayed, redirected to the CRM dashboard
2.Verify that a user who is not an admin cannot add a new user
User clicks the add user button The user is denied add user functionality
Click add user button
An error message is displayed on the dashboard
35
Test 5.4.4 test case: Removing a user from the system
Test Suite 1 Testing the deletion of a user’s functionality
Objective To test the different scenarios that might arise
while a user is being deleted
Case Precondition Post
Condition
Execution Steps
Expected Output 1.Verify that a user
who is an admin can delete an existing user (sales
personnel, manager)
The user must be an admin to delete other users The deleted user’s credentials are removed from the database and a success message printed on the dashboard. Click delete button Success message displayed, redirected to the CRM dashboard
2.Verify that a user who is not an admin cannot delete a user
User clicks the delete user button The user is denied delete user functionality Click delete user button An error message is displayed on the dashboard
36
Test 5.4.5 test case: Updating a user in the system
Test Suite 1 Testing updating a user’s functionality
Objective To test the different scenarios that might arise while a user is being updated
Case Precondition Post
Condition
Execution Steps
Expected Output 1.Verify that a user
who is an admin can update an existing user (sales
personnel, manager)
The user must be an admin to update other users The update user’s credentials are set in the database and a success message printed on the dashboard. Click update button Changes made on the input to be updated Success message displayed, redirected to the CRM dashboard
2.Verify that a user who is not an admin cannot update a user
User clicks the update user button The user is denied update user functionality Click update user button An error message is displayed on the dashboard
37
Test 5.4.6 test case: Analyzing Customer data
Test Suite 1 Testing updating a user’s functionality
Objective To test the different scenarios that might arise
while analyzing customer data
Case Precondition Post Condition Execution Steps
Expected Output 1.Verify that the
format of the dataset is a CSV file The dataset uploaded must be in the form of a CSV file. The dataset is successfully uploaded, and a visual representation of the data in the form of graphs and tables is shown on the dashboard. Enter the datasets, Click the upload button Success message displayed, redirected to the ACRM dashboard and visuals shown.
2.Verify that a churn prediction model cannot be built unless there is data in the system For a prediction model to be built, there must be an active dataset uploaded in the system The user is redirected back to the upload page to select the data to analyze User click data preprocessing and selects the machine learning algorithm from to build the predictive churn model An error message is displayed on the dashboard and redirection is made to the dataset upload section.
38
CHAPTER 6: RECOMMENDATIONS AND CONCLUSION
6.1 Overview
This chapter discusses a summary of the system implementation, the insights gathered and some recommendations for further development and efficiency improvement.
6.2 Recommendations and future work The CRM system can be made better by:
• Implementing a data training pipeline where the customer data can be automatically uploaded into the system without manually uploading the datasets. This option would ensure system efficiency, especially for the less technical team members.
• Implementing the data analytics module as a standalone application and enabling integration into already existing CRM systems.
• Implementing more machine learning algorithms to give users more options when building data prediction models. This will help in optimizing the accuracy of the models and give users an opportunity to build models they can easily understand.
• Implementing a results’ recommendation functionality where the churn prediction results can be used to recommend customer retention decisions.This will ensure that the results are more understandable and can give users clues to solve the churn problem.
• Adding support for other formats of datasets such as JSON files, Microsoft Excel files, XML files and enable loading data from external sources through APIs.
• Adding graphical and inferential analysis of the models after the analysis to give the user more insights in understanding the source of the problem.
• Adding more CRM functionalities to make the application self-sufficient and less dependent on other company management systems.
39 6.3 Conclusion
The analytical customer relationship management system works well both the CRM and the data analytics module. The system provides a comprehensive analytics-based approach of predicting customer churn within a given dataset provided from the CRM customer data. The workflow of the system follows and meets the specifications, functional and non-functional requirements discussed in chapter 2. The system will enable the application of artificial intelligence on CRM systems to leverage on analyzing customer data to gather new insights about needs and preferences to make logical and smart customer retention decisions. This project serves as a new paradigm for digitizing marketing and customer relations management in telecommunications through machine learning predictive models. Software developers could use this system as a starting point to optimize the models and improve their efficiency.
40
References
[1] Roman Orac. 2019. Churn prediction. Towards Data Science. Retrieved March 29, 2019 from https://towardsdatascience.com/churn-prediction-770d6cb582a5
[2] Ian Sommerville. 2016. Sommerville, Software Engineering, 10th Edition | Pearson. Retrieved March 19, 2019 from
https://www.pearson.com/us/higher-education/program/Sommerville-Software-Engineering-10th-Edition/PGM35255.html [3] A comparative analysis of data preparation algorithms for customer churn prediction: A
case study in the telecommunication industry - ScienceDirect. Retrieved March 19, 2019 from https://www.sciencedirect.com/science/article/pii/S0167923616302020
[4] Customer churn prediction in telecommunication industry using data certainty - ScienceDirect. Retrieved March 19, 2019 from
https://www.sciencedirect.com/science/article/pii/S0148296318301231#bb0070 [5] Social network analytics for churn prediction in telco: Model building, evaluation and
network architecture - ScienceDirect. Retrieved March 19, 2019 from https://www.sciencedirect.com/science/article/pii/S0957417417303445
[6] Customer Churn Prediction in Telecommunication Industry: With and without Counter-Example - IEEE Conference Publication. Retrieved March 19, 2019 from
https://ieeexplore.ieee.org/document/6984905
[7] (PDF) Mobile Number Portability in Ghana: A Paradigm Shift from the Past. Retrieved March 19, 2019 from
https://www.researchgate.net/publication/261363562_Mobile_Number_Portability_in_Gh ana_A_Paradigm_Shift_from_the_Past
41 [8] Artificial Intelligence Revenue to Reach $36.8 Billion Worldwide by 2025 | Tractica.
Retrieved March 19, 2019 from https://www.tractica.com/newsroom/press-releases/artificial-intelligence-revenue-to-reach-36-8-billion-worldwide-by-2025/ [9] Big data: The next frontier for innovation, competition, and productivity | McKinsey.
Retrieved March 19, 2019 from https://www.mckinsey.com/business-functions/digital-mckinsey/our-insights/big-data-the-next-frontier-for-innovation
[10] Telecom Voice Subscription » National Communications Authority. Retrieved March 29, 2019 from https://nca.org.gh/industry-data-2/market-share-statistics-2/voice-2/ [11] (PDF) Mobile Number Portability in Ghana: A Paradigm Shift from the Past.
Retrieved March 19, 2019 from
https://www.researchgate.net/publication/261363562_Mobile_Number_Portability_in_Gh ana_A_Paradigm_Shift_from_the_Past
42
APPENDIX A
Running the application using command prompt. In flask, you need to activate the virtual environment to ensure all the requirements are met.
Figure 21 Initialization and activation of the virtual environment
43
Figure 22A sample output of the algorithm prediction. Confusion matrix of logistic regression
![Figure 4 MVC architecture ( Source: Sommerville Software Engineering) [1]](https://thumb-us.123doks.com/thumbv2/123dok_us/9913660.2484515/22.918.253.800.724.932/figure-mvc-architecture-source-sommerville-software-engineering.webp)