Big data analytics in high-throughput phenotyping
by
Chaney L. Courtney
B.S., Kansas State University, 2014 M.S., Kansas State University, 2017
AN ABSTRACT OF A DISSERTATION
submitted in partial fulfillment of the requirements for the degree
DOCTOR OF PHILOSOPHY
Department of Computer Science Carl R. Ice College of Engineering
KANSAS STATE UNIVERSITY Manhattan, Kansas
Abstract
As the global population rises, advancements in plant diversity and crop yield is necessary for resource stability and nutritional security. In the next thirty years, the global population will pass 9 billion. Genetic advancements have become inexpensive and widely available to address this issue; however, phenotypic acquisition development has stagnated. Plant breeding programs have begun to support efforts in data mining, computer vision, and graphics to alleviate the gap from genetic advancements.
This dissertation creates a bridge between computer vision research and phenotyping by designing and analyzing various deep neural networks for concrete applications while presenting new and novel approaches. The significant contributions are research advancements to the current state-of-the-art in mobile high-throughput phenotyping (HTP), which promotes more efficient plant science workflow tasks. Novel tools and utilities created for automatic code generation, maintenance, and source translation are featured. Promoted tools replace boiler-plate segments and redundant tasks. Finally, this research investigates various state-of-the-art deep neural network architectures to derive methods for object identification and enumeration.
Seed kernel counting is a crucial task in the plant research workflow. This dissertation explains techniques and tools for generating data to scale training. New dataset creation
methodologies are debuted and aim to replace the classical approach to labeling data. Although HTP is a general topic, this research focuses on various grains and plant-seed phenotypes. Applying deep neural networks to seed kernels for classification and object detection is a relatively new topic. This research uses a novel open-source dataset that supports future architectures for detecting kernels. State-of-the-art pre-trained regional convolutional neural networks (RCNN) perform poorly on seeds. The proposed counting architectures outperform the
models above by focusing on learning a labeled integer count rather than anchor points for localization. Concurrently, pre-trained models on the seed dataset, a composition of
geometrically primitive-like objects, boasts improvements to evaluation metrics in comparison to the Common Object in Context (COCO) dataset. A widely accepted problem in image
processing is the segmentation of foreground objects from the background. This dissertation shows that state-of-the-art regional convolutional neural networks (RCNN) perform poorly in cases where foreground objects are similar to the background. Instead, transfer learning leverages salient features and boosts performance on noisy background datasets.
The accumulation of new ideas and evidence of growth for mobile computer vision surmise a bright future for data-acquisition in various fields of HTP. The results obtained provide horizons and a solid foundation for future research to stabilize and continue the growth of
Big data analytics in high-throughput phenotyping
by
Chaney L. Courtney
B.S., Kansas State University, 2014 M.S., Kansas State University, 2017
A DISSERTATION
submitted in partial fulfillment of the requirements for the degree
DOCTOR OF PHILOSOPHY
Department of Computer Science Carl R. Ice College of Engineering
KANSAS STATE UNIVERSITY Manhattan, Kansas
2020
Approved by: Major Professor Mitchell Neilsen
Copyright
Abstract
As the global population rises, advancements in plant diversity and crop yield is necessary for resource stability and nutritional security. In the next thirty years, the global population will pass 9 billion. Genetic advancements have become inexpensive and widely available to address this issue; however, phenotypic acquisition development has stagnated. Plant breeding programs have begun to support efforts in data mining, computer vision, and graphics to alleviate the gap from genetic advancements.
This dissertation creates a bridge between computer vision research and phenotyping by designing and analyzing various deep neural networks for concrete applications while presenting new and novel approaches. The significant contributions are research advancements to the current state-of-the-art in mobile high-throughput phenotyping (HTP), which promotes more efficient plant science workflow tasks. Novel tools and utilities created for automatic code generation, maintenance, and source translation are featured. Promoted tools replace boiler-plate segments and redundant tasks. Finally, this research investigates various state-of-the-art deep neural network architectures to derive methods for object identification and enumeration.
Seed kernel counting is a crucial task in the plant research workflow. This dissertation explains techniques and tools for generating data to scale training. New dataset creation
methodologies are debuted and aim to replace the classical approach to labeling data. Although HTP is a general topic, this research focuses on various grains and plant-seed phenotypes. Applying deep neural networks to seed kernels for classification and object detection is a relatively new topic. This research uses a novel open-source dataset that supports future architectures for detecting kernels. State-of-the-art pre-trained regional convolutional neural networks (RCNN) perform poorly on seeds. The proposed counting architectures outperform the
models above by focusing on learning a labeled integer count rather than anchor points for localization. Concurrently, pre-trained models on the seed dataset, a composition of
geometrically primitive-like objects, boasts improvements to evaluation metrics in comparison to the Common Object in Context (COCO) dataset. A widely accepted problem in image
processing is the segmentation of foreground objects from the background. This dissertation shows that state-of-the-art regional convolutional neural networks (RCNN) perform poorly in cases where foreground objects are similar to the background. Instead, transfer learning leverages salient features and boosts performance on noisy background datasets.
The accumulation of new ideas and evidence of growth for mobile computer vision surmise a bright future for data-acquisition in various fields of HTP. The results obtained provide horizons and a solid foundation for future research to stabilize and continue the growth of
Table of Contents
List of Figures...x List of Tables...xii Acknowledgments...xiii Dedication...xiv Preface...xv Chapter 1 - Introduction...1Chapter 2 - Applications in High-throughput Phenotyping...8
Motivation...8
Verify...9
Survey...13
Intercross...17
OneKK and Abacus...24
Rangle...37
Chapter 3 – Development Tools...42
Motivation...42
Auto Preference Fragment...43
Typed Data Binding Fragments...48
GNSS Message Parser...51
Snackbar Queue...53
Automatic Contour Generator...55
Chapter 4 - Computer Vision...63
Motivation...63
Supervised Density Count...69
Unsupervised Tiled Seed Counting...78
Towards Background Invariant Counting...84
Population of Kernel Sample and Data Source...89
Results...95
List of Figures
Figure 1: Examples of fragments from Verify...10
Figure 2: The bar-code matching feature in Verify...11
Figure 3: Examples of fragments from Survey...14
Figure 4: The main page and connection prompt in Intercross...17
Figure 5: A wish-list summary in Intercross...20
Figure 6: The pollen manager fragment in Intercross...22
Figure 7: Two different distance transform outputs on canola and soybean...26
Figure 8: RAT diagram of image processing trade-offs...27
Figure 9: Counting 115 soybeans in OneKK...29
Figure 10: Counting 168 wheat kernels in OneKK...30
Figure 11: Counting 172 sorghum in OneKK...31
Figure 12: Counting 133 rough rice in OneKK...32
Figure 13: Counting 317 white rice in OneKK...35
Figure 14: Counting 136 canola in OneKK...36
Figure 15: An example of the Rangle dataset...37
Figure 16: A Rangle example in plastic...38
Figure 17: Example of the Rangle dataset...38
Figure 18: The three step-process: threshing, extract contours, calculate angle...39
Figure 19: Greedy algorithm used to calculate root angles...40
Figure 20: An Android preferences layout file...43
Figure 21: A PreferenceFragment example...45
Figure 22: Automatically generated code based on a user's preference file...46
Figure 23: A comparison between preference querying...47
Figure 24: The LAB threshing UI for ACG...57
Figure 25: The cluster estimation and noise reduction step using Equation 1...58
Figure 27: Final manual bisection step...61
Figure 28: The mid split algorithm, used to split a contour into two separate pieces...62
Figure 29: Density maps of several images of wheat...72
Figure 30: Hyper-parameter search of the wheat dataset...73
Figure 31: Hyper-parameter search of the canola dataset...74
Figure 32: Hyper-parameter search of the rough rice dataset...75
Figure 33: Hyper-parameter search of the soybean dataset...76
Figure 34: Hyper-parameter search of the sorghum dataset...77
Figure 35: Hyper-parameter search of the white rice dataset...77
Figure 36: An input image and autoencoded feature map of a wheat tile...78
Figure 37: Tiled depiction of a wheat image...79
Figure 38: Intermediate outputs of the autoencoder model...80
Figure 39: A spike visualizing the boundaries of a seed kernel...82
Figure 40: Gaussian blurring used on the edges of an image to reduce background noise...82
Figure 41: COUnt architecture, purple layers show max pooling...84
Figure 42: Ambient light detected after basic thresholding...85
Figure 43: Architecture diagram of the autoencoder used in COUnt...86
Figure 44: Encoded feature map images from the autoencoder...88
Figure 45: A subset of the various backgrounds used during data synthesis...94
Figure 46: Examples of randomly generated rough rice clusters...94
Figure 47: Single kernel examples from the dataset...96
Figure 48: Examples of SSDMobilenet during training...96
Figure 49: Graph of precision over time for the model...99
Figure 50: Results from the various independent models...99
Figure 51: Application using SSDMobilenet to detect kernels...109
Figure 52: Supervised network used to count various kernels...111
List of Tables
Table 1: RTCM3 message update parameters for the SPAM survey...16
Table 2: Result of SSD Mobilenet trained on various datasets...98
Table 3: Various metrics used to evaluate count results...100
Table 4: Results for the density counting network on all datasets...100
Table 5: Results of the cross-dataset evaluation of various seed datasets...102
Table 6: Results of the transfer learning on various seed datasets...103
Table 7: Results of multiple datasets run on the autoencoder model with various metrics...104
Table 8: Results of the autoencoder model with the statistical Gaussian-based count...105
Acknowledgments
This material is based upon work supported by the National Science Foundation (NSF) under NSF-Basic Research to Enable Agricultural Development (BREAD) Grant No. 1543958. Any opinions, findings, and conclusions or recommendations expressed in this material are those of the author(s) and do not necessarily reflect the views of the National Science Foundation.
This research is also funded by the Bill and Melinda Gates Foundation.
The ideas and design of the various applications for plant based high-throughput
phenotyping came from collaboration with Mitchell Neilsen, Jessie Poland, Trevor Rife, Michael Gore, Lukas Mueller, Jenna Hershberger, Solomon Nsumba, Peter Selby, Peter Rosario, Venkat Margapuri, Shanshan Wu, Siddharth Amaravadi, Friday James, Joydeep Mitra, and Guillaume Jean Bauchet.
Hardware described in Chapter 4 Section Population of Kernel Sample and Data Source came from inspiration from Mitchell Neilsen, Masaaki Mizuno, Paul Armstrong, Dan Brabec, Siddharth Amaravadi, and Dan Wagner.
Deep neural network architectures and algorithms were also inspired by Mitchell Neilsen, Masaaki Mizuno, Dave Schmidt, Torben Amtoft, RDoina Caragea, Rodney Howell, Jessie Poland, Trevor Rife, Chendi Chao, Venkat Margapuri, Greg Erickson and Umar Gaffar.
Dedication
To my grandpa who inspired me to be a scientist. To my professors who are friends, and my family who showed me patience and unending support.
Preface
All research, including fabrication of tools used for experiments, was conducted in the Cyber Physical Systems Laboratory (CPSL) within the Computer Science Department at Kansas State University.
A version of Chapter 2 Section Intercross was published in Proceedings of 32nd
Chapter 1 - Introduction
Applications in high-throughput phenotyping include both generic and specific tools for solving tasks typically related to data acquisition. Data acquisition is the memoization of actions, events, and observations. Classical data acquisition has been mainly a manual effort of writing information into a booklet; for field studies, the information includes statistics about plot-level details. A set of fundamental phenotyping tools developed for specific tasks in plant breeding improves the breeding work cycle [1]. Poland et al., encapsulate the process workflow of a plant breeder within three main categories: sampling, crossing, and evaluation. Field Book was one of the first Android Applications created by Poland/Rife for field-data-acquisition. Field Book’s primary purpose is to eliminate the need for pen-and-paper methods for tracking plot specific phenotypes. A collection of related applications called PhenoApps has been developed at Kansas State University through collaboration between the Poland Wheat Genetics Laboratory, the Cyber Physical Systems Laboratory in the Computer Science Department, and the Gore
Laboratory at Cornell University. A subset of these applications is discussed in this dissertation; a descriptive functionality is given, along with a motivation for each tool. Field Book has proven success on the Google Play Store. These applications are opening the rural and developmental world up to new tools of free access. Supporting grants for these projects are funded by the National Science Foundation and the Bill and Melinda Gates Foundation. The NSF Basic Research to Enable Agricultural Development (BREAD) project is helping small-holder farm development by funding the creation of these applications and has supported various workshops and inventory distribution for these tasks. Research and development for this dissertation is a product of the work at the Cyber Physical Systems Laboratory (CPSL) at Kansas State
University with close collaboration with Cornell University, Boyce Thompson Scott Institute, and the International Potato Center in Lima, Peru.
With the rise in cheap mobile devices, a new subcategory that we call mobile high-throughput phenotyping emerges. Lab technicians and breeders can now replace their
spreadsheet processor-based workflow with free-of-charge applications, without the need for a desktop computer. There is an innate difference in the processing power of computers and mobile devices due to architectural differences, with the former being more powerful and power-consuming than the latter. Central processing unit (CPU) intensive tasks such as image
processing perform fathoms greater on a mid-range desktop than most mobile devices. Mobility and power-consumption is a worthy trade-off to the lack of CPU processing compared to average computers. As mobile devices advance, we can perform more powerful operations designed for image processing and general data acquisition. There is a plethora of devices available for mobile phones, including printers, bar-code scanners, and even scales with sub-gram resolution. The usages of these devices are plentiful and essential for fieldwork in plant research. As more plant research centers populate plots with bar-code identifiers, it is essential to allow users to scan these tags for ease-of-use in their research. There is a general aspect of the usages of these applications without the overlooking topic of phenotyping. Working with mobile devices for such tasks allows the user to harness the Internet or 3G networks for cloud-based data storage and processing. The PhenoApps Application Prospector is one such application that looks at analyzing near-infrared-spectrometry on the cloud to classify traits of individual plant samples. Because the computational cost of evaluating the linear regression of these models is typically too much for a low-end mobile device, the use of clusters helps reduce training time. Therefore, as some applications utilize the ability of the Internet, others avoid it as a necessity. Most rural
farms and some plant-research facilities have little to no Internet and thus require pre-built Android packages (APK). While offline, data acquisition tasks occur. The task of fieldwork is offline work; however, when completed, there is the option of utilizing the Internet to upload results.
Implementing state-of-the-art algorithms into applications requires not only knowledge of the new algorithms, but expertise in building applications. An element of this dissertation is the implementation of tools and libraries that can ease this burden. Code generative plugins
implemented using Gradle are proposed, along with design architectures for using Android Jetpack libraries. Along with libraries and code generative tasks for Android development, another objective of this dissertation is to discuss and create tools for generating annotations for training deep neural network models. With the rise in deep learning, there is a need to handle and generate large datasets. General object detection is an undecidable task [2]. This dissertation introduces a process to automate annotations, which is a bottleneck (or expensive task) for creating datasets to train such models. The annotations generator does not act as a universal object annotator. However, it requires some supervised task of tuning for its data. Specific project setups can improve the ease of creating object detection scripts. This dissertation includes headless and user-interface driven tools to support multiple tasks. A specified script for a
particular object detection task can then power the automatic generator script, which parallelizes the annotating process.
A generalized object detector can be created and is discussed later for seed kernels based on a deep neural network trained on datasets generated from this methodology. The automatic annotations generator script creates labeled datasets where the labels include bounding boxes, images, area for each contour, and approximated contour arrays. TensorFlow is used for training,
evaluating, and the creation of various models. The use of TensorFlow allows for creating TensorFlow-Lite models, which optimize models for mobile devices. Although TensorFlow-Lite doesn’t currently have the same capabilities as full-fledged TensorFlow models, this dissertation experiments with its use and searches for viable options on mobile devices. A benefit of using such deep neural network models is the ability to checkpoint pre-trained models. The general methodology for these experiments is to train networks on the local cluster at Kansas State University, Beocat, checkpoint the model, and test the model in different environments. Models include linear-regression based classification models and autoencoder models. Classification models do not predict localization or contour masks but output a confidence interval for the classification of such seeds. Currently, there are no defined usages for this type of model, as most applicable models for this research require localization and masking. Another such model is used to locate kernels; these models include SSD, FastRCNN, and FasterRCNN, which place bounding boxes around their classifications. MaskRCNN uses mask contour data to measure the area and perimeter data for seeds. However, an optimized version for mobile devices does not exist.
The open-source nature of these projects precludes the opportunity to extend this software. If future researchers wish to create features or forks of the current projects and have little knowledge of the Android ecosystem, it may be difficult to make simple changes. Work has simplified the process of coding for Android applications. However, there is always a need to have a basic understanding of programming languages and the Android operating system. As Kotlin has become more popular and an evident replacement to Java, it is the recommended programming language of choice. Two Gradle tasks begin the process of alleviating boiler-plate code, and a Java to Kotlin translator is also available. Android Studio has a built-in Java to
Kotlin translator that was developed in parallel to this research. The provided translator focuses on null safety and reduces run-time errors that are common in Android Studio’s translations.
Various data flow analyses determine the initialization of variables. The Android Studio translation globally initializes variables as null when this is not necessary. This translator aims at creating null safe code by replacing null initializations with lazy initializers and lateinit variables. Lazy initializers require developers to write initialization code post-translation. Using data flow analyses such as liveness, the mutability of variables can be determined and, in this way, decide initialization strategies. Lateinit variables have non-null static types but are initialized on their first line of usage instead of at declaration time. Lazily evaluated objects are useful and
predominately used for view objects. Typically, when a view object in the Android environment initiates, it is declared using the ‘findViewById’ function, which cast into an object of the view’s type. These calls can be wrapped into top-level lazy declarations that are initialized when the value is called. These fundamental Kotlin syntaxes are used to create a more idiomatic code translation in comparison to the Java to Kotlin translator in Android Studio, which is more Java-like.
Gradle is a popular build language for Android applications. It has a flexible application programming interface (API) for building plugins and build tasks. The Gradle API is perfect for creating generative code tasks that operate on source files. One featured plugin is the Auto Shared Preferences plugin. This plugin aims at reducing code in Kotlin by dynamically creating a class populated with fields collected from a local preference file. Preferences files define the Shared Preference settings’ key-value pair mapping. Another critical benefit to code generation is the ability to suppress and alleviate bug production in development. Developing succinct and
safe code generative tasks reduces the number of bugs in comparison to typically hand developed code.
The following dissertation is an accumulation of the research efforts, ideas, motivations, and future goals of improving the status quo of high-throughput phenotyping big data tasks. As the volume and velocity of data increases, including crop images from uncrewed aerial vehicles (UAV), genomic processing, and near-infrared spectroscopy (NIRS) data, it is vital to have a fundamental change in the way fieldwork is managed. The data quality of such tasks is described to ensure their transitivity and reproducibility. For example, the usage and extension of these tools and models may require similar experimental setup, such as the addition of new training data on a specific seed kernel which has not been previously trained upon. The data acquisition of such information will need to remain within the bounds of what is defined. The reason being is the complicated nature of contour clustering and identification. If data taken has a noisy background or is within a busy lighting scenario, the objects may be difficult to track using the given software.
Therefore, the experimental setup and data quality is a common element of this dissertation, which aims at settling a foundation for big data tasks in high-throughput
phenotyping. Therefore, given the previously stated knowledge, this dissertation expects to solve three overarching goals, which include new research tasks that contribute to the society of computer scientists. First, the production of a novel dataset for sorghum, rice, rough rice, wheat, soybean, and canola. Secondly, the implementation of a semi-automated contour annotations generator for training deep neural networks. Finally, the evaluation and observations of various seed-based datasets using single-shot detection Mobilenet (SSDMobilenet), a density-based seed counter, and an autoencoder seed counter.
Furthermore, each implementation has an open-source repository where reviewers may download the code, dataset, or application necessary to reproduce or extend these results. This dissertation’s contributions are not limited to the above-defined goals. They include several open-source applications, libraries, and algorithms.
Chapter 2 - Applications in High-throughput Phenotyping
Motivation
The Cyber Physical Systems Laboratory (CPSL) at Kansas State University has a focus on developing high-throughput phenotyping applications for rural agricultural communities. To improve research workflow and development, the CPSL works closely with PhenoApps, an open-source organization based in the Plant Science department at Throckmorton Hall on the KSU campus. CPSL has traveled to Hyderabad, India, for a workshop at the International Crops Research Institute for the Semi-Arid Tropics (ICRISAT). Here the CPSL worked on an Android application, Verify, for various bar-code tracking related tasks. PhenoApps has had multiple hackathons based at Cornell University in Ithaca, New York. CPSL worked on creating a new application, Intercross at PhenoApp’s first hackathon, by working closely with plant science researchers at Cornell and the Boyce Thompson Institute. Intercross was later introduced at the International Institute of Tropical Agriculture (IITA) in Nigeria and the Centro Internacional del Papas in Lima, Peru. The CPSL was able to personally visit CIP for close work with its staff and beta-test against an estimate of one-hundred users. At the same time, members of the Boyce Thompson Institute introduced Intercross to plant researchers at IITA. Intercross is a submission-based and motivated on the workflow at CIP and IITA and proposes the use of mobile devices for their experiments. Verify is now a commonly used application within ICRISAT and other plant research facilities with thousands of device installations.
Verify
Relational databases have been a fundamental piece of software since the need to store large amounts of data in a structured way has arisen [3]. Structured query language (SQL) is a leading query language for designing the schema and accessing data within the tables of a relational database. Whether they be web, mobile, or any other type of application with a front-end and back-front-end, databases are essential to data management. It is a common understanding that a database accompanies most web applications and mobile applications. The need to store information about users or work is fundamental for any basic algorithm designed for an application. Verify is one such example where the front-end of the application is highly tied to back-end processing using an SQLite database. Android, by default, allows developers to utilize a ‘lighter’ version of SQL within applications, which allows users to manage data independently of the system and other applications. SQLite is “the most used database engine in the world.”. It is a “small, fast, self-contained, high-reliability, full-featured, SQL database engine.” [4]. SQLite ensures atomicity, consistency, isolation, and durability (ACID) fundamentals [5].
Verify’s primary purpose is to track collected samples within a database. Verify is an Android application that has different modes and functions that can be applied to the data and exported for iterative use. While Verify’s purpose is relatively generic and is for many different tasks, the primary purpose is for plant breeders to track specimens within a greenhouse. Plant breeders that PhenoApps has worked with closely have been tracking samples by hand, which is a highly manual and worker-intensive task. Verify alleviates the process by allowing each worker to have a device that can scan bar-coded samples. Greenhouses populated with samples typically have a unique bar-code per sample. The workflow of Verify is to import a list of samples and use the various modes to mutate the database. Figure 1 shows the most common and basic usage of Verify, which is the ability to select an imported sample and view meta-data in the SQLite database. Users can optionally select a row by clicking an item in the enumerated list or
type a given name within the text view, which is below the list. The following are the defined modes that are within Verify: default, match, filter, color, and pair. All of which are described, along with performance analysis, time-complexity analysis, and space complexity analysis within Chapter 1 of ‘Open source application development for phenotypic data acquisition.’
Bar-code scanning happens in two different ways. The user may connect an external device; when an identifier is scanned, the decoded string registers into the text view for selection. Users may use their camera to capture the bar-code, which is decoded into a string and placed in the main text view. The API used for on-device bar-code scanning is very efficient and, by default, over scans items, by scanning them more than once.
Verify utilizes multiple novel algorithms that augment daily high-throughput
phenotyping tasks. A suppressive algorithm nullifies the multitude of scans for ease to the user. Verify requires Android devices to have at least version 4.1 and currently has over 10,000 installs on the Google Play Store. Currently, there are no other applications for bar-code based acquisition of plant samples. With the previous features, Verify is a significant improvement and contribution to mobile high-throughput phenotyping. Many basic features of Verify, including handling the Android file system, are freely available and should guide new developers. Many features of Verify are embedded as fragments. Each fragment has its functionality and can be used within other applications with little interoperability overhead. Verify sets a new path for bar-coding samples by speeding up bar-code recognition and utilizing an easy user interface. Intercross, another application discussed in this dissertation, also utilizes Verify’s bar-coding fragment. All application code and resources are available freely; the link is available in Appendix A.
Survey
With the need for precise latitude-longitude data acquisition on mobile phones, we developed a new PhenoApp, called Survey. Survey uses the default SQLite database on Android phones to store location data for plot-based phenotypic data acquisition. Fieldworkers can navigate fields of plots and not only determine their exact location, but they can also query which plot they are closest to or facing. Survey uses the Haversine method to calculate and base localized distances on exact geodesic paths [6]. With the release of the global navigation satellite system (GNSS) providers for Android, Survey can read and parse real-time GNSS messages [7]. Using GNSS messages, Survey can access a multitude of satellite constellation features,
including the number of satellites the device is communicating with and their locations. The default accuracy of mobile devices is known and only accurate within 10 meters [8]. A novel feature of Survey is the ability to connect to an external global positioning system (GPS) provider for a higher level of accuracy and precision. Although the implementation is
generalized for any such external device, PhenoApps has tested the Tersus GPS receiver along with the Emlid Reach. PhenoApps concluded that the Tersus lacked not only universal
asynchronous receiver-transmitter (UART) capabilities, but their technical support staff was negligent. Although the Emlid Reach device has similar issues with technical support staff, it turns out to be more robust and easier to use for testing purposes. The Emlid Reach is capable of sending real-time kinematic (RTK) corrected National Marine Electronics Association (NMEA) messages from a base to a rover, which can pair with mobile devices. The Emlid Reach’s initialization creates a web server hot-spot that mobile devices with a wireless module may
connect to and configure their rover or base [9]. After initialization is complete, Survey uses Android’s JetPack architecture for viewing data in real-time.
Survey is not yet released on any online market and has gone through two significant version changes. Initially, Survey attempted to create a programmable interface for the Tersus GPS; this was soon replaced by Survey V2, which uses the reasonably new Android JetPack architecture libraries [10]. A field survey verifies the accuracy of such devices on one of Kansas State University’s research farming plots. Two Emlid Reach RS devices are used for the survey. The base device was placed on a tripod and accumulated base coordinate data for five minutes before the survey. The base device outputs corrections data at a frequency of 868.0MHz, with an air data rate of 18.23 kb/s and an output power of 12dBm on its long-range radio (LoRa) module. For RTK settings, the elevation mask angle was at 15 degrees, and the SNR mask was 35, max horizontal and vertical acceleration was 1 m/s^2. The field study is named Single Plant
Associated Mapping (SPAM). It is an accumulation of 30 data points to test the accuracy of Emlid Reach. Fixed point RTK coordinates have 0.5cm accuracy. The rover can either be in single precision, float precision, or fixed precision mode in order of increasing accuracy, respectively.
In the experiment, there existed 2’x2’ in shape with four plant samples per plot. A subset of the plots was chosen to visualize if the output coordinates could informally distinguish
between different plant samples within each plot. The experiment was split into two different sections to test the amount of time needed per coordinate acquisition and how it would affect the accuracy of the results. The first section acquired fixed points by correcting rover coordinates with the base. Although this was at times not possible due to weather conditions. Each sample was a collection of fixed point data for ten seconds. If the fix was not possible, then the point was taken with float coordinates. The second section attempted a faster acquisition of points by collecting the data immediately after the rover survey pole was planted into the ground; most points achieved float. Some samples reached a fixed point within five seconds. The output geographical JavaScript Object Notation (geoJSON) files are available in Appendix A.
The development of Survey contributes multiple algorithms for state-of-the-art high-throughput phenotyping. Survey’s impact zone algorithm utilizes geographic data coupled with an on-device accelerometer and magnetometer to visualize the direction and location of a user and their surveyed points. This computation is novel and has vast usability for Android
developers. Along with the impact zone algorithm, a parameterized location listener is introduced from Survey. The parameterized location listener is an alternative PhenoApps Android library, which creates further fine-tuning on Android’s default GPS class.
RTCM3 Message Constellation Frequency Updated
1002 GPS L1 Observations 1Hz
1006 ARP Station Coordinates 0.1Hz
1008 Antenna type 1Hz 1010 GLONASS L1 observations 1Hz 1019 GPS Ephemeris 1Hz 1020 GLONASS Ephemeris 1Hz 1097 GALILEO 1Hz 1107 SBAS 1Hz 1117 QZSS 1Hz
Table 1: RTCM3 message update parameters for the SPAM survey.
Furthermore, there are no modern GNSS parsers for Android development. The
development of Survey has spawned many of the previously mentioned features, which can all be used independently for other applications. This contribution of libraries and algorithms is a significant contribution of Survey, which has been a fundamental aspect of research in high-throughput phenotyping. Readers and developers are encouraged to explore Survey’s repository in Appendix A and extend these algorithms and libraries for other new applications.
Intercross
Intercross is an Android application for tracking hierarchical crosses in a database. The motivation for this application comes from two different plant research facilities. The
International Institute of Tropical Agriculture uses hand-written labels for tracking their crosses and requires a modern solution to create redundancy and simplify the plant research workflow. A cross is the child of a set of parent plants. Bi-parental plants have a unique male and female parent. Open-pollinated plants have two female parents. Self-pollinated plants have a single female parent. Finally, a poly-cross has a set of male parents with one female parent.
Intercross uses these classifications at the data-entry time to populate a view-able list to the user, which describes the time of crossing, the user who made the cross, and the pollination classification. Along with IITA, the Centro Internacional del Papas is another group that needed a new solution for crossing plants. Previously, CIP was using Microsoft Motorola phones, which have embedded bar-code scanners. The research group at CIP claims that the software was difficult to change on these devices when they needed certain features. Along with this, the devices are expensive and should be replaced with cheaper Android devices; furthermore, Microsoft no longer produces or supports Windows mobile devices. As many people in the world use Android devices, they are more familiar with their universal design and usages. Android devices also contain modern components, whereas the Motorola Windows mobile devices were using resistive-touch screens, which require a physical press on the screen. These resistive-touch screens are less accurate than modern Android phone screens.
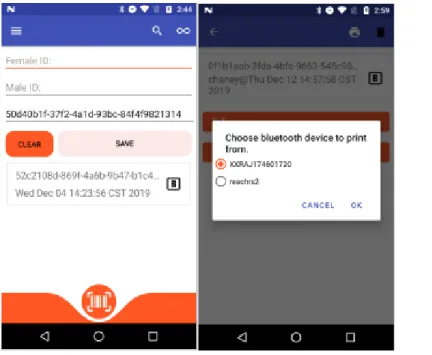
The usage of Intercross involves three necessary steps: acquiring, querying, and printing data. The user has many different ways to acquire data. Most naively, the user may input data by typing a male, female, and cross name manually into three text boxes shown on the main page. Intercross also has the option to scan data using the rear camera on the device. The scanning mode has three different options, search, single, and continuous. The search mode brings up a cross-specific page for the bar-code. Single-mode scans a bar-code and places the scanned id onto the next relevant text view. For example, if the male and female text view is filled
previously, the single scan fills in the cross text view. Finally, the continuous mode takes three consecutively delayed pictures, one for male, female, and cross. It enters this into the database without transitioning back to the homepage. This cycle continues until the user manually returns. The camera scanning uses Android SharedViewModels to send data between fragments within
the application. SharedViewModels use the observer pattern; in this case, the camera fragment submits bar-code data to the model. At the same time, the main page listens for changes to the model and populates the user-interface (UI) with the bar-code data.
Intercross was made for ease of data entry. There are individual automatic contextual switches when entering data. For example, when a user enters data into the female text view and submits enter, the text view automatically transitions to the male text view. The user input acts as a finite state automaton, where each state of the machine is either in empty, first, second, third, and filled mode. Where each mode correlates to the text view, which is currently filled-up to, user settings that allow for flexibility of data entry do change this model. Users have the option to enter data for males first, whereas Intercross complies with female-first data entry by default. Another such setting is the ability to allow for blank-males, where male data skip entirely. Meta-data entry is also a non-default option for each cross, where the user can track the count of seeds, flowers, and fruits of a plant. With this setting, the cross-entry page prompts the user with information about the sample. Users have the option to fill cross entry text views automatically. There is an option to automatically generate cross id's using universally unique identifier (UUID) strings or patterns. Pattern generation in Intercross allows the user to define a simple regex-type pattern where they use a prefix, suffix, and middle number. The middle number can have a preset value or start at zero and has the option for padding at any arbitrary length. As cross ids are needed, the middle number increments for a unique id. Intercross also has the option for audio notifications; these notifications occur when a new cross enters into the database, and if a wish-list fulfills.
The main features of Intercross include wish-lits creation, parental summaries, cross counts, a pollen manager, and an import method for initializing parental samples. The summary page displays a list of parental pairs and a number for each, representing the unique crosses for that pair. The user can go to the cross-entry specific page for each child by clicking the parental pairs. The UI creates a list of children, which are enumerated using their buttons. An import file defines wish-lists with the following headers: fid, mid, fname, mname, type, min, max. Fid and mid are the bar-codes for the female and male parent. Fname and mname are text aliases for each bar-code. Type, min, and max are specific to wish=list imports. A wish-list defines a list of integer values for certain possible events in Intercross.
The events include cross entries, fruits, and seeds. When a sure cross id submits to the database, its parents are checked if they exist within the wish-list table. If the parental pair exists,
then a counter is incremented. The user is then notified when a minimum and a maximum number of these events are counted. Pollen bag management defines the functionality for dealing with poly crosses, which are cross entries that have a set of males with a magnitude greater than one. Poly crosses are managed similarly to Unix groups; the user interacts with two separate fragments.
The first fragment defines a list of groups. The user enters a text name for the group, which generates a bar-code-based on a UUID. A table updates with the group name and the randomly generated UUID. The user can click a row in the list of group names to move to the pollen fragment. The pollen fragment screen allows the user to enter data manually or via the camera. These populate the set of males for a given group. This page also has a print function that prints a bar-code label for the group. The group label can then be used instead of a typical parental scan. When the cross entries export to a file, the males contained with the group set are semi-colon delimited. Finally, for bar-code based plant research, there must be a way to initialize a plot or greenhouse with labels. Otherwise, users would be constrained to manual entry. The parental import feature uses the headers defined above to import a list of parents. On this fragment, males and females separate into two lists. The user can highlight items to select each parent. When the user presses the print button, a batched job prints each parental label. Because these initial parents are not crosses, they are not tracked within the main table of Intercross, and they hold no individual cross-entry page.
Figure 4 shows the main data-entry page of Intercross. This fragment has three text boxes for user input, a button to clear the entered data, a button to submit data to the database, and a list to view crosses entered. Once data is entered, the new cross is appended to the top of the list on the page. When a user selects a precise cross entry, a new fragment is viewed, which is the
cross-entry page related to the selected cross. The cross cross-entry page is populated with data relevant to that cross and is the page that allows the printing of bar-codes. Specifically, the cross entry page allows users to travel to the parent cross entry pages of the current cross, and enter the number of fruits, flowers, and seeds acquired from the plant.
Intercross has played a significant role for breeders in plant science. Evaluation, crossing, and sampling are the primary steps for breeders; each step is a fundamental part of
high-throughput phenotyping. Evaluation is a generic step of accumulating data and processing results using various algorithms intended for the subject. The sampling step filters the population of plant experiments based on the evaluation. Finally, the crossing step is essential for pairing previously sampled parents for breeding. The output breed, or cross, is the input for the next iteration of evaluation. This process life-cycle of sampling, crossing, and evaluating is essential
for plant scientists. Previously, this dissertation discussed Verify, which is used for sampling. Many Android applications can be used for evaluation, including FieldBook, OneKK, and Prospector. The only application that currently solves the crossing step is Intercross. This fundamental step has previously been accomplished by hand or out-dated-devices. Intercross contributes to high-throughput phenotyping by developing a solution to this task of crossing. Multiple novel algorithms and design architectures are used in Intercross. These contributions are highlighted in Chapter 3, Development Tools. These tools are created to ease the
development of Android applications and reduce the number of run-time errors. Originally, Intercross was a Java application that did not use the Jetpack libraries. We developed the Java to Kotlin translator to explore the possibilities of Kotlin and to reduce code-base sizes while decreasing maintenance time of applications. With the use of Kotlin, the Shared Preference Fragment and Typed Data Bindings can be utilized, which are discussed in Chapter 3. Intercross is an accumulation of the novel tools and libraries developed for Android development. It serves as a template or guide for future developers.
OneKK and Abacus
One-thousand Kernels (OneKK) and Abacus are two Android applications for analyzing various features of seeds. While Abacus focuses on counting seeds in videos and images, OneKK aims at mining features of seeds such as their areas. OneKK and Abacus are both still in
development but have feature-rich versions. Both applications use the Watershed segmentation algorithm to separate clusters and use mined ground truth kernels to estimate cluster sizes. The data input into Abacus for video is required to be a flow of seeds in a downward direction. The seed tracking algorithm was created for desktop environments and solved the issue of seeds colliding during the tracking process [11]. The original algorithm worked well on desktop environments but performs poorly on mobile devices due to various computational bottlenecks; for example, part of Watershed requires a per-pixel search for labels. Efforts alleviate this bottleneck while still using Watershed. Optimizations include pixel skipping when labeling Watershed markers. Larger pixel skips can lead to inaccuracies, but basing pixel skip length based on the average kernel area of objects in the scene proved impressive performance boosts. Another bottleneck included searching for the maximum distance transform value, which is a pre-Watershed step for automated marker creation. Another algorithm was created based on cluster estimation, which relies on ground truth data in the image. The critical assumption of the cluster estimation method is to have some seeds disconnected from each other in the image. The cluster estimation method can mine contours that are disconnected, and then estimate cluster counts based on the averages of the ground truth area, perimeter, and inflection point count. With the rise in deep learning and real-time object detection capabilities of RCNN networks, Abacus and OneKK are now planning to use such models to identify objects. More
information on the experimental setup, datasets, and algorithms used for detection is available in the Computer Vision chapter.
Processing video on mobile devices requires a significant amount of time and is
computationally intensive. Along with this, at the time of creation, the Open Computer Vision (OpenCV) Android library did not have video processing functions. Abacus uses pre-built fast forward Moving Pictures Experts Group (FFMPEG) libraries to extract frames from videos. Then each frame is used within a detection algorithm to count the flow of seeds in the video. Two algorithms are used for frame processing. One algorithm processes frames in a batch as they are being extracted from the video. In contrast, the second algorithm extracts the entire frame sequence before running the image processing algorithm. The former algorithm shows slight improvements in run-time, but both are not real-time systems. These were both preliminary solutions to test whether real-time object detection was feasible with OpenCV and FFMPEG on Android devices. General RCNN models are necessary for real-time object detection. The cluster estimation algorithm requires parameters for an accurate result. A full-fledged seed classifier and counter would require multiple implementations of the cluster estimation algorithm. For
example, one algorithm tuned on wheat seeds would not perform well on corn or soybeans theoretically.
A solution to this problem is to generate contour data for each seed kernel type and feed the contours to a RCNN model for real-time detection and classification. As OneKK requires contour mask data, MaskRCNN would be suitable, while FasterRCNN or SSDMobilenet is suitable for Abacus. Contour mask data is simply the array pixel values that bound a given contour; this information can be used to calculate the features required in OneKK such as area. While Abacus requires real-time object counting, SSDMobilenet is a good alternative as the
output is a localization of a bounding box with a class label. Future applications that involve simple classification of seed kernels can use any of the typical linear regression CNN models such as Visual Geometry Group Net (VGGNet), Resnet, and Mobilenet.
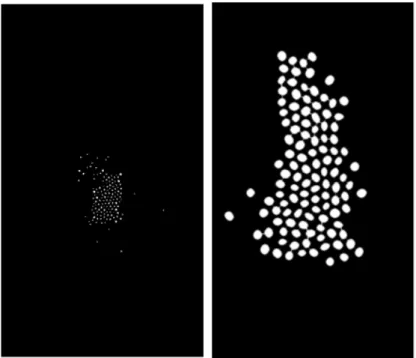
There are limitations and trade-offs to using Watershed, the commonly used
segmentation algorithm in image processing. Figure 7 shows a pre-processing step to Watershed, which is the distance transform. The distance transforms, also known as Euclidean mapping, creates a new image that replaces pixels with a value representing their distances from a border. Therefore, the pixels representing the center of gravity for objects is the highest value. Applying the same method to canola, Figure 7 shows promising segmentation. However, looking closely, some canola seeds are lost from the original image. The distance transform creates a sure
foreground image which represents the markers of objects, a parameter to Watershed. Typically, when the markers are too small, this leads to over-segmentation of objects, a typical result of
Watershed. Therefore, the final count of images is an over-count if post-processing cannot account for over-segmentation. Fundamentally, a higher resolution image would be more precise for this measurement but overall would take longer to process, especially when working on a mobile device. Therefore, this dissertation proposes a simple trade-off guideline for creating image processing algorithms reliant on Watershed.
The resolution, accuracy, run-time diagram (RAT), illustrated in Figure 8, specifies this connection: the run-time and accuracy of an algorithm are dependent on the resolution of the image. Therefore, at higher resolutions, image processing algorithms take longer to run but may achieve higher accuracy in results, and fidelity in measurements. Subsequently, more precise requirements require a higher-resolution input but have a longer run-time. Because Abacus requires real-time processing in the video, further iterations of this algorithm focus on maximizing accuracy while maintaining real-time requirements.
For OneKK, it is possible to have multiple modes of processing. Some users may be interested in fast results and lower accuracy. Other users may not mind the wait for higher accuracy.
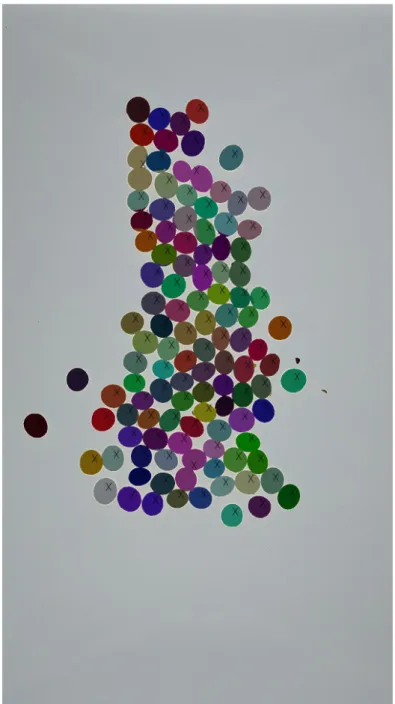
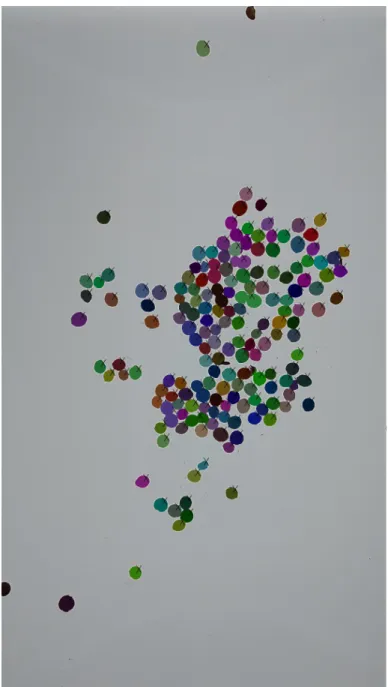
OneKK is a soon-to-be-released application with a novel hierarchy-based cluster counting algorithm. The complete algorithm is not described in this dissertation. However, preliminary results describe the efficacy of these methods. Figures 9-14 show the visual results and counts for each image. Because this algorithm relies on a distinct difference between the kernel’s color and the background, white rice performs very poorly. These are preliminary results; therefore, the algorithm may be modified to account for white objects in future iterations. The count ranges are output from two different algorithms. One uses ground truth areas to estimate cluster counts. In contrast, another uses the difference between contour curvatures and their convex hulls to count clusters. Therefore, for the area-based estimations, a sample size of ground truths with a reliable standard deviation (accounts for the total population) in the area is required to maximize accuracy. Along with area-based measurements, the kernels which have been appropriately segmented can be measured using minimum area rotated rectangles to calculate their minimum and maximum axis.
Figure 9 shows the output of OneKK on a sample of 115 soybeans. The algorithm estimates that this picture contains 110-115 beans using its convexity estimation method. The area-based estimation range is 112-115. The lower bound inaccuracies are due to cluster
Figure 10 shows the OneKK output on wheat kernels. The convexity-based counting range is 150-170 while the area-based counting range is 150-169. Both methods give very similar results in this case. Wheat seeds are more difficult to segment than more spherical objects. There is apparent over-segmentation within the wheat kernels, these over-segmentations aren’t counted but would affect the overall area measurements.
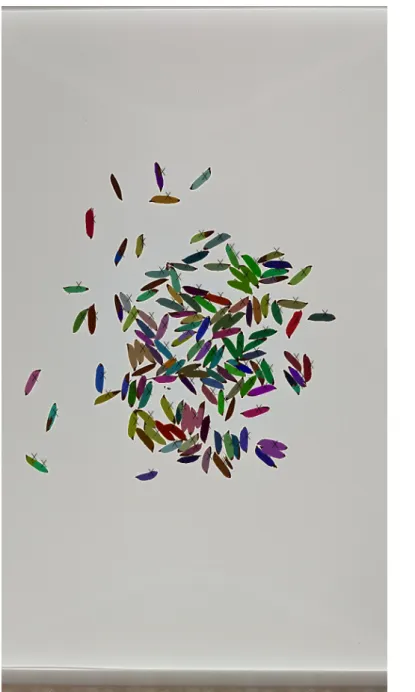
For sorghum, in Figure 11, the convexity count is 170-173 and the area-based count is 170-177.
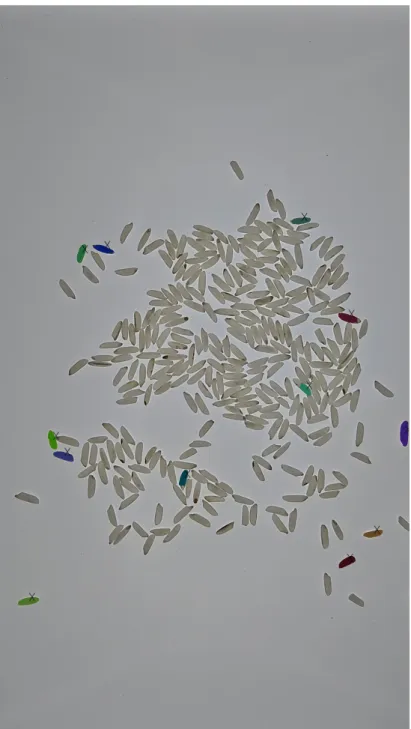
Rough rice kernels, shown in Figure 12, have the most apparent over-segmentation of kernels. As shown in the image, some inner kernels are not shaded. The shaded contours represent the counted objects. The results give a slight undercount, but the final area and dimensions are inaccurate. The final count using the convexity-based estimation is 125-127,
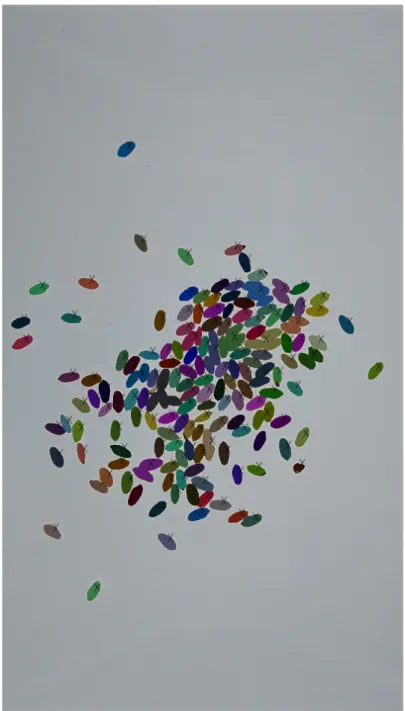
while the area-based estimation is 121-127. Figure 13 shows the results for white rice. These results are by far the worst of all the kernel dataset. The image contains 317 white rice kernels, but the final count range is only 12-12 for both methods. Finally, Figure 14 shows the output for canola seeds. The total count for this image is 136, but the convexity range is 141-142, and the area-based range is 141-149. Both methods show an over-count for these kernels for a unique aspect. Between canola kernels, white space is detected as its kernel. Because the canola seeds are tightly clustered, the disjoint background between connections become their detected contours. These false positives are alleviated by searching all pixels within each contour for a certain intensity of white. The contours are filtered by checking if it contains a white intensity similar to the background. Filtering helps reduce the over-counting problem.
The mobile application of counting multiple types of seed kernels in a natural laboratory environment has never been accomplished before. OneKK has the unique ability to count five different seed types effectively. OneKK accomplishes this by requiring the use of a lightbox, and multiple novel estimation algorithms for accurately identifying clusters based on ground truth mined data. Watershed has been widely researched and accepted as the best for object
segmentation in image processing. Problematically, the traditional usage of Watershed is infeasible on mobile devices for applications that want real-time results. OneKK proposes a solution to counting multiple class objects in a reasonable amount of time, which is a major contribution to mobile high-throughput phenotyping. The image algorithms and area estimations are also novel and contribute to the society of computer scientists. With the future moving toward extended use of deep neural networks, applications like OneKK, should be further studied to explore the utility of image processing. The deep learning community has full application and is promoted for its generality and performance. However, zero-data-needed
image processing algorithms are powerful. The use of such algorithms requires no overhead of training models, reflecting good practice for solving rudimentary computer vision tasks. Chapter 4, Computer Vision, discusses these applications further and aspires to build a new hybrid deep learning image processing pathway.
Rangle
Rangle is an in-development project that focuses on calculating root-angles of various plants. Currently, there is an Android implementation for manually calculating the root angles by using Canvas drawing. The user may upload an image, draw lines over the roots, and produce an angle as output. Multiple Python preliminary scripts are in development to quantify root angles automatically. The scripts typically have a pre-processing segment to threshold the roots from the background. One script uses an iterative Hough Lines transform to model the roots as lines. Another script uses convex hull calculations to find the furthest points from the root. The low quality of the test images creates inconsistencies for the scripts, which is the motivation for creating an Android application. Roots may have an unpredictable growth network such as interleaving roots, making automatic angle calculation difficult.
Figures 16 and 17 show the various original images taken. The main goal of this project is to find a reproducible way to calculate root angles. However, the original images can be manipulated, and there is no requirement for using the original dataset. The original dataset is fundamentally challenging to create generic angle inference because of the varying scales (pictures taken at different heights) and variation in whether the roots were taken in a container or not. Finally, some samples have no roots or interleaving roots. The first step of this project was to recreate the dataset so that each sample image had one root sample with a uniform blue background. Figure 15 shows what the new dataset looks like, which is a cropped version of the original; each image should have a single sample. With this given, the following algorithm can be applied using OpenCV libraries. First, a color threshold occurs to eliminate the blue
background from the foreground object. Secondly, Otsu’s thresholding creates a binary image
representing the background (white) and the foreground object (black) [12]. Finally, the
foreground object is processed and found as a contour. The contour can then be represented as a convex hull. The convexity defects are then found (the difference between the hull and the contour) to calculate the root angle. However, there are many convexity defects on naturally occurring manifolds; therefore, a greedy algorithm search is used to find the left and right-most contour points. These contour points then form a line with the contours center-of-mass
(calculated using Hu moments), and an angle can be calculated [12].
From the limitations of image processing algorithms, it is not always possible to infer a root angle given any image. For this reason, an Android application was created and available for reference in Appendix A. This application utilizes a drawing canvas surface for user-annotated root angles. Lines are then generated, given these user-inputted points to calculate a root angle.
Chapter 1 -
Chapter 2 -
Chapter 3 -
Chapter 4 -
Chapter 5 -
Chapter 6 -
Chapter 7 -
Chapter 8 -
Chapter 9 -
Chapter 10 -
Chapter 11 -
Automatic root angle measuring is a new field with no current alternative to the Rangle process. The significant contribution from Rangle is the ability to automatically calculate the angle between the two most distance root paths. Previously, plant scientists were required to manually calculate angles on the plant itself, which introduced human error. Rangle simplifies the process by only requiring the user to take a picture, and speeds up the calculations
Figure 19: Greedy algorithm used to calculate root angles.
Rangle(img, contour):
#finds center of contour in row, column format within the image center = centerOfMass(contour)
#find the hull and differences between the hull and the contour hull = convexHull(contour)
defects = convexityDefects(contour, hull)
#initialize left-most and right-most points (row column format) left = (0, img.width)
right = (0,0)
#search through all defect points to find left and right-most points for x,y in defects:
if left.x > x and left.y < y: left = (y,x)
if right.x < x and right.y < y: right = (y,x)
significantly. The greedy algorithm and image processing code are also novel, which show promising results for evaluating contours of simple blob detected objects.
Chapter 3 – Development Tools
Motivation
As the high-throughput phenotyping community grows, there is a need to expand
available tools and libraries to accommodate users solving similar problems. Chapter 2 discussed a plethora of applications for this community. Not surprisingly, application architecture and fundamental modules such as file input and output operations are relatively static and can be used ubiquitously throughout all applications.
The tools described in this chapter are libraries and scripts that reduce development time and data generation. The Auto Preference Fragment and Type Data Binding Fragments sections are specifically for Android development. They both aim at reducing boilerplate code with newly proposed architectures and code generation. The Automatic Cluster Generator (ACG) section describes a script and user-interface tool for ease of annotating datasets. The ACG is a
supervised tool for generating Microsoft COCO annotations [13]. The latter script aims at reducing the time it takes to annotate large datasets of images with class labels. Currently, there are many different annotation tools in existence specific to COCO, but none offer a semi-automated approach. Most annotation tools focus on multi-class labeling, while this approach leverages the assumption that users are annotating one class at a time and can infer potential regions based on pre-processing user input.
Auto Preference Fragment
The Auto Preferences Fragment aims at reducing boilerplate code by wrapping typical Android Shared Preferences code into class members that are extended by fragment specific code. Developers can efficiently utilize the Auto Preference Gradle plugin by modifying their Gradle build script file in a given Android project. The only parameters required to the Gradle Auto Preference extension are the package name and path to the preferences file that defines the Shared Preferences setting layout.
The Android resources folder contains extensible markup language (XML) definitions
preference file that contains the relative view hierarchy for the settings page. Developers
typically use the PreferenceFragment Android class to load preference resources into a template view based on the XML definition in the file. This template view is ubiquitous across Android applications and contains different widgets for persisting user-specific data. The XML file always has a PreferenceCategory root tag. It embeds a tree of other tags such as
PreferenceTextView, and PreferenceRadioBox. Each preference view contains a unique user-defined key and other optional attributes. When developers need to access the persisted data from the settings, they must query a SharedPreferences service with the key defined in the settings file. Developers who define such a preference file can utilize the Auto Preference
Fragment plugin. The plugin uses XML processing libraries to parse and translate each XML tag into the fields of a class. Figure 20 shows an example of such a file where multiple settings are defined in an application. The rendered version of this settings page is viewed in Figure 21.
The plugin begins by recursively searching the resources folder of the project. When a file with the parameterized name is found, it is parsed and finds the first Preference Category tag. The children nodes of the category tag are parsed, and a file is created with the generated code for each parsed tag. The current supported Preferences are EditTextPreference,
CheckBoxPreference, ListPreference, DropDownPreference, MultiSelectListPreference,
SwitchPreference, and SeekBarPreference. Figure 23 describes the idiosyncratic nature of using Shared Preferences; however, this is an example of an automatically generated preference class that eliminates the need to program such details. To query for variables, the user needs to know the key defined within the preferences file. Furthermore, to edit that setting, the developer is required to create a Shared Preference Editor object using a call to the Shared Preferences object.
The generated code aims at replacing this idiosyncratic code with typical variable assignment statements. If the user chooses to extend the generated Auto Preference Fragment, the generated fields from the superclass are inherited. The generated fields correlate to the preference tags defined in XML. By generating getters and setters for each field, the user then has access to each setting as a standard variable in Java or Kotlin without having to know the key of that specific settings tag. The AutoPreferenceFragment code can be extended or modified by the user to define getters and setters optionally.
Figure 22: Automatically generated code based on a user's preference file.
Figure 23 is an example of a piece of code that queries and edits a Shared Preference setting with the typical key-value pair defined in the preferences file. The assert statement shows the generated Auto Preference variable being used to verify equality between the two
implementations. The person variable can also be updated using typical assignment statements, which is a wrapper to the typical idiosyncratic code. Auto Preference Fragments default to asynchronous updates using the apply method. A future implementation may extend this class to allow the developer to decide how the variables are updated in the settings.
Figure 23: A comparison between preference querying.
The Gradle files and project source code is available in Appendix A. In conclusion, this plugin is ideal for new and experienced Android developers. They want to replace Shared Preferences based boiler-plate code with class fields automatically. The setup for this project is simple and has a concise parser for further extensions. Currently, the plugin supports all
available Preference views and is a recommended plugin for application development. This plugin is novel to Android developers and is a simple code generative project for reducing development time.
Typed Data Binding Fragments
As the Android ecosystem grows, more developers are starting to learn how to create mobile applications. The ability to freely submit applications and monetize features has pulled in developers. The Android software development kit (SDK) is continuously updated to alleviate specific problems with old architectures and replace them with new and more comfortable or more flexible versions. The newest of which is the Jetpack libraries. The introduction of Jetpack libraries defined a new system for binding variables to view object definitions. The system in Jetpack is called data binding, which allows the user to define a given variable for a view within the fragment layout XML file [10]. Jetpack dynamically generates a class file that represents the views defined in the layout, and the variables defined in a particular top-level data tag. The proposed Typed Data Binding Fragment is an extension to the data binding plugin of the Jetpack libraries. This proposed methodology replaces layout querying functions with references to the view objects built by the dynamically generated data binding class. Currently, when developing Android applications, the user is required to call the ‘findViewById’ function to query their layout files for view ids. These view ids then create a local object for the developer to modify the UI or other front-end elements of their application. This section provides a replacement for ‘findViewById’ calls. It decreases the learning curve for starters while also eliminating boiler-plate code.
The suggested methodology for using Type Data Binding Fragments is to use the generated data binding class as a reified type to a fragment’s class signature. A use-case reference is the application Intercross defined in Chapter 2. Within Intercross, a base fragment class defines a type that extends the base class ViewDataBinding [10]. The base fragment also