University.
This version was downloaded from Northumbria Research Link: http://nrl.northumbria.ac.uk/36260/
Northumbria University has developed Northumbria Research Link (NRL) to enable users to access the University’s research output. Copyright © and moral rights for items on NRL are retained by the individual author(s) and/or other copyright owners. Single copies of full items can be reproduced, displayed or performed, and given to third parties in any format or medium for personal research or study, educational, or not-for-profit purposes without prior permission or charge, provided the authors, title and full bibliographic details are given, as well as a hyperlink and/or URL to the original metadata page. The content must not be changed in any way. Full items must not be sold commercially in any format or medium without formal permission of the copyright holder. The full policy is available online: http://nrl.northumbria.ac.uk/policies.html
UNSUPERVISED FEATURE
SELECTION METHODS FOR
HIGH DIMENSIONAL
BIOMEDICAL DATA IN
REGRESSION DOMAIN
by
Ferdi SARAC
A thesis submitted in partial fulfillment of the requirements of
Northumbria University for the degree of Doctor of Philosophy
I declare that the work contained in this thesis has not been submitted for any other award and that it is all my own work. I also confirm that this work fully acknowledges opinions, ideas and contributions from the work of others. Any ethical clearance for the research presented in this thesis has been approved. Ap-proval has been sought and granted by the Faculty Ethics Committee / University Ethics Committee / external committee 12.09.2015
FERDI SARAC Signed:
Date:
In line with technological developments, there is almost no limit to collect data of high dimension in various fields including bioinformatics. In most cases, these high dimensional datasets contain many irrelevant or noisy features which need to be filtered out to find a small but biologically meaningful set of attributes. Although there have been various attempts to select predictive feature sets from high dimensional data in classification and clustering, there have only been lim-ited attempts to do this for regression problems. Since supervised feature selec-tion methods tend to identify noisy features in addiselec-tion to discriminative vari-ables, unsupervised feature selection methods (USFSMs) are generally regarded as more unbiased approaches. The aim of this thesis is, therefore, to provide (i) a comprehensive overview of feature selection methods for regression problems where feature selection methods are shown along with their types, references, sources, and code repositories (ii) a taxonomy of feature selection methods for regression problems to assist researchers to select appropriate feature selection methods for their research (iii) a deep learning based unsupervised feature se-lection framework, DFSFR (iv) a K-means based unsupervised feature sese-lection method, KBFS. To the best of our knowledge, DFSFR is the first deep learning based method to be designed particularly for regression tasks. In addition, a hy-brid USFSM, DKBFS, is proposed which combines KBFS and DFSFR to select discriminative features from very high dimensional data. The proposed frame-works are compared with the state-of-the-art USFSMs, including Multi Cluster Feature Selection (MCFS), Embedded Unsupervised Feature Selection (EUFS), Infinite Feature Selection (InFS), Spectral Regression Feature Selection (SPFS), Laplacian Score Feature Selection (LapFS), and Term Variance Feature Selection (TV) along with the entire feature sets as well as the methods used in previous studies. To evaluate the effectiveness of proposed methods, four different case studies are considered: (i) a low dimensional RV144 vaccine dataset; (ii) three different high dimensional peptide binding affinity datasets; (iii) a very high di-mensional GSE44763 dataset; (iv) a very high didi-mensional GSE40279 dataset. Experimental results from these data sets are used to validate the effectiveness of the proposed methods. Compared to state-of-the-art feature selection meth-ods, the proposed methods achieve improvements in prediction accuracy of as much as 9% for the RV144 Vaccine dataset, 75% for the peptide binding affinity datasets, 3% for the GSE44763 dataset, and 55% for the GSE40279 dataset.
The present work is generated and developed during 3 years as a graduate student in a warm, friendly research and study environment at Northumbria University, Newcastle. The author would like to thank his principal supervisor Dr. Huseyin Seker, for leading me to success and for sharing his knowledge and time like a friend throughout the author’s 3 years of PhD study. The author would also like to thank his second supervisor Prof. Ahmed Bouridane for his invaluable support, assistance and guidance.
Declaration of Authorship i Abstract iii Acknowledgements iv List of Figures ix List of Tables x Abbreviations xiii
List of Publications xiv
1 Introduction 1
1.1 Motivation . . . 1
1.2 Aims and Objectives of This Thesis . . . 3
1.3 Contributions of the Thesis . . . 7
1.4 Thesis Overview. . . 8
2 Review on Feature Selection Methods 10 2.1 Challenges of Dealing With High Dimensional Data . . . 10
2.2 Curse of Dimensionality . . . 11
2.3 Feature Selection and Feature Extraction . . . 13
2.4 Supervised Feature Selection . . . 15
2.4.1 Filter Methods . . . 15
2.4.1.1 Correlation Based Feature Selection (CFS). . . . 15
2.4.1.2 Minimum Redundancy Maximum Relevance (mRmR) 16 2.4.1.3 Canonical Correlation Analysis (CCA) . . . 17
2.4.1.4 Maximum Likelihood Feature Selection (MLFS) . 17 2.4.1.5 Least Squares Feature Selection (LSFS) . . . 18
2.4.1.6 Distance Measure Based Conditional Mutual In-formation (CM IDIST) . . . 18
2.4.1.7 Selection via Intersection Method (SEVIM) . . . 19
2.4.2 Wrappers . . . 19
2.4.2.1 Sequential Forward Selection (SFS) . . . 20
2.4.2.2 Sequential Backward Selection (SBS) . . . 20
2.4.2.3 Sequential Floating Selection (SFLS) . . . 21
2.4.2.4 Bi-Directional Search. . . 22
2.4.2.5 Feature Selection by Computing Statistical Scores (FeaLect) . . . 22
2.4.3 Embedded Methods. . . 23
2.4.3.1 Least Absolute Shrinkage and Selection Operator (LASSO) . . . 23
2.4.3.2 High-Dimensional Feature Selection by Feature-Wise Kernelized Lasso (HSIC LASSO) . . . 24
2.4.3.3 Least Angle Regression for Feature Selection (LARS) 25 2.4.3.4 GUIDE . . . 25
2.4.3.5 Minimum Redundancy Spectral Feature Selection (MRSF) . . . 25
2.4.3.6 Elastic Net (EN) . . . 26
2.4.4 Remarks on the Use of Supervised Feature Selection. . . . 27
2.5 Unsupervised Feature Selection Methods . . . 27
2.5.1 Filter Methods . . . 27
2.5.1.1 Term Variance (TV) . . . 27
2.5.1.2 Infinite Feature Selection (InFS) . . . 29
2.5.1.3 Laplacian Score Feature Selection (LapFS) . . . . 29
2.5.1.4 Spectral Regression Feature Selection (SPEC) . 30 2.5.1.5 Trace Ratio Criterion for Feature Selection. . . . 30
2.5.1.6 KCEN . . . 31
2.5.2 Embedded Methods. . . 32
2.5.2.1 Multi-Cluster Feature Selection (MCFS) . . . 32
2.5.2.2 Unsupervised Discriminative Feature Selection (UDFS) . . . 33
2.5.2.3 Non Negative Discriminative Feature Selection (NDFS) . . . 34
2.5.2.4 Robust Unsupervised Feature Selection (RUFS) 34 2.5.2.5 Joint Embedding Learning and Sparse Regression (JELSR) . . . 35
2.5.2.6 Unsupervised Feature Selection with Adaptive Struc-ture Learning (FSASL) . . . 35
2.5.2.7 Embedded Unsupervised Feature Selection(EUFS) 36 2.5.2.8 Unsupervised Feature Selection Using Feature Sim-ilarity (FSFS) . . . 37
2.6 A Taxonomy of Feature Selection Methods for Regression . . . 37
2.7 Summary . . . 38
3.1 Prediction Methods . . . 43
3.1.1 Support Vector Regression . . . 43
3.1.2 Multi Support Vector Regression (MSVR) . . . 45
3.2 Data Sets . . . 46
3.2.1 RV144 HIV Vaccine. . . 46
3.2.1.1 Problem Statement . . . 46
3.2.1.2 The Data Set . . . 48
3.2.2 Peptide Binding Affinity . . . 49
3.2.2.1 Problem Statement . . . 49
3.2.2.2 The Data Sets . . . 50
3.2.3 Age and Obesity Prediction (The GSE44763 Data Set) . . 55
3.2.3.1 Problem Statement . . . 55
3.2.3.2 The GSE44763 Data Set . . . 56
3.2.4 Age Prediction (The GSE40279 Data Set) . . . 57
3.2.4.1 Problem Statement . . . 57
3.2.4.2 The GSE40279 Data Set . . . 57
3.3 Statistical Validation and Performance Evaluation Metrics . . . . 58
3.3.1 Statistical Validation of the Results . . . 59
3.3.2 Performance Evaluation Metrics . . . 59
3.3.2.1 Root Mean Square Error (RMSE). . . 59
3.3.2.2 Pearson Correlation Coefficient (PCC) . . . 60
3.3.2.3 Theil’s U Statistics . . . 60
3.3.2.4 Mean Absolute Deviation (MAD) . . . 60
3.3.2.5 Mean Absolute Percentage Error (MAPE) . . . . 61
3.3.2.6 Coefficient of Determination (q2) . . . . 61
3.3.2.7 Mean Square Error (MSE) . . . 61
3.4 Summary . . . 62
4 K-Means Based Unsupervised Feature Selection 63 4.1 Introduction . . . 63
4.2 K-Means Based Unsupervised Feature Selection Method (KBFS) . 64 4.3 Remarks on previous K-Means Based Feature Selection Methods . 72 4.4 Results . . . 73
4.4.1 Results for RV144 Vaccine Data Set . . . 74
4.4.1.1 Results for Multi-Input-Single-Output (MISO) and Multi-Input-Multi-Output (MIMO) Regression . 77 4.4.2 Results for Peptide Binding Affinity Data Sets . . . 78
4.4.3 Results for the GSE44763 Data Set . . . 81
4.4.3.1 Results for Multi Input-Single Output (MISO) and Multi Input-Multi Output (MIMO) Regression 83 4.4.4 Results for the GSE40279 Data Set . . . 84
4.4.4.1 An Aggressive Research of Features from GSE40279 Data Set. . . 85
5 Deep Learning Based Feature Selection for Regression (DFSFR) 91
5.1 Introduction . . . 91
5.2 Background . . . 92
5.3 Deep Learning Based Feature Selection for Regression (DFSFR) . 94 5.4 A Hybrid Unsupervised Feature Selection Method (DKBFS) . . . 98
5.5 Results . . . 101
5.5.1 Results for RV144 Vaccine Data Set . . . 101
5.5.1.1 Results for Multi-Input-Single-Output (MISO) and Multi-Input-Multi-Output (MIMO) Regression . 104 5.5.1.2 Additional Results and Discussion . . . 105
5.5.2 Results for Peptide Binding Affinity Data Sets . . . 109
5.5.3 Results for the GSE44763 Data Set . . . 113
5.5.3.1 Results for Multi Input-Single Output (MISO) and Multi Input-Multi Output (MIMO) Regression116 5.5.4 Results for the GSE40279 Data Set . . . 117
5.5.4.1 An Aggressive Research of Features from GSE40279 Data Set. . . 119
5.6 Summary . . . 120
6 Discussion 124 6.1 Discussion of the Results for RV144 Data . . . 124
6.2 Discussion of the Results for Peptide Binding Affinity Data Sets . 126 6.3 Discussion of the Results for GSE44763 Data Set . . . 126
6.4 Discussion of Results for GSE40279 Data Set. . . 128
6.5 General Discussion and Findings . . . 129
6.6 Discussion of SVR and MSVR . . . 130
6.7 Final Remarks. . . 131
7 Conclusions and Future Works 134 7.1 Conclusions . . . 134
7.2 Contributions to the Literature . . . 136
7.3 Future Works . . . 138
A CoEPrA Peptide Binding Affinity Data Sets 139
B Learning in Restricted Bolzman Machines 148
1.1 Growth trend in UCI Machine Learning Repository [1]. . . 3
1.2 A Comparison of Published Feature Selection Studies for Classifi-cation and Regression on PubMed. . . 5
1.3 A Comparison of Published Feature Selection Studies for Classifi-cation and Regression on Scopus. . . 6
1.4 A Comparison of Published Feature Selection Studies for Classifi-cation and Regression on Web of Science. . . 6
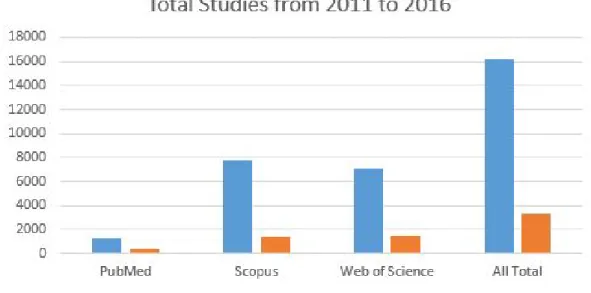
1.5 A Comparison of Total Number of Published Feature Selection Studies for Classification and Regression on PubMed, Scopus, Web of Science from 2011 to 2016. . . 7
2.1 Relevant, Redundant and Irrelevant Features [2].. . . 11
2.2 The Ratio of the Volume of The Hypersphere Enclosed by the Unit Hypercube [3].. . . 12
2.3 The Pseudo Code for InFS Algorithm [4].. . . 29
2.4 A Taxonomy Feature Selection Methods for Regression Problems. 39 3.1 One Dimensional Linear Regression with Epsilon Intensive Band adapted from [5] . . . 44
3.2 Antibody Activities on Mucosal Tissues [6] . . . 48
4.1 Basic K-Means Algorithm for Clustering purpose. . . 65
4.2 The Flowchart of The Proposed KBFS Framework. . . 71
5.1 DFSFR Framework (a) multi-output (b) single-output. h repre-sents hidden neurons. . . 95
5.2 General Representation of DBN. . . 99
5.3 The Flowchart of DKBFS. . . 100
5.4 Selected Number of Features and Their Corresponding PCC Re-sults for the Cytokine Assay . . . 107
5.5 Selected Number of Features and Their Corresponding PCC Re-sults for the ADCC Assay . . . 108
5.6 Selected Number of Features and Their Corresponding PCC Re-sults for ADCP Assay . . . 108
5.7 Distribution of Antibody Features Based on Their Importance . . 108
2.1 The Advantages and Disadvantages of Different Feature Selection
Strategies . . . 14
2.2 A Comparison of Supervised and Unsupervised Feature Selection Methods . . . 28
2.3 A List of Feature Selection Methods for Regression Problems . . . 41
3.1 General Characteristics of the CoEPrA Data sets Used for the Prediction of Peptide Binding Affinity . . . 51
3.2 Amino acid occurrences in Training Data Set for Task 1. . . 52
3.3 Amino acid occurrences in Testing Data Set for Task 1 . . . 52
3.4 Amino acid occurrences in Training Data Set for Task 2. . . 53
3.5 Amino acid occurrences in Testing Data Set for Task 2 . . . 53
3.6 Amino acid occurrences in Training Data Set for Task 3. . . 54
3.7 Amino acid occurrences in Testing Data Set for Task 3 . . . 54
3.8 A description of participants in the lean and obese group . . . 56
3.9 A General Overview of all of the Data Sets Used in this Study . . 58
4.1 Comparison of Unsupervised Feature Selection Methods for the Antibody Features and Natural Killer Cell Cytokine Release Ac-tivity Relationship. . . 75
4.2 Comparison of Unsupervised Feature Selection Methods for the Antibody Features and Cellular Cytotoxic Activity Relationship. . 75
4.3 Comparison of Unsupervised Feature Selection Methods for the Antibody Features and Cellular Phagocytosis Activity Relationship. 76 4.4 A Comparison of the Results with the Previous Study for the Antibody Features and Cellular Phagocytosis Activity Relationship. 76 4.5 A Comparison of the Results with the Previous Study for the Antibody Features and Cellular Cytotoxic Activity Relationship. . 76
4.6 A Comparison of the Results with Previous Study for the Anti-body Features and Natural Killer Cell Cytokine Release Activity Relationship. . . 77
4.7 A comparison of Unsupervised Prediction Results for SVR and MSVR for Anticipating Antibody Feature-Function Relationship. 77 4.8 Regression Results of the Unsupervised Feature Selection Methods for Task 1 . . . 79
4.9 Regression Results of the Unsupervised Feature Selection Methods for Task 2 . . . 80
4.10 Regression Results of the Unsupervised Feature Selection Methods for Task 3 . . . 80
4.11 The Performances of USFSMs for Prediction of Chronological Age 82
4.12 The Performances of USFSMs for the Prediction of BMI . . . 83
4.13 The Performances of USFSMs for MSVR and SVR . . . 83
4.14 A Comparison of USFSMs for The Prediction of Chronological Ages of Individuals using CpG Dinucleotides . . . 85
4.15 Detailed Assessment of CpG Dinucleotides Using the Proposed KBFS framework . . . 86
4.16 List of 41 CpG Dinucleotides. . . 87
5.1 Comparison of Unsupervised Feature Selection Methods for the Antibody Features and Natural Killer Cell Cytokine Release Ac-tivity Relationship. . . 103
5.2 Comparison of Unsupervised Feature Selection Methods for the Antibody Features and Cellular Cytotoxic Activity Relationship. . 103
5.3 Comparison of Unsupervised Feature Selection Methods for the Antibody Features and Cellular Phagocytosis Activity Relationship.103
5.4 A Comparison of the Results with the Previous Study for the Antibody Features and Cellular Phagocytosis Activity Relationship.104
5.5 A Comparison of the Results with the Previous Study for the Antibody Features and Cellular Cytotoxic Activity Relationship. . 104
5.6 A Comparison of the Results with Previous Study for the Anti-body Features and Natural Killer Cell Cytokine Release Activity Relationship. . . 104
5.7 A comparison of Unsupervised Prediction Results for SVR and MSVR for Anticipating Antibody Feature-Function Relationship. 105
5.8 Selected Mutual Features for Unsupervised Learning. . . 106
5.9 The Best Subset of Features for all of the Cell-Mediated Assays. . 107
5.10 Regression Results of the Unsupervised Feature Selection Methods for Task 1 . . . 110
5.11 Regression Results of the Unsupervised Feature Selection Methods for Task 2 . . . 111
5.12 Regression Results of the Unsupervised Feature Selection Methods for Task 3 . . . 111
5.13 Regression Results of DFSFR and the Previous Study for Task 1 . 112
5.14 Regression Results of the Proposed DKBFS Method and the Pre-vious Study for Task 2 . . . 112
5.15 Regression Results of DKBFS and Previous Study for Task 3 . . . 113
5.16 The Performances of USFSMs for Prediction of Chronological Age 115
5.17 The Performances of USFSMs for the Prediction of BMI . . . 115
5.18 The Performances of USFSMs for MSVR and SVR . . . 117
5.19 A Comparison of USFSMs for The Prediction of Chronological Ages of Individuals using CpG Dinucleotides . . . 118
5.20 Detailed Assessment of CpG Dinucleotides Using the Proposed
KBFS framework . . . 120
5.21 A General Overview of all of the Data Sets Used in this Study . . 123
A.1 List of peptides for CoEPrA Task 1 (Training). . . 140
A.2 List of peptides for CoEPrA Task 2 (Training). . . 141
A.3 List of peptides for CoEPrA Task 3 (Training) . . . 142
A.4 List of peptides for CoEPrATask 1 (Testing) . . . 144
A.5 List of peptides for CoEPrA Task 2 (Testing) . . . 145
USFSMs UnSupervised Feature SelectionMethods
SVR Support Vector Regression
MSVR Multi Support Vector Regression
PPI Protein Protein Interagtion
CV Cross Validation
RNA Ribonucleic Acid
DNA Deoxyribonucleic Acid
BMI Body MassIndex
HIV Human Immunodeficiency Virus
CpG Cytosine Phosphate Guanine
MISO Multi InputSingle Output
RBM Restricted Bolzman Machine
1. Ferdi Sarac, Huseyin Seker, and Ahmed Bouridane. Exploration of unsu-pervised feature selection methods to predict chronological age of individ-uals by utilising cpg dinucleotics from whole blood. In 2017 39th Annual International Conference of the IEEE Engineering in Medicine and Biology Society (EMBC). IEEE, 2017.
2. Ferdi Sarac, Volkan Uslan, Huseyin Seker, and Ahmed Bouridane. A su-pervised feature selection framework in relation to prediction of antibody feature-function activity relationships in RV144 vaccines. In Systems Man and Cybernetics (SMC 2016) Conference of the IEEE, 2016.
3. Ferdi Sarac, Volkan Uslan, Huseyin Seker, and Ahmed Bouridane. Ex-ploration of unsupervised feature selection methods in relation to the pre-diction of cytokine release effect correlated to antibody features in rv144 vaccines. In Bioinformatics and Bioengineering (BIBE), 2015 IEEE 15th International Conference on, pages 1-4. IEEE, 2015.
4. Ferdi Sarac, Volkan Uslan, Huseyin Seker, and Ahmed Bouridane. Com-parison of unsupervised feature selection methods for high-dimensional re-gression problems in prediction of peptide binding affinity. In 2015 37th Annual International Conference of the IEEE Engineering in Medicine and Biology Society (EMBC), pages 8173-8176. IEEE, 2015.
5. F. Sarac, V. Uslan, H. Seker, A. Bouridane, Unsupervised selection of RV144 hiv vaccine-induced antibody features correlated to natural killer cell-mediated cytotoxic reactions, in: 2016 38th Annual International Con-ference of the IEEE Engineering in Medicine and Biology Society (EMBC), IEEE, 2016.
6. Ferdi Sarac and Huseyin Seker. An instance selection framework for mining data streams to predict antibody-feature function relationships on rv144 hiv vaccine recipients. In Systems, Man, and Cybernetics (SMC), 2016 IEEE International Conference on, pages 33563361, 2016.
Mass Index by using Epigenetic Information from Peripheral Blood. Inter-national Conference on Cloud and Big Data Computing (ICCBDC 2017) of the ACM.
Introduction
1.1
Motivation
In line with the technological developments, there is almost no foreseeable limit to the collection of data of high dimension in fields, such as bioinformatics, computer vision, machine learning. Therefore, there is a pressing need to be able to deal with high dimensional data. Over the last three decades, the dimensionality of data associated with various scientific fields has dramatically increased. The growth trend in the feature and sample size in UCI Machine Learning Repository from mid 80s to 2012 are shown 1.1(a) and 1.1(b), respectively. [1]. It is clear that there is a need for not only the organisation, distribution and storage of higher volumes of data, but also for identifying and understanding important information from them through the use of machine learning tools to automatically analyse the content of large volumes of data.
One of the aforementioned domains is bioinformatics, where high dimensional biomedical data needs to be processed. There are various types of biomedical data, including peptide binding affinities and epigenetic biomarkers that contain a large number of features. For example, there are over 512 billion peptides for each major histocompatibility complex (MHC) molecule [7]. Biological exper-iments with such large volumes of biomedical data is often impractical, costly and time consuming.
Machine learning methods have become one of the preferred approaches to the analysis of high dimensional biomedical data. However, the handling of high
dimensional data poses many challenges to most existing machine learning al-gorithms. One of the considerable challenges is curse of dimensionality which states that if the number of features increases, the number of data samples re-quired to train learning algorithm exponentially increases to achieve the same level of performance for classification, regression, and clustering tasks.
Another important challenge when dealing with high dimensional data is that such data does not only contain relevant features, but also a significant number of irrelevant and redundant features which usually deteriorate learning performance, increase computational cost, and lead to overfitting. Relevant features are the ones that contain important information which can be used to solve a prediction problem. Redundant features encompass critical information which has been already provided by another feature, and therefore, these features do not provide additional useful information for the predictive model [8]. Irrelevant features are those that have no valuable information; hence, their presence reduce the learning performance of predictive models. Consequently, there is a need to remove redundant and irrelevant features from high dimensional data in order to increase the prediction performance of a model and to reduce computational time.
In order to overcome the aforementioned problems, dimensionality reduction, which is one of the most effective tools to address those challenges, can be used. Dimensionality reduction methods can be divided into two main categories: fea-ture selection and feafea-ture extraction.
Feature extraction reduces the dimensionality of the data and constructs new input data with no physical meaning, and these methods include Locally Linear Embedding (LLE) [9], Neighbourhood Preserving Embedding (NPE) [10], and kernel PCA [11]. On the other hand, feature selection builds a subset of relevant attributes without changing the original semantics of the data. Preserving the original semantics of data is vital, especially in biomedical domain. In addition, feature selection reduces execution time and improves the accuracy of prediction which are preferred in many real-world applications [12].
It is profoundly beneficial to remove irrelevant and redundant features prior to learning, particularly if the number of attributes are significantly greater than the number of samples, as is the usual case in biomedical data. Moreover, feature selection methods generate a subset of relevant features in biomedical data so
Figure 1.1: Growth trend in UCI Machine Learning Repository [1].
that those features can be further analysed in biology laboratories to discover new insights in the field.
Another important challenge of dealing with high dimensional data is that label (output) information is generally not available, owing to the high cost of manual labelling [13]. Therefore, unsupervised feature methods are needed to deal with unlabelled high dimensional data.
In line with the technological developments, data has been generated; however, floating point data is much more in agenda. For example, a decade ago, the prob-lem of peptide binding was to predict whether peptide binds or not. However, current technological developments have lead researchers to predict bindings of peptides quantitatively. Consequently, this study focuses on unsupervised feature selection particularly for regression problems.
1.2
Aims and Objectives of This Thesis
The thesis focuses primarily on feature selection problems with extremely high dimensional data in regression domain.
• Developing an unsupervised feature selection method that is capable of dealing with high dimensionality of data, identifying discriminative features and removing redundant, noisy and irrelevant ones.
• Achieving better prediction and generalisation performance than the exist-ing methods.
In order to achieve the project aim ther following objectives have been set:
• There have been various attempts to select predictive feature sets from high dimensional data sets in classification and clustering; however, only limited attempts have been made to do this for regression problems. Therefore, one of the goals of this study is to develop a feature selection method designed particularly for regression problems in order to fill this gap in the literature.
• Deep learning has been shown to be capable of representing data at multiple levels of abstraction. It is able to derive discriminative features, resulting in enhanced accuracy. Although various feature selection methods have been proposed in the current literature, no deep learning based feature selection method exists specifically for regression tasks.
• Most real world data is unlabelled; therefore, unsupervised feature selec-tion methods are needed since supervised methods can not be applied to unlabelled data. Furthermore, supervised methods tend to identify noisy features as well as relevant ones, yet unsupervised methods do not intend to select features that can act as noise. Therefore, supervised feature selec-tion can be considered as a biased approach whereas unsupervised feature selection can be regarded as unbiased [14].
• Researchers have mainly paid attention to single-output regression analysis so far [15]. However, multi-output regression is crucial, especially in the analysis of biomedical data.
• Although plenty of reviews of feature selection methods can be found in the literature for classification and clustering, no review of feature selection methods specifically for regression tasks has yet been published.
As mentioned above, researchers have paid more attention to feature selection for classification rather than for regression. In order to justify that a literature
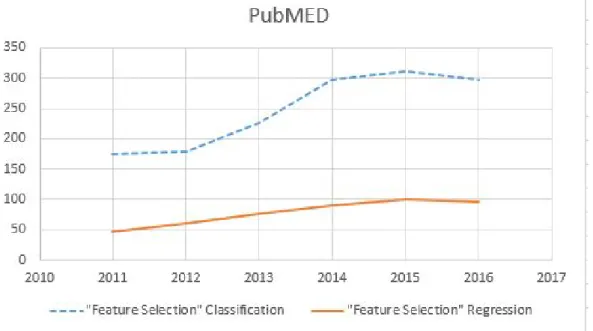
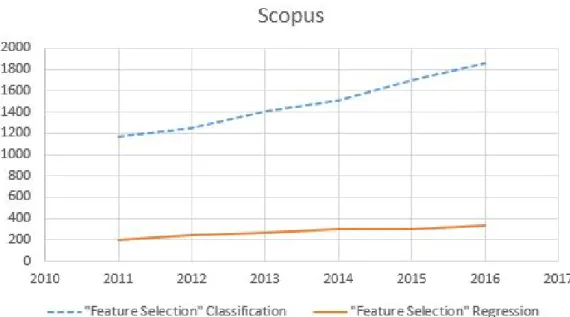
search using the keywords “feature selection classification” and “feature selection regression” has been conducted of publications listed at PubMED, Scopus and Web of Science (It is worth noting that searching with different keywords, such as feature selection and classification or feature selection for classification have produced almost the same results, therefore, the number of studies found using different versions of keywords are consistent). The numbers of publications per year for the feature selection for regression and feature selection for classification between 2011 and 2016 are shown in Figs. 1.2-1.5. As shown in Fig. 1.2, feature selection for classification studies are more than three times those for regression according to PubMed. Fig. 1.3 shows that feature selection for classification studies are approximately 6 times the number of studies for feature selection for regression studies according to Scopus. Fig. 1.4 illustrates a comparison of published feature selection studies for classification and regression on Web of Science, which suggests that there are approximately five times as many feature selection for classification studies than feature selection for regression studies. As shown in Fig. 1.5, the literature search indicates that there have been feature selection for classification studies approximately five times as many studies as feature selection for regression studies from 2011 to 2016. Thus, it is concluded that feature selection for regression is understudied.
Figure 1.2: A Comparison of Published Feature Selection Studies for Clas-sification and Regression on PubMed.
Figure 1.3: A Comparison of Published Feature Selection Studies for
Clas-sification and Regression on Scopus.
Figure 1.4: A Comparison of Published Feature Selection Studies for
Figure 1.5: A Comparison of Total Number of Published Feature Selection
Studies for Classification and Regression on PubMed, Scopus, Web of Science from 2011 to 2016.
In this thesis, therefore, a novel deep learning based unsupervised feature selec-tion framework, a K-means based unsupervised framework, and a hybrid method for regression problems are provided to overcome the aforementioned problems and to fill the research gap in the literature. In addition, the proposed deep learn-ing based unsupervised framework is capable of handllearn-ing both multi input-slearn-ingle output (MISO) and multi input-multi output (MIMO) prediction.
By proposing these frameworks, the intention is not only to obtain better gen-eralisation and performance than with existing unsupervised feature selection methods, but also to be able to identify a small subset of relevant features from biomedical data which can be further analysed in real biology labs. The ulti-mate goal is to be able to identify biologically relevant features from biomedical data, such as the identification of age-related biomarkers from the whole blood of individuals in order to contribute to society.
1.3
Contributions of the Thesis
In accordance with the objectives of this study, the contributions of this thesis are as follows:
• A comprehensive review of existing feature selection methods, which can be used for regression tasks, is provided.
• A taxonomy of existing feature selection methods for regression tasks is offered.
• Feature selection methods are developed that can be applicable to unla-belled data.
• A K-means based unsupervised feature selection framework for high di-mensional data is proposed particularly for the regression domain, which achieves better performance (in terms of higher accuracy with fewer fea-tures) than existing feature selection methods. (Published work ([16]) and another work is under review [17]).
• A deep learning based unsupervised feature selection method is designed that can be applied specifically for regression tasks.
• Multi input-multi output regression analysis is applied so that associations among target variables can be revealed. (This work is under review [18] [17]).
• A hybrid unsupervised feature selection method is proposed which com-bines the proposed K-means and deep learning based frameworks.
1.4
Thesis Overview
The thesis is organised as follows:
Chapter 1 introduces the problems of dealing with high dimensional data, indi-cates the importance of feature selection, and establishes the goals of this thesis. The main contributions of this study are also summarised in this chapter. Chapter 2 discusses the challenges of dealing with high dimensional data, such as the curse of dimensionality and overfitting. Feature selection and feature extraction are defined and their advantages and disadvantages are presented. A comprehensive review of existing feature selection algorithms for regression tasks is conducted, and a taxonomy of existing unsupervised feature selection methods particularly for regression problems is provided.
Chapter 3 describes the regression models, which are exploited in this study to perform both single input-multi output and multi input-multi output regression. The evaluation metrics that are used to analyse and compare the effectiveness of unsupervised feature selection methods are presented, and the RV144 vaccine, peptide binding affinity, GSE44763 and GSE40279 data sets that are exploited in this research to evaluate the performance of proposed frameworks are described. Chapter 4 describes the K-means algorithm, presents its basic properties and the shortcomings of existing K-means based feature selection methods. The pro-posed K-means based unsupervised feature selection framework, which is called as KBFS is then introduced. Finally, the results of the application of the proposed method compared to state-of-the-art unsupervised feature selection techniques over the RV144 vaccine, peptide binding affinities, GSE44763 and GSE40279 data sets are presented.
Chapter 5 identifies research gaps in the literature and describes deep belief network (DBN) which is a type of deep neural network used in this research. The proposed deep learning based unsupervised feature selection framework for regression tasks is presented which is called DFSFR. A new hybrid model, which combines the proposed KBFS and DFSFR methods, is also proposed in this chapter. The proposed hybrid method is named DKBFS. Finally, experimental results are presented to show effectiveness of proposed methods.
Chapter 6 presents discussions of the performance of feature selection meth-ods which are reviewed in detail. The robustness of unsupervised feature selec-tion methods for the RV144 vaccine, peptide binding affinity, GSE44763, and GSE40279 data sets is shown, and a general discussion and interpretation of the research findings of this study is provided.
Review on Feature Selection
Methods
This chapter is devoted to reviewing existing feature selection methods. The challenges of dealing with high dimensional data is reviewed first, then dimen-sionality reduction, feature selection and feature extraction will be described. In the following section, existing feature selection methods for regression problems will be presented as well as a taxonomy of feature selection methods for regres-sion problems. Finally, a list of those methods along with their types, sources and code availability will be presented. This taxonomy is provided to assist researchers to select the appropriate feature selection method for their research.
2.1
Challenges of Dealing With High
Dimen-sional Data
High dimensional data has become very common in various domains, such as social media, biostatistics, bioinformatics, computational biology, etc. High di-mensional data poses many challenges to most of the existing machine learning and data mining algorithms. One of the considerable challenge is the curse of dimensionality which is presented in following section. In addition, high dimen-sional data requires large storage and high computational cost for data analytics. Real world data usually contains irrelevant and redundant features which are generally not beneficial to discriminate samples from different classes or clusters
Figure 2.1: Relevant, Redundant and Irrelevant Features [2].
[2]. In fact, those features generally deteriorate learning performance and increase the computational cost. Hence, removing those features is usually beneficial for the learning model. In Fig. 2.1 [2], relevant, irrelevant and redundant features are demonstrated. In Fig. 2.1(a), a relevant feature,f1, is shown. Notice that f1 is a relevant feature as it discriminates two clusters. As shown in Fig. 2.1(b), if f1 and f2 are considered together, f2 is redundant because f2 is highly correlated to f1. In Fig. 2.1(c), f3 is an irrelevant feature since it is not able to separate two clusters. Consequently, learning performance will not be affected if f2 and f3 are removed.
Another important challenge of dealing with high dimensional data is overfitting. If a data set contains a huge number of features and relatively small number of samples, learning model is prone to overfitting which might negatively affect learning performance of the model [2].
2.2
Curse of Dimensionality
The curse of dimensionality is first introduced by Bellman [19] in order to specify that if the number of features increases, the amount of data to be generalised
Figure 2.2: The Ratio of the Volume of The Hypersphere Enclosed by the
Unit Hypercube [3].
is increases exponentially to achieve the same level of performance for classifi-cation, regression, and clustering [1]. In other words, exponential increase in volume results in adding extra dimensions to Euclidean space [3]. Thanks to this exponential growth, the volume of space increases which causes high sparsity in data. On the other hand, this sparseness is not uniformly distributed over the search space. In order to show that the size of unit hypersphere can be com-pared with the size of unit cube as shown in Fig. 2.2 [3]. As the dimensionality increases, the volume of hypersphere gets closer to zero whereas the volume of surrounding hypercube remains constant; furthermore, nearly entire high dimen-sional space is quite far away from the centre. Consequently, if the dimendimen-sionality goes to infinity, the ratio of difference between maximum (dmax) and minimum
(dmin) euclidean distance from sample to centroid and the minimum distance
(dmin) goes to zero:
limd→∞
dmax−dmin
dmin
→0 (2.1)
Therefore, the data become more sparse as dimensionality increases. In order to overcome aforementioned problems, dimensionality reduction methods, such as
feature selection or feature extraction can be used. Next section presents feature selection and feature extraction.
2.3
Feature Selection and Feature Extraction
Feature selection and feature extraction are both effective dimensionality reduc-tion techniques and they are able to improve performance, reduce the computa-tional complexity and the cost, and decrease the requirements for the storage of the data [20]. In contrast to feature extraction, feature selection techniques do not change the original semantics of the variables, actually, it eliminates redun-dant or irrelevant features to identify meaningful smaller subset of the variables [21]. Furthermore, feature extraction generates a sequence of new features with-out knowing their physical meanings [2]. This is quite dangerous and it may cause calamitous results if it is utilised on biomedical data since preserving in-trinsic information of biomedical data is extremely important. On the other hand, feature selection identifies a subset of relevant attributes by preserving ac-tual meanings of original features. Therefore, feature selection does not change original semantics of the attributes, indeed, it increases feature readability and interpretability [22].
Feature selection methods are generally designed for three different strategies: filter [23] [24] [25], wrapper [26] [27] [28] [29] and embedded selection [30]. Filter subset selection is performed independent from the prediction algorithm. Filter methods are computationally fast; however, they do not take learning algorithms into account which generally results in lower prediction performance [31]. Unlike filters, wrapper methods require a pre-determined learning algorithm and utilise the dependency between features and prediction algorithm to select a subset of features. Consequently, the prediction performance of wrappers is better than filters, however, they are costly to compute and inefficient for dealing with high dimensional data [32] [33]. Embedded methods exploit the advantages of filter and wrapper methods, thereby, they learn the prediction algorithm and select features, simultaneously. Embedded methods are still dependent to induction algorithms, yet they are more computationally efficient than wrappers.
Feature evaluation process of filter based methods can be univariate and multi-variate. Univariate filters rank features independently according to their impor-tance whereas multivariate filters evaluate each feature with respect to the other features [34] [35]. Therefore, multivariate feature selection methods are able to handle feature redundancy [36]. Three different feature selection strategies, which are filter, wrapper and embedded, are summarised in Table 2.1.
Method Advantages Disadvantages
• Fast, Scalable, Inde-pendent from learn-ing algorithm, The lowest computational cost, Good generalisa-tion ability
• Simple, Interacts with learning al-gorithm, Captures feature dependen-cies Good prediction performance
• Interaction with in-duction algorithm, Capture feature de-pendencies, Lower computational cost than wrappers • No interaction with prediction algorithm • Computationally expensive, Dependent to learning algorithm, Risk of overfitting • Feature Selection is dependent on learning algorithm
Table 2.1: The Advantages and Disadvantages of Different Feature Selection
Strategies
Based on the availability of information and problem definition in prediction, feature selection methods can be divided into two main categories: unsupervised and supervised feature selection. In the supervised feature selection scenario, fea-tures are selected according to their correlation with outputs (e.g., class labels). In case of unsupervised feature selection, only data inputs are used to select rel-evant features where the output information (e.g., class label) is not available or taken into account. As output information is not used for the feature selection,
carrying out the unsupervised feature selection is more challenging. Further-more, supervised feature selection methods tend to identify relevant features as well as noisy ones whereas unsupervised feature selection methods do not tend to identify features that can act as noise [16].
In the following sections, existing feature selection methods for regression prob-lems will be presented. A taxonomy of the existing methods is also presented to assist researchers to select an appropriate feature selection method for their research. To the best of our knowledge, this is the first study that provides a comprehensive review of feature selection methods particularly for regression problems.
2.4
Supervised Feature Selection
In this section supervised feature selection methods for regression problems are presented. Although there have been various attempts to select predictive feature sets from high-dimensional data sets in classification and clustering, there is a limited attempt to study it in regression problems as demonstrated in Figs 1.2-1.5 where the number of studies in PubMed, Scopus and Web of Science on the feature selection in regression domains are found to be significantly different than those in classification ones. Therefore, feature selection methods for regression problems are presented in this section, yet most of these methods have not been used for regression problems.
2.4.1
Filter Methods
In this subsection supervised filter feature selection methods are presented.
2.4.1.1 Correlation Based Feature Selection (CFS)
Correlation based feature selection (CFS) [25] is a filter feature selection algo-rithm that aims to minimise internal correlation of selected variables and max-imise the dependence between the selected variables and target. Briefly, it uses a correlation based heuristic to rank the features. The CFS does not only eval-uate feature-feature correlations, but also measures input-output correlations.
If a feature is highly correlated to another feature, it is considered irrelevant. However, if a feature is strongly correlated with the target, it is determined as relevant [24]. The CFS estimates correlation between features and the target,
rxy, by solving the following formula:
rxy =
P
xy nσxσy
(2.2) where X and Y are the features and the target variable respectively, σx is the
standard deviation of the x,σy is standard deviation of the y, andnrepresents the
number of samples. CFS ranks feature subsets rather than scoring each feature individually; therefore, CFS is a multivariate feature selection method.
CFS has been applied only in data sets with low dimension for regression tasks and it is observed that their performances varied from one data set to another and they generally produced average performance in various domains [25] [37].
2.4.1.2 Minimum Redundancy Maximum Relevance (mRmR)
Minimum redundancy maximum relevance (mRmR) [38] is a filter-based and supervised feature selection algorithm that selects features which are mutually far away from each other, yet they are highly correlated to the target variable. The idea of minimum redundancy is to select features that are considerable dissimilar. The idea of maximum relevance is to maximise the total relevance of all features. The minimum redundancy can be calculated as:
W = 1
|S|2
X
i,j
c(i, j) (2.3)
and the maximum relevance can be found by solving the following formula:
VF = 1 |S| X iS F(i, h) (2.4) where S is the set of features, |S| is the number of features in S, c(i;j) is the correlation between featuresiandj,his the target, andF(i, h) is theF-statistic. mRmR method is one of the few feature selection methods that can be applied in both classification and regression tasks. The literature appears to suggest
that it usually yields reasonably better performance on high dimensional data sets where the number of features are dramatically greater than the number of samples [39] [40].
2.4.1.3 Canonical Correlation Analysis (CCA)
Canonical Correlation Analysis (CCA) [41] describes the relationship between two multivariate sets of variables. The CCA constructs a subset of features according to the correlation between input and output variables. In order to calculate the correlation between Ui and Vj, the covariance between these two
variables,cov(Ui, Vj), is divided by the square root of the product of the variances:
Correlation= p(cov(Ui, Vj))
var(Ui, Vj)
(2.5)
The canonical correlation is a particular type of this correlation. Thus, i-th canonical variate pair is the correlation between Ui ,Vi and it can be calculated
from the following formula:
p∗i = p(cov(Ui, Vj))
var(Ui, Vj)
(2.6)
where Uis are a set of linear combinations for X, and Vjs are a set of linear
combinations for Y, cov is co-variance, p is correlation and var represents the variance.
2.4.1.4 Maximum Likelihood Feature Selection (MLFS)
Maximum Likelihood Feature Selection (MLFS) [42] is a filter, multivariate and supervised feature selection method that prioritises variables based on input-target dependency measure. It utilises Maximum Likelihood Mutual Information (MLMI) [43] in order to measure the dependency between predictors and the target. MLMI is an estimator of mutual information which depends on density estimation. MLMI directly models the density ratio, w(x, y) by [42]:
w(x, y) = Pxy(x, y)
Px(x)Py(y)
where Pxy(x, y), is the joint density of X and Y, Px(y), Py(x) are densities of X
and Y respectively. MLFS can be exploited for both classification and regression problems.
2.4.1.5 Least Squares Feature Selection (LSFS)
Least Squares Feature Selection (LSFS) [44] is quite similar to the MLFS method. Unlike MLFS, the LSFS evaluates the dependency between features and the target via squared loss mutual information (LSMI) [45]. LSMI directly estimates the density ratio,r(x, y), by:
r(x, y) = P(x, y)
P(x)P(y) (2.8) where xi and yi, (i= 1,2, . . . , n) are given a set of paired samples (xi, yi) which
are drawn independently from the joint distribution with a density ofp(x, y). MLFS is a supervised, multivariate filter, and information-based feature selection method that can be utilised for both classification and regression tasks.
2.4.1.6 Distance Measure Based Conditional Mutual Information (CM IDIST)
Distance Measure Based Conditional Mutual Information (CM IDIST) [15] is a
supervised and filter feature selection method that can be used to perform both single and multi-output regression tasks. It applies information based techniques to determine the importance of the features. Conditional Mutual Information is exploited in order to find the clusters in a data set. The CM IDIST selects a
feature that produces the highest mutual information with respect to the target variable.
CM IDIST has been shown to produce good performance for small dimensional
data sets, particularly if the number of samples are greater than number of features [15].
2.4.1.7 Selection via Intersection Method (SEVIM)
Selection via Intersection Method (SEVIM) [46] is a supervised and filter feature selection method. In SEVIM, features are selected based on the intersection of MaximumR2,F score andp-values of the variables. In deed, incremental maxi-mumR2 technique is exploited, and in order to rank features the intersection of
maximumR2,F score andpvalues of the features are considered. The maximum
R2 can be formulated as [46]: a =logL(M)logL(0) (2.9) b = logL(0) n (2.10) Q= 1−e2na (2.11) R2 = Q 1−e2b (2.12)
where n is the number of features,logL(M) is the maximised logarithmic likeli-hood andlogL(0) refers to the logarithmic likelihood of null model which contains only intercept term.
While finding a subset of features with highest R2 is in progress, the F score
of the subsets and their related p values are also calculated. Briefly, let X = (x1, x2, . . . , xn) denotes a data matrix where xi ∈Rd is the feature descriptor of
the i−th sample. SEVIM selects a feature, xi, if xi ∈F ∩P ∩R.
SEVIM has been shown to produce good results for data sets where the number of features are greater than number of samples SEVIM.
2.4.2
Wrappers
The goal of the wrapper feature selection is to achieve maximum accuracy with the minimum number of discriminative features. Wrapper methods embeds the model hypothesis search within feature subset search. The wrapper approaches
of feature selection attempt to identify the minimum discriminative features in order to achieve a high prediction accuracy [47]. Since wrappers interact with the learning algorithm, their prediction performance is better than filters [48]. On the other hand, wrappers are computationally very expensive, and thereby they are under the risk of overfitting.
2.4.2.1 Sequential Forward Selection (SFS)
Sequential Forward Selection (SFS) is a supervised and wrapper feature selection method that starts from an empty set and gradually adds features one at a time until no further improvement of evaluation function value is possible [49]. When an attribute is added to the current set, the SFS puts the attribute to the learning structure that generalises the best. Once an attribute is added to the learning structure, the SFS cannot remove it. The aim of the evaluation function is to minimise the mean square error for prediction. A common pitfall of the SFS is that it may not contain inter-dependent attributes because it adds variables one at a time [50]. The SFS is more applicable to small data sets [51]. The pseudo code for the SFS algorithm is presented in Algorithm 4.
Algorithm 1 Sequential Forward Selection Algorithm
1: procedure
2: Start with the empty set Y0 = ø;
3: Select the next best feature x+ =arg
x /∈YkmaxJ(Yk+x) 4: Update Yk+1 =Yk+x+; k =k+ 1
5: go to 2
SFS method has generally been applied to low dimensional data sets for regression tasks and it produced good results [50]. As mentioned earlier, SFS is more applicable to small data sets. SFS is a widely utilised feature selection algorithm thanks to its simplicity and speed [52].
2.4.2.2 Sequential Backward Selection (SBS)
Sequential Backward Selection (SBS) and SFS can be considered as antipodes. In contrast to SFS, the SBS is initialised with entire set of attributes, and it
updates the feature set by removing the feature which least reduces the value of the objective function. The pseudo code for SBS is presented in Algorithm 5.
Algorithm 2 Sequential Backward Selection Algorithm
1: procedure
2: Start with the entire set Y0 =X;
3: Remove the worst feature x−=argx∈YkmaxJ(Yk−x) 4: Update Yk+1 =Yk−x−; k =k+ 1
5: go to 2
Since SBS starts with the whole set of features, thereby, its early evaluations are comparatively expensive [53]. The primary disadvantage of SBS is that once a feature is removed, it will never be re-evaluated [54]. The SBS spends most of its time for visiting a large subset; therefore, SBS can be exploited when the optimal feature subset contains a large number of attributes.
In [50], SBS was applied to a number of different data sets, but generally with low dimension and it generally produced better results than SFS. However, the number of features were at most 14 on those data sets.
2.4.2.3 Sequential Floating Selection (SFLS)
The SFS and SBS work on one direction either adding or removing an attribute at a time. Sequential Floating Selection (SFLS) works on both directions either adding or removing variables or eliminating added variables, and thereby the SFLS enhances the reliability of the final feature subset. There are two differ-ent types of SFLS methods: Sequdiffer-ential Floating Forward Selection (SFFS) and Sequential Floating Backward Selection (SFBS). The SFFS is initiated with the empty set as the SFS does; however, after each forward step, the SFFS per-forms backward steps until the objective function increases. On the other hand, the SFBS is initialised by the full set and after each backward step, the SFBS caries out forward steps as long as the objective function increases. The F is a statistical parameter which can be used to judge whether the models including different feature subsets are sequentially generated or not. TheF parameter can
be calculated from the following formula [55]: F = M SM M SE = P i(ybi−yi) 2 q−1 (P iybi−yi) 2 n−q (2.13)
where i is the number of samples, y is the target, y is the mean of the target, by
is the predicted target, n is the number of features, q is the number of selected features, and M SM and M SE are mean of squares for model and mean of squares for error, respectively.
2.4.2.4 Bi-Directional Search
The goal of the Bi-directional Search algorithm is to ensure that the SFS and SBS converge toward the same solution. Therefore, features selected by the SFS should not be removed by the SBS, and the features removed by SBS should not be added by SFS. The pseudo code for BDS is illustrated in Algorithm 6.
Algorithm 3 Bi-Directional Search Selection Algorithm
1: procedure
2: Start SFS with the empty set YF = ø;
3: Start with the entire set YB =X;
4: Select the best feature 5: x+ = argmin
x /∈YFk,x∈YBk
[J(YFk +x) 6: YFk+1 =YFk+x
+
7: Remove the worst feature
8: x− = argmax x /∈YFk+1,x∈YBk [J(YBk−x) 9: YBk+1 =YBk−x −; k =k+ 1 10: go to 2
2.4.2.5 Feature Selection by Computing Statistical Scores (FeaLect)
FeaLect [56] is a feature selection method that statistically sorts features to pri-oritise them. It generates a number of samples from training data, and then determines the best relevance ordering of the features for each sample. At the end, it combines those to select maximally relevant features. Basically, FeaLect
selects a random subset B. Then selects k-features, in which by applying Least Absolute Shrinkage and Selection Operator (LASSO) method. If a feature be-longs to subset B, then the value of the feature is 1/k otherwise the value of the feature is zero. This process is repeated 100 times and average values of features are calculated. LASSO, which is presented in the next subsection, can select relevant features as well as irrelevant ones, especially if the number of train-ing instances goes to infinity [56]. The FeaLect is a wrapper feature selection algorithm that overcomes this problem by statistically scoring each feature to accomplish a robust feature selection [57].
2.4.3
Embedded Methods
In this subsection embedded supervised feature selection methods are presented. The objective function of embedded methods is to optimise the performance of a learning algorithm.
2.4.3.1 Least Absolute Shrinkage and Selection Operator (LASSO)
Least Absolute Shrinkage and Selection Operator (LASSO) [58] is a regression analysis method which changes coefficient estimation and makes some of them zero in order to perform feature selection. LASSO exploits l1 norm
regularisa-tion for least square linear regression, and it attempts to minimise the following objective function:
LASSO =argmin
β
ky−βXk2
2+λkβk1 (2.14)
where the response random variable Y ∈ R is dependent on a d-dimensional covariate X ∈ Rd and the training data D = (x
i, yi) n
1 is independently and
identically sampled from a fixed joint distributionPXY, andλis a regularisation
parameter. The l1 norm regularisation shrinks most of the coefficients toward
zero; in other words, it performs feature selection [59]. The l1 norm can be
defined as the sum of the absolute values of components of the vector which can be calculated from:
kβk1 =
n
X
i=1
|βi| (2.15)
The LASSO method is commonly used for genomics [60] [61].
LASSO is an embedded and supervised feature selection method. Even though LASSO is extremely useful for small n (n is number of samples), and large p (p is number of features) problems, it can select at most n features [60].
2.4.3.2 High-Dimensional Feature Selection by Feature-Wise Kernel-ized Lasso (HSIC LASSO)
The LASSO assumes that a linear correlation between features and the target exists. High-Dimensional Feature Selection by Feature-Wise Kernelized Lasso (HSIC LASSO) [62] can be considered as a non-linear form of LASSO. The HSIC LASSO attempts to solve the following optimisation problem [63]:
HSICLASSO =min α∈Rd 1 2kL− d X k=1 αkK (k) k2F rob+λkαk1 subject to α1, α2, . . . , αd≥0 (2.16)
where d represents the number of features,k.kF rob is the Frobenius norm,K
(k)
= ΓKΓ, L = ΓLΓ are centred Gram matrices, Ki,jk = K(xk,i, xk,j) and Li,j =
L(yi, yj) are Gram matrices, K(x, x0) and L(y, y0) are kernel functions, Γ =
In− n11n1nT is the centring matrix, In is the n-dimensional identity matrix, λ is
a regularisation parameter, α is regression coefficient vector, and 1n is the n
-dimensional vector with all ones. HSIC LASSO is a sparse based, embedded and supervised feature selection method. It is utilised to select features from high dimensional data sets to perform non-linear regression tasks.
In [64], LASSO is compared with 8 different feature selection method including LSMI and mRmR. It achieved the second-best performance over 23 low dimen-sional data sets (the highest number of features for a data set were 617). This results appears to suggest that LASSO works well on low dimensional data.
2.4.3.3 Least Angle Regression for Feature Selection (LARS)
Least Angle Regression for Feature Selection (LARS) [61] is similar to LASSO and it can be considered as a stepwise variant of LASSO. The LARS selects a predictor, xi, from a data set which has the largest absolute correlation with
the target (y), and then it performs simple linear regression of y on xi. Other
predictors which are orthogonal to the xi are selected, and then a linear model
is constructed by exploiting the selected predictors. The LARS performs linear regression with l1 norm regularisation; therefore, most of the coefficients are
shrunk toward zero, and thereby feature selection is accomplished.
The initial coefficients are zero (β = 0). The LARS increases these coefficients so that their features have the highest correlation with the output variable in each iteration till all coefficients become non-zero.
2.4.3.4 GUIDE
GUIDE [65] is a regression tree algorithm which aims to provide an unbiased fea-ture selection using the Chi-Squared test. The GUIDE starts with the selection of the most important feature by exploiting the Chi-Square statistic. If none of the feature is considered significant; then, linear combinations of two features are determined and the most significant feature is decided by using Bonferroni [66] corrections. If the most significant variable is still not found, then interaction tests between pairs of features with Bonferronni corrections are performed. If the most important feature is still not found, then the feature with lowestp-value is selected at the beginning stage (Chi-Square test). Then, the split points on the most important feature, which decreases miss-prediction error, are found. Split-ting continues until pre-defined number of observations exceed cases of a node [67]. GUIDE is a statistical based, embedded, and supervised feature selection algorithm which can be exploited for both classification and regression tasks.
2.4.3.5 Minimum Redundancy Spectral Feature Selection (MRSF)
SPEC (which is presented in section 2.3.1.4) ignores feature relevance, therefore, it cannot handle feature redundancy. MRSF [68] can be considered as an exten-sion of SPEC where features are jointly evaluated to identify feature relevance.
The MRSF is a sparse learning based, embedded, and supervised feature selec-tion method that evaluates a set features jointly and eliminates redundant ones. The MRSF attempts to solve the following optimisation problem:
argm
WinkW
0
X−Yk2
2+λkW||2,1 (2.17)
whereW ∈Rd∗qis a projection matrix,is a predefined parameter, andY ∈Rn∗q
is embedding of the input data (by eigen decomposition) X ∈Rd∗n.
In [68], MRFS produced better results than HSIC and mRmR over six different data sets for classification tasks. These benchmarks have at most 11340 features. The performance of MRFS for regression tasks needs to be investigated.
2.4.3.6 Elastic Net (EN)
The LASSO penalises l1 norm regularisation to shrink many coefficients to
ex-actly ’0’; therefore, LASSO can be utilised for feature selection. However, LASSO tends to select only one of the highly correlated features, which may not always be the best choice [69]. In order to select features with high correlations, Zhu and Hastie proposed Elastic Net (EN) [70] which uses both l1 and l2 norm
regu-larisation given by:
penalty(w) = n X i=1 |wi|γ+ ( n X i=1 wi2)λ (2.18)
where 0 ≤ γ ≤ 1 and λ ≥ 1 are individual tuning parameters. The EN is a sparsity-based feature selection method that performs feature selection and regression, simultaneously.
In [15], EN and CM IDIST methods are compared. EN produced better results
than CM IDIST if the number of features are less than 50. This result suggests
2.4.4
Remarks on the Use of Supervised Feature
Selec-tion
In this chapter, existing feature selection methods for regression problems are reviewed. In this section, unsupervised and supervised feature selection methods are compared and their advantages and disadvantages are presented. In Table 2.2, supervised and unsupervised feature selection methods are compared, in addition, their advantages and disadvantages are listed along with their references.
2.5
Unsupervised Feature Selection Methods
In previous section supervised feature selection methods for regression problems are presented. In this section, unsupervised feature selection methods for regres-sion problems are presented.
2.5.1
Filter Methods
This subsection presents unsupervised filter feature selection methods for regres-sion tasks.
2.5.1.1 Term Variance (TV)
Term Variance (TV) [82] is an unsupervised and univariate filter feature selection method that ranks features according to their variance. TV can be formulated as: T Vi =var(xi) = 1 n n X j=1 (xij −xi) (2.19)
where xi is sample mean of xi. Even though TV is a simple method, it is
computationally faster. Therefore, it can be applied to very high dimensional data.
Table 2.2: A Comparison of Supervised and Unsupervised Feature Selection
Methods
Feature Selection
Supervised Unsupervised Ref
The output weights are trained by solving a regularised least squares problem
The output weights are obtained by solving a generalised eigen value problem
[71]
A relevance of a feature is mea-sured according to its correlation with label information
The relevance of a feature is mea-sured according to its ability in preserving some data characteris-tics (e.g. variance)
[72]
Background knowledge of data is available
Background knowledge of data is not available
[72] Traces for learning activities and
strategies
Can be applied on any data set comprising traces of activities
[73] Complexity is low, requires one
it-eration
Complexity is high requires sev-eral iterations
[73] Requires human (expert)
inter-vention to obtain labels
Does not require human (expert) intervention to obtain true labels
[13] Limited data available Adequate data available [74] Impractical Practical [74] Not easily applicable for crowd
sourcing
Easily applicable for crowd sourc-ing
[74] Present labels Abcent labels [75] [76] Applicable for classification
usu-ally
Applicable for classification, re-gression and clustering
[77] Effective for selecting
discrimina-tive features
Effective for clustering features [78] Higher accuracy Less accuracy [79] More reliable performance Less reliable performance [79] Ignore correlation between
differ-ent features
Ignore correlation between fea-tures and labels
[80] Less challenging when applied to
high dimensional data
More challenging when applied to high dimensional data
[81] Time consuming and costly Computational time greatly
re-duced
[77] Difficult to apply for text
classifi-cation, fault diagnosis, and infor-mation retrieval
Easily applicable for information retrieval, fault diagnosis, and text classification
2.5.1.2 Infinite Feature Selection (InFS)
Infinite Feature Selection (InFS) [4] is a filter and unsupervised feature selection method. In InFS, each feature is represented with a node in a graph and features are selected according to their centrality score. All possible subsets of features are considered as paths on a graph and each feature is ranked. The pseudo code for infinite feature selection method is illustrated in Fig. 2.3.
Figure 2.3: The Pseudo Code for InFS Algorithm [4].
2.5.1.3 Laplacian Score Feature Selection (LapFS)
Laplacian Score Feature Selection (LapFS) [83] is a graph based, unsupervised and univariate filter feature selection algorithm that ranks features according to their locality preserving power. In Laplacian Score, features are evaluated independently; therefore, the LapFS algorithm cannot handle feature redundancy [84]. LapFS utilises pairwise similarities between features which are calculated using the heat kernel. Laplacian score of a feature, fi, can be calculated from
the following formula:
Lap(fi) = e f0 iLf 0 i e fi0Dfi0 (2.20) wherefi =fi− fi0D1 10D11, 1 = [1,1, ...,1]
0, D is degree or diagonal matrix defined as
D(i, i) =Pn
j=1S(i, j), S is affinity matrix S(i, j) =
e−kxi−xjk2
t and the Laplacian
is computationally expensive, especially, if the number of features are extremely large.
2.5.1.4 Spectral Regression Feature Selection (SPEC)
Spectral Regression Feature Selection (SPEC) [85] can be considered as an exten-sion of LapFS. LapFS is an unsupervised feature selection method which exploits data variance and separability to assess feature relevance [86]. The goal of the SPEC is to investigate some intrinsic properties of both supervised and unsu-pervised feature selection and to develop a unified framework which is built on spectral graph theory. Likewise LapFS, SPEC cannot handle feature redundancy because it evaluates each feature independently. Therefore, in SPEC, the cor-relation between features is not taken into account. SPEC exploits the Radial Basis Function (RBF) in order to calculate the similarity,sij, between two points
xi and xj by:
Sij =e−
kxi−xjk2
2σ2 (2.21)
where the graph G is constructed from S, and the projection matrix (W) is constructed from graph G, and the degree matrix (D) is a diagonal matrix that can be calculated fromDii=Pni=1Wij. Given W, and D, the Laplacian Matrix
(L) can be expressed as:
L=D−W; L=D−1/2LD−1/2 (2.22)
As far as the feature selection for classification problems is concerned, SPFS has been shown to be an average method compared to others [87]. On the other hand, SPEC has shown its effectiveness for regression tasks in several studies [88] [89].
2.5.1.5 Trace Ratio Criterion for Feature Selection
Trace ratio feature selection [90] individually ranks features according to their scores which are computed in trace ratio norm. Two affinity matrices are defined by trace ratio criterion: Sw and Sb. They represent within class similarity, and
![Figure 1.1: Growth trend in UCI Machine Learning Repository [ 1].](https://thumb-us.123doks.com/thumbv2/123dok_us/9900072.2483459/20.893.199.804.129.496/figure-growth-trend-uci-machine-learning-repository.webp)
![Figure 2.1: Relevant, Redundant and Irrelevant Features [ 2].](https://thumb-us.123doks.com/thumbv2/123dok_us/9900072.2483459/28.893.174.809.129.493/figure-relevant-redundant-irrelevant-features.webp)
![Figure 2.2: The Ratio of the Volume of The Hypersphere Enclosed by the Unit Hypercube [3].](https://thumb-us.123doks.com/thumbv2/123dok_us/9900072.2483459/29.893.187.785.127.490/figure-ratio-volume-hypersphere-enclosed-unit-hypercube.webp)
![Figure 3.1: One Dimensional Linear Regression with Epsilon Intensive Band adapted from [5]](https://thumb-us.123doks.com/thumbv2/123dok_us/9900072.2483459/61.893.212.776.118.529/figure-dimensional-linear-regression-epsilon-intensive-band-adapted.webp)
![Figure 3.2: Antibody Activities on Mucosal Tissues [ 6]](https://thumb-us.123doks.com/thumbv2/123dok_us/9900072.2483459/65.893.174.789.126.544/figure-antibody-activities-on-mucosal-tissues.webp)