International Journal of Emerging Technology and Advanced Engineering
Website: www.ijetae.com (ISSN 2250-2459,ISO 9001:2008 Certified Journal, Volume 4, Issue 3, March 2014)
229
An Automated Ceramic Tiles Defect Detection and
Classification System Based on Artificial Neural Network
Rashmi Mishra
1, Dolly Shukla
2 1M.E Scholar, 2Professor, S.S.C.E.T Bhilai
Abstract—Ceramic tiles having great demands in the field of infrastructure and building development because of its affordable cost, easy installation, maintenance, moisture resistant property and comes in a wide variety of colours, textures, and sizes so it’s a good option for many environments. However his required large volume production which is performed by automated plants which generates thousands of tile per segments. The generation in such a numerous amount and very frequency makes it difficult to manually inspect the tiles flaws hence some fast, efficient and reliable automated process it required to perform so. Although here are many methods are used from simple visual image analysis, infrared vision to ultrasonic characterizations in all of them the visual image based systems are most economical and easily installable solution with low maintenance cost. However the process of flaw detection and their categorization (or classification) is not as much efficient as others but the recent growth in the computing technology, mathematical modelling and high resolution image capturing devices generated a new hopes in field. Presently many literatures are available of utilizing these systems for same purpose but the complex tiles textures and complicated fault appearance nature limits the identification accuracy of morphological operations or fixed mathematical model based systems. Hence in this paper we are proposing and artificial neural network (ANN) based technique which uses the transform domain characteristics of the tiles image the capability of the model by learning through system makes it flexible and dynamically configurable. The simulation results also verify the capability of the proposed algorithm as it outperforms the previous algorithms with considerable margin.
Keywords— Ceramic Tiles Analysis, Automatic Defect Detection, Artificial Neural Network, Automatic Visual Inspection.
I. INTRODUCTION
The main compounds used to make the ceramic tiles are
clay and other natural materials such as sand, quartz and water. Proper mixtures of all these compounds
are then pressed under very high pressure into squares, rectangles, or even ovals [1] then these blocks are baked for particular time at controlled temperature.
However when it is done in large amount there may always a possibility of not uniformity hence not all the tile get the required treatment which causes the development of flaws and the type of Flaws varies depending upon which factor or factors have been compromised. As it is already mention quality control in ceramic tile manufacturing is hard, labour intensive and it is performed in a Harsh industrial environment with noise, extreme temperature and humidity [2] and inspection contains variety measurements such as colour analysis, dimension verification, and surface defect detection [2].Hence in this paper we are proposing an efficient defect detection technique which can not only reduce the labours work but also guaranties product quality. The rest of the paper is arranged as the second section presents a literature review on the related topic. The third section explains the artificial neural network while in fourth section the proposed algorithm is described. The fifth section presents the simulation results for the proposed algorithm followed by sixth section in which conclusion is drawn on the basis of simulation results.
II. LITERATURE REVIEW
International Journal of Emerging Technology and Advanced Engineering
Website: www.ijetae.com (ISSN 2250-2459,ISO 9001:2008 Certified Journal, Volume 4, Issue 3, March 2014)
230 They aim at registering patches of an input image in a defect-free reference sample according to some admissible transformations. Their proposed approach relies only on few parameters which makes it an easily adaptable algorithm for industrial applications and, above all, it avoids complex tuning of configuration parameters. Ibrahiem M.M et al [7] describe the possible use of various PNN in solving some problems arising in signal processing and pattern recognition. The main attention is devoted to application of PNN in various classification problems like: classification brain tissues in multiple sclerosis, classification image texture, classification of soil texture and EEG pattern classification. The methods for texture analysis is in transform domain like DCT, spatial domain and other available methods in detail can be found on the literature’s[8] [9][10][11].
III. PROBABILISTIC NEURAL NETWORK (PNN)
Probabilistic neural network are a kind of radial basis network suitable for classification problems.
Figure1: Basic structure of Probabilistic Neural Network (PNN)
A Probabilistic Neural Network (PNN) consists of four layers. One is the input layer where the actual input vector is given. The second one is the pattern layer with one neuron for every training example. Input layer and pattern layer are fully connected. The next one is the summation layer, where the results of the pattern layer will be added. In this layer we have one neuron for each class we want to distinguish. The neurons of the pattern layer are connected to the neurons of the summation layer based on the class of the neuron in the pattern layer. So every neuron in the pattern layer of the same class is connected to the same neuron in the summation layer. The last layer is the output layer where the estimated class of the input data is shown. This is realized by an argmax operator over the outputs of the summation layer. For the use in this article we have no output layer and only one neuron in the summation layer. This structure is shown in figure 1.
The training process of a PNN is very easy. For each training vector in the training data set we create a neuron in the pattern layer. The weights of this neuron are set to the values of the training vector. After this the PNN is trained and can be used.
A. Advantages of PNN :
• PNNs are much faster than multilayer perceptron networks.
• PNNs can be more accurate than multilayer
perceptron networks.
• PNN networks are relatively insensitive to outliers.
B. Applications based on PNN:
• Probabilistic neural networks in modelling structural deterioration of stormwater pipes.
• Probabilistic neural networks method to gastric endoscope samples diagnosis based on FTIR spectroscopy.
• Probabilistic Neural Networks in Solving Different Pattern Classification Problems.
• Application of probabilistic neural networks to population pharmacokinetics.
• Probabilistic Neural Networks to the Class Prediction of Leukaemia and Embryonic Tumour of Central Nervous System.
• Ship Identification Using Probabilistic Neural. Networks
• Probabilistic Neural Network-Based sensor
configuration management in a wireless AD-HOC network.
• Probabilistic Neural Network in character
recognizing.
IV. PROPOSED ALGORITHM
Due to complex and dynamic nature of ceramic tiles flaws detecting such condition remains a challenging task for automation engineers and because of this currently available systems suffer from low detection capability and high number of false alarms. To overcome such performance limitations, we propose a Machine Learning algorithm, namely Probabilistic Neural Network (PNN), as the result, learning bias and generalization variance can be significantly minimized.
International Journal of Emerging Technology and Advanced Engineering
Website: www.ijetae.com (ISSN 2250-2459,ISO 9001:2008 Certified Journal, Volume 4, Issue 3, March 2014)
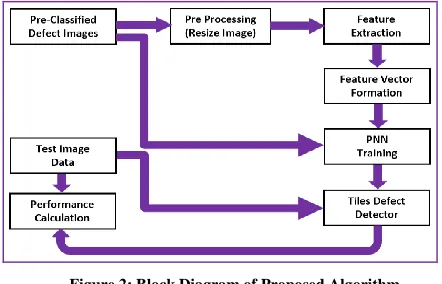
231 A. Algorithm for training phase:
Step 1: Read the images from the training database.
Step 2: Group the images according to the defect they belong to.
Step 3: Now read the images from each group and resize it to 128X128 pixels to reduce the processing time.
Step 4: Apply the mean filter, Edge detection and Segmentation on the resized image.
Step 5: Now perform the following calculations on the segmented image-
1. Calculate the histogram of each colour plane (R, G and B) separately and get the values of mean and the standard deviation of each histogram.
2. Perform the texture analysis of the image and calculate the texture energy and texture entropy.
3. Calculate the average contrast of the image.
4. Perform horizontal, vertical edge detection by using Sobel edge detector and diagonal edge detection using Roberts detector, then find the edge density for both edges.
5. Also calculate the centre of gravity of edge image.
Step 6: Form the feature vector for image by arranging the values calculated in step 5 in single row.
Step 7: now label each feature vector according to their corresponding image defect class.
Step 8: Train the Probabilistic Neural Network using the all the calculated feature vectors and their labels.
[image:3.612.58.279.515.657.2]Step 9: Use the trained neural network as a classifier for defect detection.
Figure 2: Block Diagram of Proposed Algorithm
B. Algorithm for Detection phase:
Step 1: Read the image to be analysed for the defect. Step 2: Perform all procedure used during training up to feature vector formation.
Step 3: Apply this feature vector to the probabilistic neural network trained during first phase (training), and take the output calculated by the PNN as defect
V. EVALUATION MEASUREMENTS
In general, the performance of any classification system is evaluated in term of accuracy, detection rate, and false alarm rate as in the following formula:
Accuracy = (TP+TN) / (TP+TN+FP+FN) Detection Rate = (TP)/ (TP+FP)
False Alarm Rate = (FP) / (FP+TN)
Table I
Confusion Matrix For Analysis Of Intrusion Detection System
Actual \ Predicted Normal Attack
Normal TN FP
Intrusion(attacks) FN TP
• True positive (TP) when attack data detected as attack • True negative (TN) when normal data detected as normal • False positive (FP) when normal data detected as attack • False negative (FN) when attack data detected as normal
VI. SIMULATION RESULTS
The intensive analysis of the proposed algorithm is performed for different number of training and testing data sized and also the comparison with the existing methods [1] are presented in this section.
TABLE II
Detection Rate Comparison For Different Number Of Tiles At 50% Training Ratio.
Number of Tiles
Previous Work
Proposed Work
10 100% 100%
20 90% 100%
30 90% 97.656%
40 92.5% 96.875%
50 92% 96.354%
International Journal of Emerging Technology and Advanced Engineering
Website: www.ijetae.com (ISSN 2250-2459,ISO 9001:2008 Certified Journal, Volume 4, Issue 3, March 2014)
[image:4.612.58.279.134.291.2]232
[image:4.612.316.571.155.438.2]Figure 3: Comparison graph for table 1. The graph shows that the proposed system increases the overall detection rate by 5%.
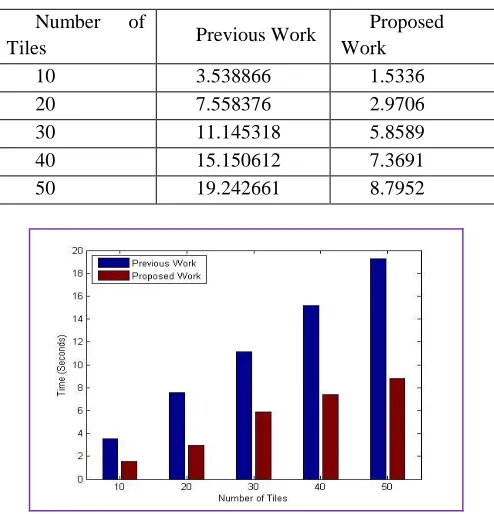
Table III
Detection Time (In Seconds) Comparison For Different Number Of Tiles.
Number of
Tiles Previous Work
Proposed Work
10 3.538866 1.5336
20 7.558376 2.9706
30 11.145318 5.8589
40 15.150612 7.3691
50 19.242661 8.7952
Figure 4: Comparison graph for table 2. The graph shows that the proposed system takes half of the time taken by previous algorithm.
Table IV
Detection Rate Comparison For Individual Defects.
Defect Previous
Work
Proposed Work
Crack 86.49% 100%
Blob 87.50% 100%
Edge 96.77% 97.92%
Corner 93.55% 95.83%
Figure 5: Comparison graph for table 3. The graph shows that the proposed algorithm out performs the previous algorithm in every
[image:4.612.45.292.341.598.2]type of defect detection.
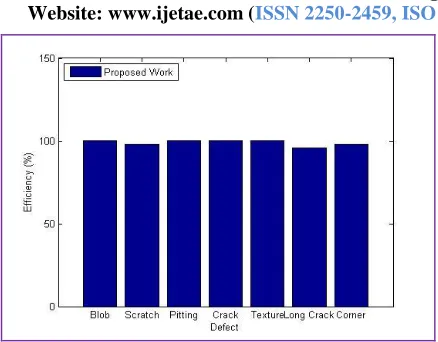
Table V
Detection Rate For All The Fault Proposed System Can Detect.
Defect Efficiency
Blob 100
Scratch 97.9200000000000
Pitting 100
Crack 100
Texture 100
Long Crack 95.8300000000000
Corner 97.9200000000000
[image:4.612.316.572.498.658.2]International Journal of Emerging Technology and Advanced Engineering
Website: www.ijetae.com (ISSN 2250-2459,ISO 9001:2008 Certified Journal, Volume 4, Issue 3, March 2014)
[image:5.612.59.278.117.288.2]233
Figure 6: Comparison graph for table 4. The graph shows that the proposed algorithm gives almost flat response for all types of defects.
VII. CONCLUSION &FUTURE WORK
In this paper, probabilistic neural network based ceramic tiles defect identification technique is proposed and simulated with in depth analysis and comparison with recently proposed technique. The analysis shows that proposed algorithm increases detection rate over 5% than the previous algorithm and it also slash down the detection time to half of the previous algorithm which is a necessary requirement for higher production rate.
The another benefit of the proposed algorithm that it does not required exact mathematical modeling of the defects so it can detect a Varity of known & unknown characteristics of tiles simultaneously. However in future some other classifier improvement may also be applied like pre-clustering, feature optimization and weight estimation which can further improve the efficiency of the system.
REFERENCES
[1] Md. Maidul Islam, Md. RowshanSahriar and Md. Belal Hossain ―An Enhanced Automatic Surface and Structural Flaw Inspection and Categorization using Image Processing Both for Flat and Textured Ceramic Tiles‖, International Journal of Computer Applications (0975 – 888)Volume 48– No.3, June 2012.
[2] H. Elbehiery, A. Hefnawy, and M. Elewa ―Surface Defects Detection for Ceramic Tiles Using Image Processing and Morphological Techniques‖, PROCEEDINGS OF WORLD
ACADEMY OF SCIENCE, ENGINEERING AND
TECHNOLOGY VOLUME 5 APRIL 2005 ISSN 1307-6884. [3] Aman Chadha. SushmitMallikand RavdeepJohar―Comparative
Study and Optimization of Feature-Extraction Techniques for Content based Image Retrieval‖, International Journal of Computer Applications (0975 – 8887)Volume 52– No.20, August 2012. [4] Tahir Cetin ―The Defect Detection in Ceramic Materials Basedon
Time-Frequency Analysis by Using the Methodof Impulse Noise‖, ARCHIVES OF ACOUSTICS DOI: 10.2478/v10168-011-0007-y36, 1, 77–85 (2011).
[5] Xien Cheng and JinghuaZheng ―Novel Approach of Surface Unfolding for Ceramic Bowls‖, I.J. Engineering and Manufacturing 2011, 3, 1-6.
[6] Jean-Luc Bouchot, GernotStubland Bernhard Moser ―A template matching approach based on the discrepancynorm for defect detection on regularly textured surfaces‖, https://www.academia.edu. [7] Ibrahiem M.M. El Emary and S. Ramakrishnan ―On the Application of Various Probabilistic Neural Networks in Solving Different Pattern Classification Problems‖, World Applied Sciences Journal 4 (6): 772-780, 2008 ISSN 1818-4952.
[8] Yu Tao, VallipuramMuthukkumarasamy, BrijeshVerma and Michael Blumenstein ―A Texture Feature Extraction Technique Using 2D– DFT and Hamming Distance‖, Computational Intelligence and Multimedia Applications, 2003. ICCIMA 2003. Proceedings. Fifth International Conference on 27-30 Sept. 2003.
[9] Yang Mingqiang, KpalmaKidiyo and Ronsin Joseph ―A Survey of Shape Feature Extraction Techniques‖, IETR-INSA, UMR-CNRS 6164, 35043 Rennes, Shandong University, 250100, Jinan.
[10] Roberto Márcio de Andrade and Alexandre Carlos Eduardo ―Methodology for Automatic Process of the Fired Ceramic Tile’s Internal Defect Using IR Images and Artificial Neural Network‖, Methodology for Automatic Process of the Fired Ceramic Tile’s Internal Defect Using IR Images and Artificial Neural Network January-March 2011, Vol. XXXIII, No. 1 / 67.
[11] AndrzejMaterka and Michal Strzelecki ―Texture Analysis Methods – A Review‖, A. Materka, M. Strzelecki, Texture Analysis Methods – A Review, TechnicalUniversity of Lodz, Institute of Electronics, COST B11 report, Brussels 1998.
[12] Patricia G. Foschi ―Feature Extraction for Image Mining‖, Romberg Tiburon Center for Environmental StudiesSan Francisco State University.