The Aquila Digital Community
The Aquila Digital Community
Master's ThesesSummer 8-2012
Zifazah: A Scientific Visualization Language for Tensor Field
Zifazah: A Scientific Visualization Language for Tensor Field
Visualizations
Visualizations
Haipeng CaiUniversity of Southern Mississippi
Follow this and additional works at: https://aquila.usm.edu/masters_theses
Recommended Citation Recommended Citation
Cai, Haipeng, "Zifazah: A Scientific Visualization Language for Tensor Field Visualizations" (2012). Master's Theses. 435.
https://aquila.usm.edu/masters_theses/435
This Masters Thesis is brought to you for free and open access by The Aquila Digital Community. It has been accepted for inclusion in Master's Theses by an authorized administrator of The Aquila Digital Community. For more information, please contact [email protected].
ZIFAZAH: A SCIENTIFIC VISUALIZATION LANGUAGE FOR TENSOR FIELD VISUALIZATIONS
by Haipeng Cai
A Thesis
Submitted to the Graduate School of The University of Southern Mississippi in Partial Fulfillment of the Requirements
for the Degree of Master of Science
ZIFAZAH: A SCIENTIFIC VISUALIZATION LANGUAGE FOR TENSOR FIELD VISUALIZATIONS
by Haipeng Cai August 2012
This thesis presents the design and prototype implementation of a scientific visual -ization language called Zifazah for composing and exploring 3D visualizations of diffusion tensor magnetic resonance imaging (DT-MRI or DTI) data. Unlike existing tools allowing flexible customization of data visualizations that are programmer-oriented, Zifazah focuses on domain scientists as end users in order to enable them to freely compose visualizations of their scientific data set. Verbal descriptions of end users about how they would build and explore DTI visualizations are analyzed to collect syntax, semantics, and control structures of the language. Zifazah makes use of the initial set of lexical terms and semantical pat-terns to provide a declarative language in the spirit of intuitive syntax and usage. Along with sample scripts representative of the main language design features, some new DTI visualizations created by end users using the novel language have also been presented.
I would like to first thank my advisor, Dr. Jian Chen, who offered me a comfort-able place to learn doing research and valuable academic advice with constant patience and encouragement, without which this work would have not been practical. I am especially grateful to her research guidance that will greatly contribute to my long-tem1 profession in the future.
I would also like to my other thesis committee members, Dr. Alexander P. Auchus, Dr. David H. Laidlaw, and Dr. Chaoyang Zhang, for their kind advice and generous support of resources that were essential for this work to be undertaken. Their invariable help in all possible aspects has been indispensable for the smooth progress throughout this work and even my whole graduate study period here at The University of Southern Mississippi.
Additionally, I would express my gratitude towards medical experts in DTI and non-expert participants for their participation in our experimental studies fTom which the language design features and principles arc smmnarized. Their comments on the language when using it as end users are appreciated as well.
ABSTRACT . . . . . . . . . . . . . . . . . . . . . . . . . . . . . . . . . . . . . ii ACKNOWLEDGMENTS . . . . . . . . . . . . . . . . . . . . . . iii
LIST OF TABLES . . . . . . . . . . . . . . . . . . . . . . . . . . . . . . . v
LIST OF ILLUSTRATIONS . . . . . . . . . . . . . . . . . . . . . . . . . . . . . . v1
I. INTftODUCTION . . . . . . . . . . . . . . . 1
II. BACKGftOUND AND ftELATED WOftK . . . . . . . . . . . . 6
III. LANGUAGE DESIGN . . . . . . . . . . . . . . . . . . . . . . . . . . 10
IV. IMPLEMENTATION . . . .. . . .. . . 28 V. USAGE SCENAIDOS . . . . . . . . . . . . . . . . . . . . . . . 30 VI. DISCUSSION . . . . . . . . . . . . . . . . . . . . . . . . . . . . . 35 VII. CONCLUSION . . . . . . . . . . . . . . . . . . . . . . . . . 37 ftEFEftENCES .. . . 38 lV
Table
1 Zifazah Language Symbols and Keywords . . . . . . . . . . . . . . . . . . . . . 13 2 Combinatorial Rules of Constants in UPDATE Statement of Current Zifazah
Implementation . . . . . . . . . . . . . . . . . . . . . . . . . . . . . . . . 21
Figure
1 A screenshot of the Zifazah programming interface, consisting of a program-ming text board (upper left), a simple debugging output window (bottom left) and the visualization view (right). . . . . . . . . . . 3 2 Illustration of the task-driven design of Zifazah. . . . . . . 17 3 Illustration of the design of Zifazah as a spatial language. . 20 4 Flexible data encoding built in the design of Zifazah. . . . 22 5 Illustration of the flat control structure of Zifazah program. . 25 6 Result of an example script showing Zifazah as a fully declarative language. . 27 7 Screenshot of the visualization resulted from running the Zifazah program
writ-ten in scenario 1. . . . . . . . . . . . . . . . . . . . . . . 32 8 Screenshot of the result after running the Zifazah program that examines ROis
in scenario 2. . . . . . . . . . . . . . . . . . . . . . . . . . . . . . . . . 33 9 Screenshot of the running result of Zifazah script written for an end-user task
in scenario 3. . . . . . . . . . . . . . . . . . . . . . . . . . . . . . . . . . . . 34
CHAPTER I
INTRODUCTION
Visualization tools often support user customization, which allows changes of the visu-alization so as to help users gain better understanding of the underlying data, thus facilitating knowledge discoveries about the data that would be hard to achieve otherwise. However, the support of user creativity is usually constrained by the limits of predefined options or functionalities for the customizations. An effective way to address these constraints is to offer users a programming environment in which they can freely compose towards desir-able visualizations of their data through a visualization language. While such languages have been proposed and successful in the infonnation visualization (Info Vis) community [17, 25, 12], there is a lack of end-user visualization language for 3D scientific visualiza-tion (SciVis). Based on our many discussions with domain users, we have recognized that domain scientists want a visualization of their own data to be designed and built by them-selves. Now that the success of visualization languages for Info Vis is probably attributed to their capabilities of empowering users to design their own visualizations, what if domain scientists have a visualization tool that is powerful but easy to maneuver so that they can fully control the design elements and visual components to create whatever visualization they really have in mind?
A recently advanced MRI technique, diffusion tensor imaging (DTI), has proven ad-vantageous over other imaging techniques in that it enables in vivo investigation of bio -logical tissues and, through three-dimensional (3D) tractography [8], explorations of the distribution and connectivity of neural pathways in fibrous tissues like brain white matter and muscles. Further, as one way to visualize DTI data, 3D visualization of the streamline
data model derived from the tractography can illustrate the connectivity of fiber tracts and structures of anatomy, and therefore provides a powerful means to assist neuroscientists in clinical diagnosis and neurosurgical planning.
I proposed a visualization language as the first tool of this kind for DTI visualizations because DTI is complex enough to stimulate a design that would be useful for simpler and similar visualization problems such as that of flow visualization. Although mainly driven by neurologists' need for conducting their clinical tasks with DTI visualizations, this language design would also be reusable in a broader range in 3D SciVis. Motivated by the needs of spatial explorations in 3D scientific visualizations because of the spatial constraints within the data, the present language is particularly useful in empowering domain scientists to build 3D visualizations that best meet their specific needs. Furthermore, the language can facil-itate domain scientists' effective use and exploration of the visualizations as well because it allows them to customize essential elements of visualization with the maximal flexibility by applying their best understanding of the domain data to the visualization composition process. Illuminated by Bertin's Semiology of Graphics [9], I designed the language to allow users to compose symbols in 3D visualizations, including visual encoding methods and other causes that affect visualization task performance.
To capture the design elements of the language, I have conducted experimental studies with domain scientists in DTI who are expected users of this language, and I have summa-rized design principles for the language out of their descriptions of visualization making and exploration, from which basic lexical terms such as verbs, prepositions, and conjunctions were also reduced. With these principles and language elements, I have developed alan-guage prototype, named Zifazah, as an initial implementation of the visualization language I am proposing. To target non-programmer users like neural medical doctors, Zifazah is designed to be a high-level declarative language. Also, for an easier usage for users with-out any programming skills and experience, Zifazah is currently developed as a procedural language that contains only an intuitive type of control structure, i.e. the sequential struc
-.tt...-s"n> OJI"IM"t'Sr .,..orc..lowH'I r"wcsr )tt.e.."t'"'C"(' •f'lN·.._ .... rr .,.,. ~ H:Y ~-• "t."C"' n.Jco•H•IOil.OJr,.,U"" .,.fatt~~~,,,..,._ ... ,u. _...,..,•,ro· •f'l«t~Cttn~N,.fr •tl«1"'1o\IA<!fr' llp4a«~.,., • ..,. •. ,,o. ,,k,.,· •• r .:alt.btl'tt-t~cn•"(.li" A.l.a'1,.
lW~•uC'dhJ'f'6l<"l,.,..'-co•11ft»S,•-.tiL niiUto
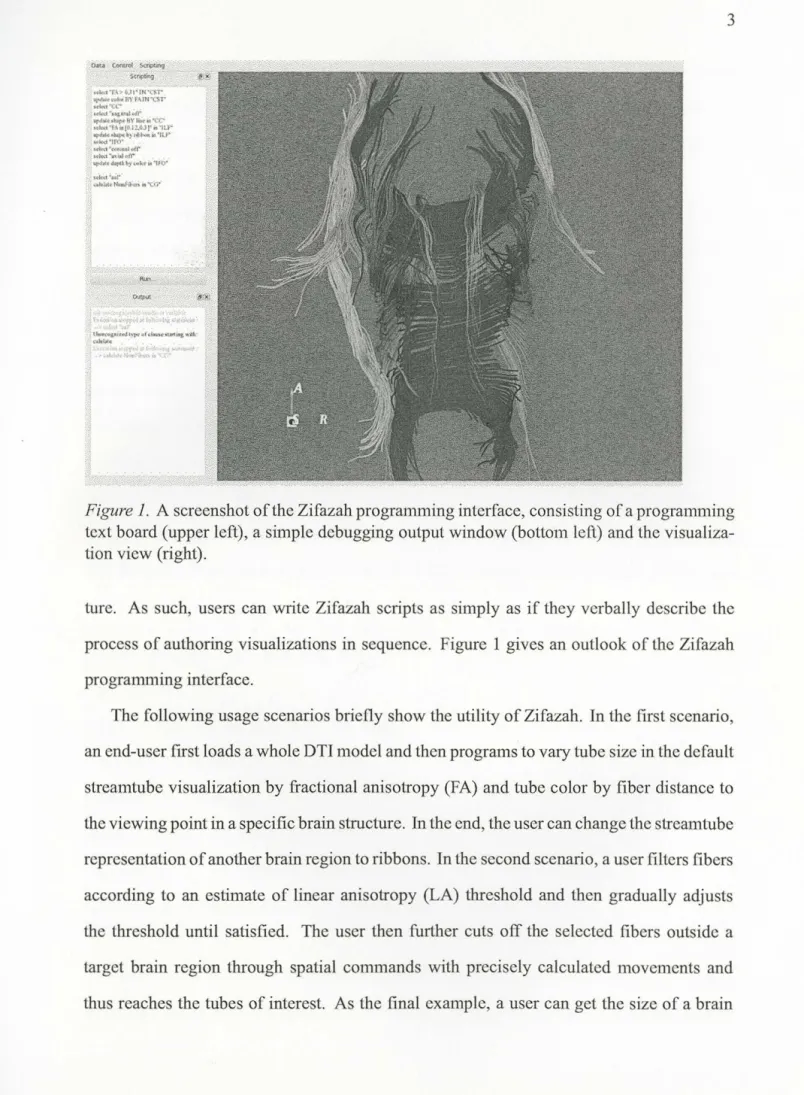
Figure 1. A screenshot of the Zifazah programming interface, consisting of a programming text board (upper left), a simple debugging output window (bottom left) and the visuali za-tion view (right).
ture. As such, users can write Zifazah scripts as simply as if they verbally describe the process of authoring visualizations in sequence. Figure 1 gives an outlook of the Zifazah progranm1ing interface.
The following usage scenarios briefly show the utility of Zifazah. In the first scenario, an end-user first loads a whole DTI model and then programs to vary tube size in the default streamtube visualization by fractional anisotropy (FA) and tube color by fiber distance to the viewing point in a specific brain structure. In the end, the user can change the stream tube representation of another brain region to ribbons. In the second scenario, a user filters fibers according to an estimate of linear anisotropy (LA) threshold and then gradually adjusts the threshold until satisfied. The user then further cuts off the selected fibers outside a target brain region through spatial commands with precisely calculated movements and thus reaches the tubes of interest. As the final example, a user can get the size of a brain
structure in tem1s of the number of fibers, average FA in a brain region, and other common DTI mctrics after reaching the target fibers. In each of these scenarios, the user achieves each step by writing a declarative program statement in the script editor, and the results arc reflected in the visualization view (see Chapter V).
Apart from a visualization language that helps domain scientists build DTI visualiza-tions by themselves to exactly meet their specific needs with the visualizations, this work also contributes several design features to general DTI visualizations including: (1) visual symbolic mapping based on color, size and shape, as is new for scientific visualizations; (2) lexical representations of spatial relationships for 3D object visualization and manipu-lations; and (3) data encoding flexibility built upon the migration of Bertin's semiological principles to scientific visualizations.
This language will be the first of its kind. The following snippet gives a quick view of how a Zifazah program looks. This script describes an exploratory process of an end user with the streamtube model [33] of a human brain DTI data set, in which different fiber bundles are filtered according to threshold of DTI metrics and customized with various visual encoding methods.
LOAD '' /tmp/ allfb _tagged. data" SELECT "CC"
SELECT "FA in [0.2,0.25]" IN "IFO" UPDATE color BY FA IN "CC"
SELECT "LA > 0.35" IN "CST'' UPDATE shape BY line IN "CC" UPDATE shape BY tube IN "IFO"
UPDATE size BY FA WITH 0.1,20 IN "IFO"
As shown in this example, a Zifazah program is essentially an intuitive sequence of steps, each carrying out a single visual transfom1ation of data. Although the script is written in a
textual form as in a traditional computer programming language, each of the statements is more like a high-level command. Also, there is no logic structure other than the sequential one in Zifazah, which makes this language fairly easy to learn and use for end users in medical field.
The rest of this thesis is organized as follows. I frrst give general background and dis-cuss related work _in Chapter II. In Chapter III I detail design principles and supporting language clements and then brief implementation issues in Chapter IV. Chapter V expands the details of the three usage scenarios introduced above and gives the corresponding Z i-fazah scripts and running results. I discuss other design considerations of the language and design features to be fully implemented that arc integral to the overall language design in Chapter VI before finally concluding the thesis in Chapter VII.
CHAPTER II
BACKGROUND AND RELATED WORK
VisuaJization of DTI Models
In general, DTI data sets can be visualized using various approaches ranging from direct volume rendering of tensor field [21] to geometry rendering of the fiber model derived from tensor field. With geometry rendering, DTI fibers are usually depicted as streamlines [20], streamtubes and streamsurfaces (33]. In order to explore 3D visualizations of the fiber geometries, 2D embedding and multiple coordinated views [19], along with various interactive techniques [10, 29], have been employed.
Many other powerful tools have also been developed for exploring DTI visualizations [6, 19, 32, 7, 10]. However, due to the data complexity, domain users' needs for performing their various tasks in daily practice have not yet been fully satisfied by using those tools. To give users more flexibility, some of the visualization tools are made highly configurable by allowing a wide range of settings (28, 31, 29]. Nevertheless, it is still challenging to design a thoroughly effective visualization tool to meet all the needs of users. For instance, MediNRIA (31] provides rich predefined functionalities yet does not allow end-user com-position of visualizations. For another example, Slicer [28] is made very powerful via the integration of various function models, working like a data processing and visualization tool suite, but it is not designed for users to create their own visualizations in order to satisfy their typical domain tasks. Also, although sometimes able to meet specific requirements, higher flexibility of a visualization tool may even make the tool more complex to use for domain users [22].
Composable Visualizations
Since pioneering the automatic generation of graphic representation [24], Mackinlay's work has been extended lately into a visual analysis system armed with a set of interface commands and defaults representing the best practices of graphical design [25], upon which a commercial so~ware called Tableau was developed. In his work, the generation of vi-sualizations was automated thanks to the application of a series of design rules and made adaptable to users with a wide range of design expertise via constrained flexibilities by those design rules. With Zifazah, I also intend to provide an environment in which end users can flexibly build their own visualizations like Tableau. However, instead of targeting visual analysis in the context of two-dimensional (2D) information visualization, Zifazah primar-ily aims at end-user visualization making and exploration with 3D scientific data such as DTI. Also, compared to the visual specifications in Tableau, like those in its predecessor Polaris [30], textual programming is the main means for end users to interact with visu-alizations of interest in Zifazah. Similar to Polaris in tenns of using visual operations to build visualizations, dynamic queries [29] aims to support retrieving DTI fibers instead of querying relational database in Polaris.
As a toolkit, Protovis gives users high-level usage flexibility, even programmability, yet imposes constraints upon user programs through implicit rules to produce effective visual-izations [12]. This tool has been evolved into its descendant named D3 [13] for a better support of animation and interaction. Zifazah shares some Protovis features like address-ing non-programmer audiences and having concise and easy-to-learn grammar. However, different from Protovis that uses simple graphical primitives called marks to construct in-fom1ation visualizations and mainly targets web and interaction designers, Zifazah targets neuroscientists instead and enables them not only to flexibly construct, but also to effec-tively explore, in the context of scientific visualizations exemplified by that of DTI data.
Visualization Languages
Processing [17] is more a full-blown programming language and environment than a traditional visualization tool. Built with the full Java programming language facilities, Processing integrates the underlying visual design rules to help users build beautiful yet in-fonnative visualizations with the support of interaction design. Although developed to be accessible for new ·users and non-programmers, Processing is more oriented to users with a certain level of programming skills and might still be challenging for domain users like neu-roscientists who are the primary audience I address. A sister visual programming language of Processing, Processing.js [2] also targets web developers. By contrast, Zifazah is dis-tinct in that it empowers end users to explore scientific data through intuitive syntax within a sequential structure rather than offering a full set of programming features in a traditional computer language as Processing does. Like Zifazah, Impure [1] is also a programming language for data visualizations that targets non-programmers. Although supporting vari-ous data sources, this completely visual language is developed for infom1ation design rather than for scientific visualizations.
Although a natural language like WordsEye [ 11] for visualizations might be appealing to ordinary users without any programming knowledge, I do not attempt the entirely de-scriptive nature for Zifazah as WordsEye did at the current stage. In tem1s of lexical and syntax design, Zifazah is similar to Yahoo! 's Pig Latin [ 14 ], which is a new data processing language associated with the Yahoo! Pig data handling environment that balances between a declarative language and a low-level procedural one. The language supports data filtering and grouping with parallelism by its map-reduce programming capability. However, this language does not handle visualizations or any form of graphical representations but focus-ing on ad-hoc data analysis. Also, Zifazah is set apart from Pig Latin in the target audience again, since the latter mainly serves software engineers.
The Proto vis specification language [ 18] is a declarative domain-specific language (DSL) that supports specification of interactive infom1ation visualizations with animated
transi-tions, providing an approach to composing custom views of data using graphical primitives called marks that are able encode data by dynamic properties, which is similar to the map-ping of object properties to graphical representations in another Info Vis language presented by Lucas and Shieber [23]. To some extent, both languages are comparable to Microsoft's ongoing project Vedea, aiming at a new visualization language [4] in tem1s of syntactic design and programming style, although its design goals are closer to that of Processing.
Also in the Info Vis domain, Trcvil [3] is a progrmnming language based on its prede-cessor Trcvis [5], a framework used for context tree visualization and analysis. It supports composing visualizations but is dedicated to the visualization of unordered trees. Peter-son et al. discuss another specific-purpose language [27] that serves the composition of visualizations of mathematical concepts like those in basic algebra and calculus.
Recently, Metoyer et al. [26] report from an exploratory study a set of design implica-tions for the design of visualization languages and toolkits. More specifically, their findings infonn visualization language design through the way end users describe visualizations and their inclination to use ambiguous and relative, instead of definite and absolute, terms that can be refined later via a feedback loop provided by the language. Their findings also dis-close that end users tend to express in generally high-level semantics. During the design of the present language, I have benefited from these findings and actually have reflected them in the development of Zifazah.
CHAPTER III
LANGUAGE DESIGN
In this chapter, I first brief end-user descriptions on composing DTI visualizations from which design requirements and principles, as follow a summary of the language symbols and description ofZifazah data model, are extracted and motivated respectively. The devel-opment of Zifazah is driven by end-user requirements with DTI visualizations and the de -sign principles are embodied in the language features of Zifazah. After each ofthe language features, Zifazah language elements that meet the feature are detailed, including related lexical tcm1s and syntactic patterns. Instead of describing the implementation techniques, which are highlighted in Chapter IV, this chapter emphasizes how the design principles and language elements address the end-user requirements.
Design Motivations
The design ofZifazah is motivated by the needs of typical end users I target for compos -ing DTI visualizations by themselves, which can be derived from their verbal descriptions about visualizations they would desire in my many interviews and discussions with them. I report just a few representative example comments from them on visualizations produced beforehand by computer scientists.
The participants include neurologists and neural physicians, both conducting clinical diagnosis with DTI data visualizations. In a typical interview, participants are presented visualizations of the same DTI brain data set composed differently by manipulating vari -ous visual elements and the compositions are done by computer scientists, who then revise the composing process according to the comments of participants. As a result, either the
unsatisfactory visualizations are fmally modified to meet participants' requirements or sug -gestions for achieving the desirable visualizations are received if the current tool is not capable of composing the desirable ones.
As an example, multiple visual mappings of depth values to size and color docs not enhance the visualization of DTI model as expected. Surprisingly, " ... it is misleading to have the different size" while color has already been used to discern depth, and " ... would rather have it stay the same size as I spin it around." However, visual mapping of depth to color is still preferable since " ... I like it with the color. That is what I need to look at." Nevertheless, the composed coloring scheme in which color is mapped by depth might also
be useful" ...
if
determined by the principal eigenvalues." And " ... I think that color is a good idea but prefer color by orientation ... " etc.There is also a call for doing analysis in the composing environment(" .. . A !so, one thing for fibers, I am looking at for analysis purposes"). Emphatically, both classes of participants unanimously "want to do the analysis over here on the same page, that will be good, too, rather than opening it up again and trying to do it. .. It will all come together. It will all be integrated into one .... "
These observations all suggest that domain users, exemplified by the typical end users of Zifazah above, potentially ask for a high-level tool, aLLowing them to define a self-controlled
sequence of operations that works towards a visualization precisely meeting their own
spe-cific needs. By allowing users to compose with well-designed visual elements, a program
-ming environment can provide the capabilities for neurologists to create their own visual-izations, by which the present work is justified.
Furthem1ore, the work with Zifazah is substantially grounded upon the semiology of the graphic sign-system and especially the taxonomy about the properties and characteristics of retinal variables [9] in tenns of the syntax and semantics design for the scientific vis u-alization language. Zifazah incorporates a subset of the properties and characteristics that are most relevant, according to neurologists' verbal descriptions about DTI visualizations,
to the language structure and content: size variation, color variation, and shape variation. For one thing, corresponding syntax tem1s arc built into the language core as basic symbols. For another, semantics associated with these terms are designed to support composing DTI visualizations with respect to these retinal variables by allowing free manipulations of the attributes ofrelated variables. While the semiology and taxonomy is originally formulated to guide the design of 2D graphical representations, I extend them into the 3D graphical environment and employ them in the case of DTI visualizations.
It is fairly noteworthy, and common as well, in participants' verbal descriptions that spatial terms are frequently used and most of the tcm1s related to spatial locations are relative besides those measured in precise units. That Zifazah is designed to be a spatial language is exactly in response to the concems of my target end users with the spatial relationship of data components in the scientific data model being visualized. The participants' descriptions are also in accordance with the fact that spatial constraint is a defining data characteristic of scientific visualization. Consequently, Zifazah includes a set of syntactic and semantic supports for spatial operations in order to meet end-user needs for composing 3D scientific visualizations like that of DTI models.
Intending to be an initiative of an end-user programming approach to scientific vis u-alizations, Zifazah is designed to support an environment in which domain scientists as end users can compose highly customizable visualizations reflecting their thinking process with the graphical representations of their data set. Since Zifazah is designed for DTI vi-sualizations, the language design primarily deals with DTI data. In this context, language elements of the present Zifazah are derived from experimental study with neuroscientists using diffusion MRI data models. As a matter of fact, the symbols and syntax of the current version of Zifazah are extracted from verbal descriptions by neurologists using DTI about how they would create and explore DTI visualizations. As often referred to as end users, neuroscientists, neurologists and other medical experts who conduct clinical practice with DTI data and its visualizations are the primary audience the Zifazah language targets.
Language Symbols
Table I. Zifazah Language Symbols and Keywords
Verbs LOAD, SELECT, LOCATE, UPDATE, CALCULATE
Prepositions IN, OUT
Conjunctives BY, WITH
Operators 0
,<,<=,>,>=,==,=,+,-built-in routines AvgFA, AvgLA, NumFiber
Constants shape, color, size, depth, FA, LA, sagittal, axial, coronal, CC, CST, CG, IFO, ILF, DEFAULT, RESET
The core content of Zifazah itself is a simple set of language symbols and keywords.
End-user actions intended with DTI visualizations are triggered through five key verbs that
are all complete words in natural English. Prepositions are used for targeting scope of data
of interest and conjunctives for connecting statement tem1s. All operators used in Zifazah
are exactly the same as those used in elementary math. Specifically, [] serves as range
op-erator here for giving a numerical bound that is used in conditional expressions and + and
-are relative (increment and decrement) operators rather than serving arithmetical operations
(addition and subtraction). Several built-in routines are provided in Zifazah for simple data
statistics and analysis in DTI visualizations: AvgFA and AvgLA calculates the average FA
and average LA of a scope of fibers respectively, and NumFiber gives the number of fibers
in a fiber bundle. Among the reversed Zifazah constants, the aforementioned five major
fiber bundles in human brain model are included.
In these language symbols, all verbs and prepositions are directly picked up from my
neurologist collaborators' common descriptions of visualization composition and exp
lo-ration in natural language. Fiber bundle constants(CC:corpus callosum, CST:corticospinal
tracts, CG:cingulum, ILF:inferior longitudinal fasciculus, and IFO:inferior frontal occipital
fasciculus) are also suggested by them and operators, built-in routines and other constants
current Zifazah implementation contains a small set of symbols. However, the language has
been designed to be scalable to increase in each type of symbol listed in tcm1s of imple -mentation techniques.
Data Model and Input
For the design goals with target end users, Zifazah docs not have any specific data types
and does not deal with any low-level data processing either. Instead, Zifazah focuses on visual transformations in 3D visualization. As previous examples disclose, I have used a classified geometrical data model derived from DTI volumes, in which fibers arc clustered in tem1s of brain anatomy. In the present data model as input to Zifazah, each fiber has been manually tagged with anatomical cluster identity as one of the five major bundles. Currently, Zifazah's ability to recognize the constants for the major anatomical bundles de-pends on these cluster tags in the structure of the data model input. However, the language
design is not restricted to handling only clustered data. Actually, Zifazah is freely adap t-able to an unclustered data model, although data target specification with the major bundle constants will be processed as the whole model then (see Figure 6 and the source script).
Nevertheless, Zifazah's capability of spatial operations empowers users to explore regions
of interest (ROis) in the unclustered data models.
In a Zifazah program, the first step is to indicate the source of data model by giving the name of a data file. As an example, a Zifazah data input statement is written as:
normalBrain = LOAD ''data/normalS1. dat ''
where the LOAD command parses the input file and creates data structures that fully
de-scribe the data model, including identification of the cluster tags. This input specification
statement can also update current data model at the beginning of the visualization pipeline if it is not the first step in a Zifazah script. The evaluation is optional and, when provided,
current version of Zifazah but is required for exploring multiple data sets concurrently (sec
Chapter VI).
Task-driven Language
The language design of Zifazah is originally driven by the visualizat-ion tasks that
do-main users need to perfonn in their ordinary clinical practices. Among others, some ofthcir typical tasks are (1) checking integrity of neural structures of a brain as a whole; (2)
examin-ing fiber orientation in a ROI or fiber connectivity across ROis; (3) comparing fiber bundle
sizes between brain regions; (4) tracing the variation ofDTI quantities such as FA along a
group of fibers; and (5) picking particular fibers according to a quantitative threshold, etc. When using DTI visualizations, not only looking for the whole data model, neurologists
are also inclined to concentrate on regional details. In the case of brain DTI visualizations,
they often narrow down the view scope toward a relatively large anatomical area in the first place and then dive into a specific ROI. In other words, they tend to pay more attention to
ROis than to the whole brain. More specifically, in the visualizations where neural path-ways are depicted as streamtubes, the ROis are usually clusters of fiber tracts called fiber bundles. For instance, at the beginning of a visualization exploration, one of the neurolo -gist collaborators intends to look into frontal lobe fibers within the intersection of two fiber
bundles, CST and CC, and ignores all other regions of the model. Further, suspicious of fibers with average FA under 0.5 for a cerebral disease with which the brain is probably afflicted, the user goes on to examine exactly the suspect fibers. Later on, the user focuses on the small fiber region to see how it differs from typical ones, in tenns of orientation and DTI metrics, for instance.
Zifazah is designed as a task-driven language to support this requirement process through high-level primitives such as SELECT and common arithmet-ical conditional operators in-cluding a range operator in. Zifazah is mainly featured with facilities for step-by-step data filtering with these primitives. For example, suppose the user above is to explore the fibers
of interest, he can write in Zifazah as follows:
SELECT "FA < 0.5" IN "CST" SELECT "FA < 0.4" IN "CC"
As the result, fibers in both specific bundles with average FA under 0.5 will be highlighted
to help users focus on the local data being explored. On top of this, the user can customize the visualization of the filtered fibers through various visual encoding methods using the UP DATE syntax. This is particularly useful when he wants to keep the data already reached in focus before moving to explore other relevant local data in order to add more fibers
into his focus area, or when he simply seeks for a more legible visualization of the data first reached. The instance below, following the same example, illustrates how a better depth perception achieved by a type of depth encoding, together with a differentiating shape
encoding, are added up to the two selected fiber bundles respectively. SELECT "FA < 0.5" IN "CST"
SELECT "FA < 0.4" IN "CC" UPDATE depth BY color IN "CST11 UPDATE shape BY ribbon IN "CC"
This simple sequence of commands help users locate desirable fiber tracts with high
accu-racy while allowing flexible customization upon current visualizations. With this language, users compose intuitive steps to finish tasks that are difficult to achieve by visual
interac-tions. In this case, tracts of interest (TOTs) are first focused and then further differentiated
for more effective exploration through improved legibility. In general, Zifazah's design
emphasizes this task-driven process of visualization exploration, which fits the thinking
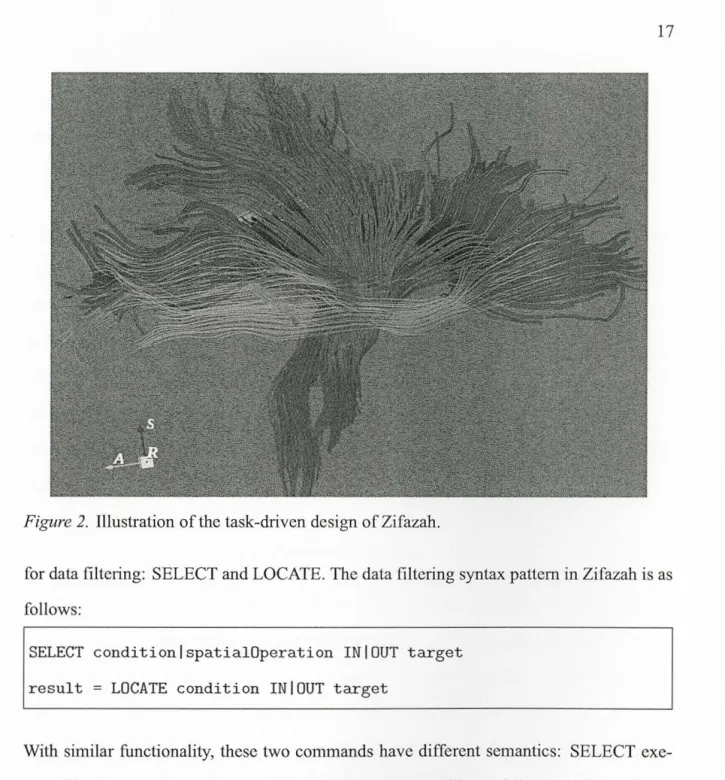
process of end users with the present visualizations. Figure 2 shows the resulting
visualiza-tion.
Filtering data in order to reach an ROI is an operation frequently used during our neu -rologist collaborators' explorations in DTI visualizations. Zifazah offers two commands
Figure 2. Illustration of the task-driven design of Zifazah.
for data filteting: SELECT and LOCATE. The data filtering syntax pattern in Zifazah is as follows:
SELECT conditionlspatialOperation INIOUT target result
=
LOCATE condition INIOUT targetWith similar functionality, these two commands have different semantics: SELECT exe-cutes filtering in an immediate mode by highlighting target fibers while LOCATE perfonns an offline filtering operation, retrieving target fibers and sending the result to a variable without causing any change in the present visualization. Also, SELECT provides rela-tive spatial operations through moving anatomical cutting planes. In fact, it is tempting to combine these two commands into one while differentiating the two semantics (by recog-nizing the presence of variable evaluation and taking spatial operations as an alternative to the condition term). However, I still keep these two commands separate based on e nd-user comments asking for a more straightforward understanding of the semantics and easier
memory of language usage. For example, SELECT 11LA <= 0.7211 IN 11ALL11
partialiLF = LOCATE 11FA in [0.5,0.55] 11 OUT 11ILF"
The SELECT statement will filter fibers in the whole DTI model with average anisotropy greater than 0.72 (by putting them in the contextual background) and highlight all other fibers. In comparison, the LOCATE statement will not update the visualization but pick up fibers outside the ILF bundle having average FA value in the specified range. Note that when no specific data encoding applied, different colors will be applied to ROI fibers in different major bundles in Zifazah for discerning one ROI from another when there is more than one highlighted. Also, filtered fibers will still be in semi-transparency as the contextual
background rather than being removed from the visualization.
Spatial Exploration
One of my main design goals with Zifazah is to provide a language with which users are able to operate spatial structures. I found that my neurologist collaborators tend to fre-quently use spatial terms such as "para-sagittal", "in", "out", "mid-axial" and "ncar coro-nal", etc. in their descriptions about DTI visualizations in the 3D space. They also use a set of other general spatial tem1s including "above", "under", "on top of'', "across" and "between", etc. like what Metoyer et al. found [26] and more domain-specific ones such as "frontal", "posterior" and "dorsal", etc. At present, Zifazah contains only a subset rather than all of these spatial tem1s.
In such a 3D data model as that from DTI, spatial relationships between data compo-nents are one of the essential characters, which are actually typical of 3D scientific data in general. Accordingly, composing a DTI visualization necessitates the capability of using spatial operators with domain conventional terms in order to describe the process of visual-ization authoring. In response, Zifazah supports spatial operations through two approaches
combined. First of all, three visible cutting planes that help guide in the three conventional anatomical views, namely the axial, coronal and sagittal view respectively, are integrated in the visualization view (see Figure 1). Then, flexible manipulating operations upon the
three planes are built into the Zifazah spatial syntax defrnitions. This enables end users to navigate in the dense 3D data model with a highly precise filtering capability exactly as they examine a brain model in clinical practice.
For instance, suppose the streamtube representation of a DTI model being programmed
is derived using unit seeding resolution from DTI volumes with a size of 256 x 256 x 31
captured at a voxel resolution of 0.9375mm x 0.9375mm x 4.52mm, and suppose both the axial and coronal planes are located at their initial position so that nothing is cut along these
two views. In order to examine suspect anomaly in the brain region of the occipital lobe, a
medical doctor attempts to filter the data model so that approximately only this region will
be kept. For this task, the corresponding Zifazah script can be written as:
SELECT "coronal +159.25" SELECT "axial -27.5" SELECT "sagittal +183.2"
Similarly, relative movements can be imposed on the sagittal plane as well. These simple
relative operators included in Zifazah in support of spatial exploration are also infom1ed
by the design in1plications found before [26], although they mainly come fTOm user
re-quirements of performing DTI visualization tasks pertaining to spatial operations. Figure 3
shows the resulting visualization.
Data Encoding Flexibility
According to Bertin's semiotic taxonomy [9], graphically encoding data with key visual
elements such as color, size, and shape plays a critical role in the legibility of 2D graphical
percep-Figure 3. Illustration of the design of Zifazah as a spatial language.
tion has a detrimental impact on the overall legibility, and depth cues (DC) are an ordinal dimension in the design space of 3D occlusion management for visualization [ 16].
We have combined both aspects in our Zifazah language design: symbolic mapping of color, size, and shape for 2D graphical legibility enhancement and depth encoding, also via common visual elements such as color, size, value (amount of ink), and transparency, as depth cues for occlusion reduction in the 3D environment. As already shown in the prev i-ous example scripts, Zifazah allows end users to freely customize DTI visualizations using either a single data encoding scheme alone or compound encoding scheme by flexibly com -bining multiple encoding methods. The latter leads to a mixed visualization as illustrated in Figure 1.
In their composing or exploratory process with DTI visualizations, users often attempt to examine more than one data focus simultaneously and would like to differentiate one focused ROI from others so that they will not get lost themselves within the multiple ROis.
There are also other occasions under which the users have difficulty in navigating along the depth dimension even in a single ROI. The data encoding flexibility in Zifazah is driven by both of the two user attempts. For an example, suppose a user has composed the streamtube
visualization of a brain DTI data set with default data encoding (unifom1 size, color, and shape without depth cues) and now wants the overall encoding scheme to be different across fiber bundles. In order to achieve this effect, an example Zifazah snippet can be written as
follows:
SELECT "ALL"
UPDATE shape BY LINE IN "CST" UPDATE size BY FA IN "CG" UPDATE color BY FA IN "IFO"
UPDATE depth BY transparency IN "CG"
UPDATE depth BY value IN "CC" WITH 0.2,0.8 UPDATE depth BY color IN "ILF"
Then, in the resulting visualization, each of the five major bundles will be visually disparate
from others since all these bundles are encoded differently. Figure 4 shows the resulting visualization. Oftentimes, once one ROI or more is filtered out, it is also necessary to
Table 2. Combinatorial Rules of Constants in UPDATE Statement of Current Zifazah Im -plementation
varl var2 parameters
shape line, tube, rib bon NIA
color FA, LA N/A
SIZe FA, LA minimal, scale
depth size,eolor,value, lower,upper transparency
DEFAULT N/A N/A
Figure 4. Flexible data encoding built in the design of Zifazah.
examine the selected fibers more carefully. For this purpose, Zifazah allows users to impose various data encoding schemes upon data targets. Such visualization customization is done
by the UPDATE command, which always works in an immediate mode and updates the
current visualization after execution. The general UPDATE syntax pattern is:
UPDATE var1 BY var2 WITH para1, ... ,paraN IN lOUT target
where varl indicates an attribute, such as shape, color, size, depth, etc., of current vis
ual-ization to be modified, and var2 gives how the actual updating operation is to be performed in tenns of its relation to var 1. The parameter list ending the statement presents extra inf or-mation that the updating requires, as is specific to a particular data encoding operation. Like
the target specification (optional with all commands as stated before), the BY clause and
WITH clause are both optional. Table 2 lists all possible combinations of varl, var2 and associated parameter list already developed in present Zifazah. In the table, "lower, upper" gives the bound of depth mapping and "minimal,scale" indicates the minimum and the scale
of variation in size encoding. DEFAULT and RESET, when going with the verb UPDATE, act as a command for revoking all data filtering and data encoding operations respectively. The following script shows how to inspect the change of FA along fibers in a ROI by map-ping FA value to tube size, which results in a more intuitive perception of the FA variation
in that ROI.
UPDATE RESET
partialiLF =LOCATE "FA in [0.5,0.55]" OUT "ILF" UPDATE size BY FA IN "partialiLF"
Flat Control Structure
Another main design goal with Zifazah is to provide a declarative language
environ-ment for domain end users who have neither programming skills and experience, nor basic understanding of computer program structures. Consequently, we purposely eliminate the conditional and iteration stmctures from the language design of Zifazah and only keep the
most intuitive one, i.e. the sequential structure, since this simple structure is much more
intuitive than the other two. This features Zifazah with a flat control structure that is es-sential for achieving the design goal. Meanwhile, Zifazah uses high-level semantics to overcome its weakness in expressing user task requirements for lack of these two missed control structures through two approaches addressing the requirements for them.
First, requirement for an iteration structure usually stems from the needs to operate on multiple targets. In Zifazah, operation target is a common term in all syntax patterns to indicate the scope of data to focus on. I address this requirement through enumeration and
target term defaults in Zifazah syntax patterns. On the one hand, with enumeration, end
users simply list all targets in the target term to avoid iteration. For example, suppose a user intends to select three bundles and then to change size encoding for two of them; his
SELECT "CST,CC,CG"
UPDATE size BY FA IN "CST,CG"
As such, no iteration structure for looping through the multiple targets is needed. On the other hand, with tem1 default, when missing a target tem1 in a single statement, "ALL" will be assumed as a default scope, meaning the whole data model will be the target. This rule is applicable for all types of Zifazah statements, which means that target tem1 is optional in all Zifazah syntax patterns.
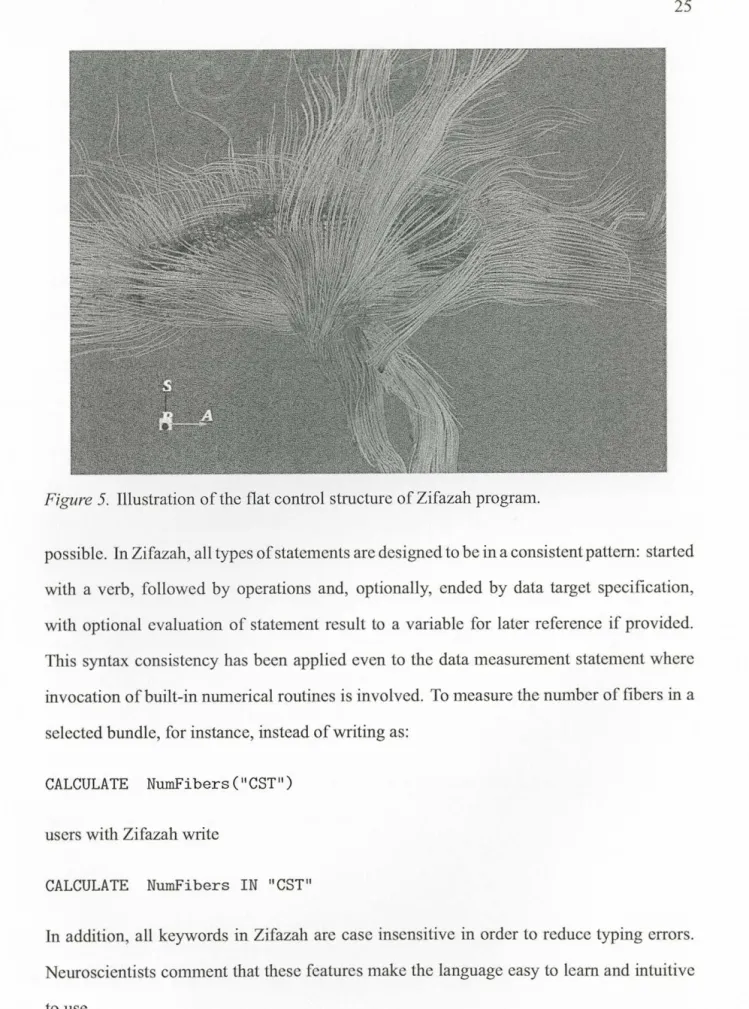
Second, requirement for a conditional structure comes from users' requests for a means to express conditional processing. For example, they often filter fibers according to FA thresholds. In Zifazah, conditional expression can be flexibly embedded in a statement to avoid this structure. It has been shown in previous examples how to embed conditional expressions in SELECT statements. For syntactic simplicity, condition is expressed in UP-DATE statements indirectly through variable reference, as the following another example snippet shows. Therein LOCATE is an alternative to SELECT but it results in a storage of the fibers filtered into a variable for later reference instead of highlighting those fibers immediately as SELECT does (see Section III for detailed language elements).
suspfibers =LOCATE "FA in [0.2,0.25]" IN "CST,ILfl' UPDATE size BY FA IN "suspfibers"
Figure 5 shows the resulting visualization.
Fully Declarative Language
Since the end users of Zifazah are medical experts who prefer natural descriptions over a programming style ofthinking according to my talks with them, elements even slightly close to those in a computer programming language have been changed to be as declarative as
Figure 5. Illustration of the flat control structure of Zifazah program.
possible. In Zifazah, all types of statements are designed to be in a consistent pattern: started
with a verb, followed by operations and, optionally, ended by data target specification, with optional evaluation of statement result to a variable for later reference if provided. This syntax consistency has been applied even to the data measurement statement where invocation of built-in numerical routines is involved. To measure the number of fibers in a
selected bundle, for instance, instead of writing as:
CALCULATE NumFibers("CST") users with Zifazah write
CALCULATE NumFibers IN "CST"
In addition, all keywords in Zifazah arc case insensitive in order to reduce typing errors. Neuroscientists comment that these features make the language easy to learn and intuitive to usc.
As exemplified above, besides visually examining the graphical representations, medi -cal experts often need to investigate the DTI data itself in a quantitative manner. In clinical
practice of neuroscientists using DTI, quantities such as average FA and number of fibers are important DTI tractography-bascd metrics for assessing cerebral white matter integrity
[15]. In fact, these metrics are usually used in our end-user description ofDTI visualizations as well. Accordingly, Zifazah provides capabilities to calculate some DTI mctrics most
fre-quently used in end users' practice of diagnosis through built-in numerical routines. The
following pattem shows the Zifazah data analysis syntax. val = CALCULATE metricRoutine INIOUT target
At the current stage of Zifazah development, metricRoutine can be one of AvgFA, AvgLA andNumFibers, whose functions have been described before. In this syntax pattern, keeping
the resulting value by evaluation is optional and sometimes useful when being referred to
afterwards (see usage scenario 3 described in Chapter V). For example, in order to sum up
fibers with average FA falling within a particular range and then figure out average LA of
the target fibers, an end user can write the following script in Zifazah:
focusFiber = LOCATE "FA >= 0.285"
CALCULATE NumFibers in "focusFiber" CALCULATE AvgFA in "focusFiber"
After running, the script above will dump results in the output window in the Zifazah pro
CHAPTER
IV
IMPLEMENTATION
Zifazah is declarative in its general fom1 with support of certain programming language
features, such as variable referencing and arithmetical and logical operations. At this early stage, the language scripts are not executed via a fully-featured interpreter or compiler but
a string-parsing-based translator of descriptive text to visualization pipeline components and manipulations upon them. The core of Zifazah is implemented on top of the Visu-alization Toolkit (VTK) using C++. The rendering engine is driven by the visualization
pipeline and legacy VTK components ranging from various geometry filters to data
map-pers. However, in order to support language features such as mixed data encoding, a group
of new pipeline components like those for view-dependent per-vertex depth value ordering
has been extended on top of related VTK classes, and many legacy VTK components have
been tailored for specific needs of visualizations in Zifazah.
In particular, the Zifazah script interpreter has also been implemented primarily as data
filters in the VTK visualization pipeline. For instance, filtering according to thresholds of
DTI metrics is developed as a set of separate VTK filters each serving a specific metTic. As
such, interpreting a Zifazah script is to translate the text, according to defined syntax and
semantics, to data transformations in the VTK pipeline. For achieving the data encoding
flexibility, multiple VTK data transfom1ation pipelines have been employed.
Additionally, the overall programming interface is implemented using Qt for C++.
In-teractions like triggering the execution of a Zifazah program, serializing and deserializing
the text script, etc. are all developed with Qt widgets, although the interactions with the visualization itself are handled using legacy VTK facilities with necessary extensions.
and "debugging" information window are dockable widgets, which facilitates the script
pro-gramming by allowing free positioning and resizing as opposed to the visualization view.
Since our language is non-programmer oriented, program debugging skills are not
ex-pected of users. Consequently, instead ofbuilding a full-blown debugging environment as
seen in almost all integrated development environments (IDEs), we simply use a dockable
output window to prompt users with all error messages caused by invalid syntax or
unrec-ognized language syn1bols. We have made use of GUI utilities of Qt for C++ to dump,
after running a script, those messages to tell what is wrong and where in natural language
descriptions with different levels of errors (fatal, warning, and notice, etc.) differentiated by different combinations of font size, type, and color of the text. Resulting values out of
running data analyzing statements are also displayed in this output window. I do not set a
separate window for displaying those numerical results in order to simplifY the
program-ming interface and, alternatively, we use remarkably disparate text background and
under-score to highlight them among other messages. Also, natural language description has been
used to present those numerical results so that they are easy to read and understand for end
CHAPTERV
USAGE SCENARIOS
In this chapter, we describe several sample tasks done by neurologists with visualiza-tions of a brain DTI model using the Zifazah language. The usage scenarios associated with the sample tasks are representative of some typical real-world visualization tasks of neuro-scientists and neurological physicians with expertise in DTI in their clinical practices. The usages range from visualization customization and exploration to DTI data analysis, cover-ing the main language features and functionalities of the current Zifazah implementation.
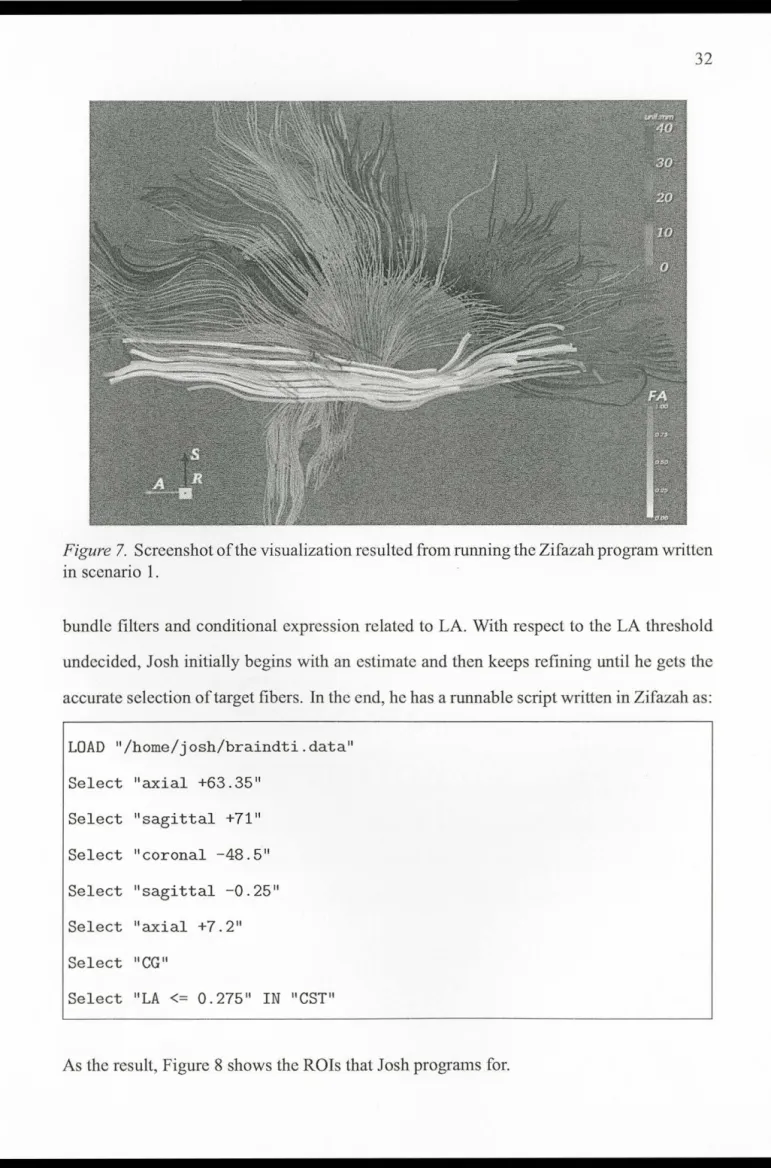
In the following scenarios, Dr. Josh M. Anderson, a vascular neurologist and an end user of Zifazah, has a geometrical model derived from a brain DT-MRI data set and wants to compose and explore visualizations of the data for diagnosis purposes. For each of the scenarios, Josh fulfills his task by programming a Zifazah script that describes his thinking process for that task and then clicks the "Run" button to execute the script. Josh programs with Zifazah syntax references showing on a help window and corrects any term that is typed incorrectly with the assistance of error messages displayed in the output window. Once the script is interpreted correctly, either the visualization is changed or numerical values appear in the output window, as the results of script execution. Scripts and running results are presented at the end of the description of each usage scenario.
Scenario 1: Composing Visualizations
To start with, Josh specifies a data file that contains the geometries of the brain DTI model using the LOAD command. By default, running this single statement gives a stream -tube visualization of the model with uniform visual encoding across all major bundles and
without depth encoding. Suspicious of the association of a known disease named Corpus-Callosum-Agenesis (CCA) with the distribution of neural pathways at the intersection of
the CC and CST bundles, Josh continues to customize the streamtube representation by
mapping FA to tube radius along each CST fiber since he is interested in the FA changes
of CST at the intersection, and encoding depth values of CC fibers to colors so that he can
easily discern the genu and splenium fibers in the CC bundle along the depth dimension in
the coronal view. Finally, Josh also wants to highlight the IFO fibers preferably represented
with ribbons. Since the IFO bundle is roughly perpendicular to the CST bundle, he likes to take it as a reference as well. To achieve this task, Josh writes the final script after error corrections as:
LOAD "/home/josh/braindti.data" Select "CC,CST,IFO"
Update size BY FA IN "CST11
Update depth BY color IN "CC" Update shape BY ribbon IN 11
IF011
The result in the visualization view is shown in Figure 7.
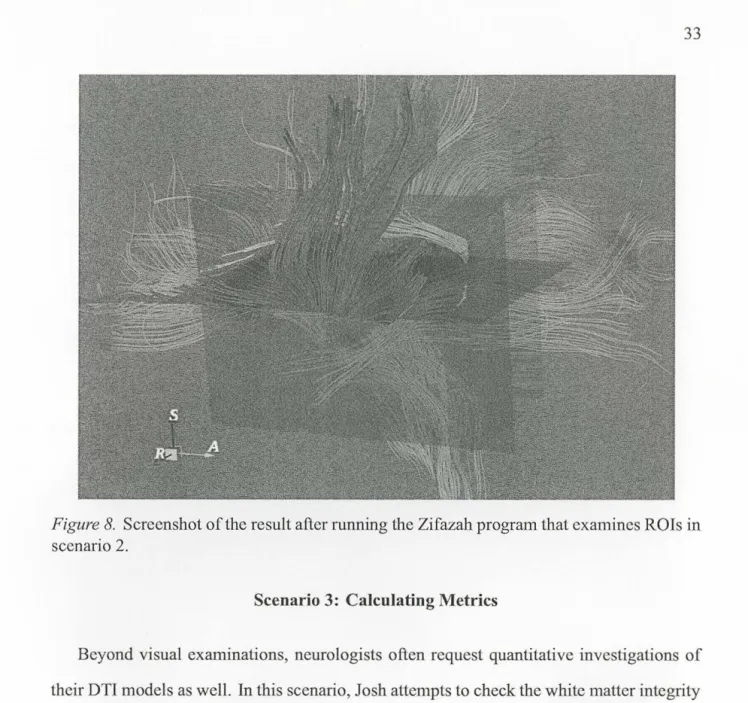
Scenario 2: Examining ROis
It is quite common for neurologists to examine particular regions of interest (ROis)
rather than the whole brain when using DTI visualizations. In this task, Josh is only
in-terested in all fibers within the temporal lobe area that belong to the CO bundle and CST
fibers in the parietal lobe area that have average LA value no larger than a threshold to be
detem1ined. The SELECT command with relative spatial operations using the anatomical planes enables Josh to precisely reach the ROis he desires. He firstly aims to filter fiber tracts outside the temporal and parietal area by adjusting the three cutting planes with rela-tive movements and then starts trying to reach the exact target fiber tracts using both fiber
Figure 7. Screenshot of the visualization resulted from running the Zifazah program written in scenario 1.
bundle filters and conditional expression related to LA. With respect to the LA threshold undecided, Josh initially begins with an estimate and then keeps refming until he gets the
accurate selection of target fibers. In the end, he has a runnable script written in Zifazah as:
LOAD "/home/ j osh/braindti. data'' Select "axial +63.35"
Select "sagittal +71"
Select "coronal -48.5"
Select "sagittal -0.25"
Select "axial +7.2"
Select "CG"
Select "LA <= 0.275" IN "CST"
Figure 8. Screenshot of the result after running the Zifazah program that examines ROis in
scenario 2.
Scenario 3: Calculating Metrics
Beyond visual examinations, neurologists often request quantitative investigations of their DTI models as well. In this scenario, Josh attempts to check the white matter integrity
in his brain model due to the limited reliability ofDTI tractography. For a rough estimation
of the integrity, he uses the CALCULATE command to retrieve the size, in terms of the
number of fibers, and average FA ofboth the whole brain and representative bundles. With
the average FA he has requested before, Josh goes further to make use of it to kick out CST
fibers with average FA below the bundle-wise average. Josh writes the following script and
obtains what he needs:
LOAD 11 /home/ j osh/braindti . data" Select "ALL"
Calculate AvgFA
cstFAavg
=
Calculate AvgFA in "CC" Calculate NumFibers in "CST"Update reset IN 11 ALL 11
Select "FA >= cstFAavg11 IN "CC"
Figure 9 shows both the numerical values computed and the updated visualization using one of the values through variable reference.
Figure 9. Screenshot of the running result of Zifazah script written for an end-user task in scenario 3.
CHAPTER VI
DISCUSSIO
N
Since our language addresses scientific visualizations and targets non-progranm1crusers,
it is designed to be fully declarative with flat control structure. While these two design f ea-tures make the language easy to usc for domain users, it can cause difficulties in debugging the script since many low-level computations and control logics behind the high-level s
yn-tax are hidden for the users. In order to minimize such drawbacks of the current Zifazah design, the script interpreter has been developed to strictly check each current statement and stop further executions of the script once current return signals abnormal behaviors, such
as importing invalid data input and referring to unknown variables.
In addition, regarding the execution mode, the current implementation of Zifazah does not follow a real-time interactive running mode by which the visualization is updated once the script changes. Instead, the progranm1ing interface requires a separate user interaction, such as clicking a button or pressing a key, for running the present script. This design is for interface simplicity and lower computational perfom1ance requirement, although a progranm1ing environment with otherwise real-time update is easy to implement.
While at the prototype stage, Zifazah is still under active development with an intention
to add more useful features to this visualization language for the purpose of better user experience and more powerful language expressiveness from end-user perspectives.
Concurrent multiple-model exploration: While exploring more than one DTI model
in order, i.e. switching data input from one to another using the LOAD command, has been supported, concurrent exploration of multiple models has not yet been implemented. How -ever, requirements for doing so do exist among our end users. As an example, one typical
case is to examine two brain models in which one is known as normal and another
suspi-cious of a brain disease. This is often seen in clinical practice since the side-by-side
com-parison is helpful for efficient recognition of cerebral anomalies or simply finding structural differences. Corresponding Zifazah commands and related other types of symbols can be extended for such concurrent explorations. Among other changes, the evaluation of LOAD statements results to an identifier (a handle, for instance) can be utilized to identify a specific
model out of multiple ones simultaneously explored.
Improved usability: Although Zifazah has been designed to be fully declarative and
many features have been developed expressly for maximum usability, such as flat control
structure and consistent syntax pattern, the usability of the overall programming
environ-ment can be further improved in two aspects. First of all, apart from a help window showing
all symbols and syntactical details, which has already been implemented, context-aware au-tomatic word completion can be built into the script editor so that users would not need to remember language keywords. Also, statement templates can be provided in the interface
so that users can program a statement simply by filling blanks followed by clicking a
but-ton to confirm (then the statement will be added into the editor). Secondly, instead of only displaying error messages after execution, highlighting error-prone words when they are
CHAPTER
VII
CONCLUSION
I have presented a visualization language for exploring 3D DTI visualizations and de-scribed the design principles and language features of it derived from end-user descriptions
about how to customize and explore such visualizations. I have already developed some
functions and features carefully selected for the proposed language, Zifazah, and described the elements of the language. A primary design goal with Zifazah is to initiate a scientific visualization language that is non-programmer oriented, especially for domain scientists
who have no programming experience and skill to create and explore in their own visu
al-izations. For this purpose, I have emphasized design features of Zifazah that particularly support the design goals.
I have also described representative usage scenarios of Zifazah apart from many
exam-ple scripts written in the language before presenting its main content. These scenarios show that the new language is appealing to domain users, and it is promising to further develop the prototype towards a more capable and usable language for exploring more scientific visualizations.
While the development of the language as a whole is still at its early stage, the language core has already been implemented and more features are being extended on top of the current design. Among many possible directions to follow, I briefly discussed two main prospective features to follow up. With Zifazah I have presented a new approach, i.e. the end-user programming approach, to exploring DTI visualizations in 3D environment.
REFERENCES
[1] Impure: A new visualization programming language for non-programmers. http: I /www.
impure . com/.
[2] Processing.js. http: I /processingj s. org/.
[3] Trevil-tree visualization language. http: I /sape. inf. usi. ch/tools/trevil.
[ 4] The vedea project. http://blogs.msdn.com/b/martinca/archive/2009/12/03/
introducing-the-microsoft-visualization-language.aspx.
[5] Andrea Adamoli and Matthias Hauswirth. Trevis: A context tree visualization & analysis
framework and its use for classifying performance failure reports. In ACM Symposium on Software Visualization, pages 73-82, October 2010.
[6] David Akers. Cinch: a cooperatively designed marking interface for 3d pathway selection. In
Proceedings of the 19th annual ACM symposium on User interface software and technology, pages 33-42, New York, NY, USA, 2006.
[7] David Akers, N. Gluhbegovich, and J. Jew. Wizard of oz for participatory design: Inventing a
gestural interface for 3d selection of neural pathway estimates. In SIGCHI Works in Progress.
ACM Press, 2006.
[8] Peter J. Basser, Sinisa Pajevic, Carlo Pierpaoli, Jeffrey Duda, and Akram Aldroubi. In vivo
fiber tractography using DT-MRI data. Magnetic Resonance in Medicine, 44:625-632, 2000.
[9] J. Bertin. Semiology of graphics: diagrams, networks, maps. University of Wisconsin Press,
1983.
[1 0] J. Blaas, C. P. Botha, B. Peters, F. M. Vos, and F. II. Post. Fast and reproducible fiber bundle
[11] Coyne Bob and Sproat Richard. Wordseye: an automatic text-to-scene conversion system. In
Proceedings of ACM SIGGRAPH, pages 487-496, New York, NY, USA, 2001.
[12] M. Bostock and J. Heer. Protovis: A graphical toolkit for visualization. IEEE Transactions on
Visualization and Computer Graphics, pages 1121-1128, 2009.
[13] Mike Bostock. Data-driven documents. http: I /mbostock.gi thub. com/d3/.
[14] Olston Christopher, Reed Benjamin, Srivastava Utkarsh, Kumar Ravi, and Tomkins Andrew. Pig latin: a not-so-foreign language for data processing. In Proceedings of the ACM SIGMOD
international conference on Management of data, pages 1099-1110, New York, NY, USA,
2008.
[15] S. Correia, S. Y. Lee, T. Voom, D. F. Tate, R. H. Paul, S. Zhang, S. P. Salloway, P. F. Malloy, and
D. H. Laidlaw. Quantitative tractography metrics of white matter integrity in diffusion-tensor
mri. Neuroimage, 42(2):568-581, 2008.
[16] N. Elmqvist and P. Tsigas. A taxonomy of3d occlusion management for visualization. IEEE
Transactions on Visualization and Computer Graphics, pages 1095-1109, 2008.
[17] 8. J. Fry. Computational information design. Ph.D. dissertation, Massachusetts Instit~ute of
Technology, 2004.
[18] J. Heer and M. Bostock. Declarative language design for interactive visualization. IEEE
Transactions on Visualization and Computer Graphics, 16(6):1149-1156, 2010.
[19] Radu Jianu, Cagatay Demiralp, and David H. Laidlaw. Exploring 3D DTI fiber-tracts with
linked 2D representations. IEEE Transactions on Visualization and Computer Graphics,
15(6):1449-1456, 2009.
[20] Gordon Kindlmann. Visualization and analysis of diffusion tensor fields. Ph.D. dissertation,
The University ofUtah, 2004.
[21] Gordon Kindlmann, David Weinstein, and David Hart. Strategies for direct volume rendering
of diffusion tensor fields. IEEE Transactions on Visualization and Computer Graphics, pages