Modelling text meta-properties in
automated text scoring for non-native
English writing
Meng Zhang
Churchill College
Abstract
Automated text scoring (ATS) is the task of automatically scoring a text based on some given grading criteria. This thesis focuses on ATS in the context of free-text writing exams aimed at learners of English as a foreign language (EFL). The benefit of an ATS system is primarily to provide instant and consistent feedback to language learners, and service reliability also forms a crucial part of an ATS system. Based on previous work, we investigated only partially explored meta-properties in text and integrated them into a machine learning based ATS model across multiple datasets:
• In most previous work, the proposed models implicitly assume that texts produced by learners in an exam are written independently. However, this is not true for the exams where learners are required to compose multiple texts. We hence explicitly instructed our model which texts are written by the same learner, which boosts model performance in most cases.
• We used three intra-exam properties within the same exam including prompt, genre and task as a starting point, and we showed that explicitly modelling these properties via frustratingly easy domain adaptation (FEDA) (Daume III, 2007) can positively affect model performance in some cases. Furthermore, modelling multiple intra-exam properties together is better than modelling any single property individually or no property in four out of five test sets.
• We studied how to utilise and combine learners’ responses from multiple writing exams. We also proposed a new variant of the transfer-learning ATS model which mitigates the drawbacks of previous work. This variant first builds a ranking model across multiple datasets via FEDA, and the ranking score of each text predicted by the ranking model is used as an extra feature in the baseline model. This variants gives improvement compared to a baseline model on the development sets in terms of root-mean-square error. Furthermore, the transfer-learning model utilising multiple datasets tuned on each development set is always better than the baseline model on the corresponding test set.
• We found that different datasets favour different meta properties. We therefore combined all the models looking at different meta properties together using
ensemble learning. Compared to the baseline model, the combined model has a statistically significant improvement on all the test sets in terms of root-mean-square error based on a permutation test.
Declaration
This dissertation is the result of my own work and includes nothing which is the outcome of work done in collaboration except as declared in the Preface and specified in the text. It is not substantially the same as any that I have submitted, or am concurrently submitting, for a degree or diploma or other qualification at the University of Cambridge or any other University or similar institution except as declared in the Preface and specified in the text. I further state that no substantial part of my dissertation has already been submitted, or is being concurrently submitted, for any such degree, diploma or other qualification at the University of Cambridge or any other University or similar institution except as declared in the Preface and specified in the text. This dissertation does not exceed the prescribed limit of 60 000 words.
Meng Zhang May, 2018
Acknowledgements
This thesis is supported by the institute for Automated Language Teaching and Assess-ment (ALTA) funded by Cambridge AssessAssess-ment. I want to acknowledge Cambridge Assessment for the generosity in funding and providing the research data for this thesis. I also want to thank Churchill College and the computer science department for their financial support to conference attendance.
I would like to express my gratitude to my supervisor Ted Briscoe for providing this opportunity to conduct my PhD research in Cambridge. Thanks for your supervision and support for my research.
Next, I would like to appreciate my examiners Paula Buttery and Andreas Vlachos. The quality of this thesis got improved a lot because of the valuable discussion with you during my viva.
I then would like to thank Meichen Lu, Christopher Bryant, Mariano Felice, Ronan Cummins, Yimai Fang, Helen Yannakoudakis and Øistein Andersen for the constructive feedback at different stages. Thank you for helping me make this thesis better.
Finally, I would not have finished this journey without the support from my family and all my friends mentioned and not mentioned in this thesis. You are my heroes in my life.
Contents
1 Introduction 21
1.1 Meta Properties . . . 22
1.2 Research Questions . . . 24
1.3 Thesis Structure and Contributions . . . 24
2 Background 27 2.1 Learner Corpora . . . 27
2.1.1 English Native Speaker Corpora . . . 28
2.1.2 EFL Corpora . . . 29
2.1.2.1 English Exams from Cambridge Assessment . . . 30
2.1.2.2 Product Categories . . . 31
2.2 Machine Learning . . . 32
2.3 Supervised Learning . . . 34
2.3.1 Linear Regression . . . 34
2.3.2 Support Vector Machines . . . 35
2.3.3 SVM Pairwise Ranking . . . 39
2.3.4 Support Vector Regression . . . 40
2.4 Related Work in ATS . . . 41
2.5 Methods Differentiating Data with Different Meta-Properties . . . 47
2.5.1 Overview . . . 48
2.5.2 Related Methods . . . 48
2.5.3 Distinguishing Attributes in ATS . . . 51
2.6 Evaluation . . . 52
3 Datasets and Baseline 57 3.1 Exams . . . 57
3.1.1 KET . . . 58
3.1.2 PET . . . 58
3.1.3 FCE . . . 59
3.1.5 IELTS . . . 59
3.2 Grading Criteria . . . 60
3.3 Dataset Preparation for Each Exam . . . 60
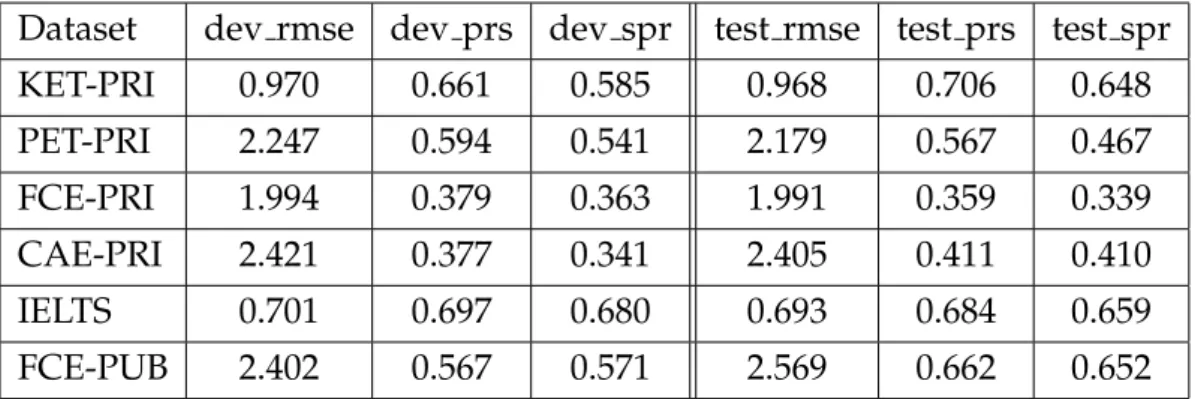
3.3.1 Scores . . . 61 3.4 Baseline Model . . . 62 3.4.1 Notation . . . 62 3.4.2 Features . . . 62 3.4.3 Models . . . 64 3.4.4 Benchmark . . . 64 3.5 Results . . . 66 3.6 Summary . . . 67
4 Multi-Source Scoring by Bringing Authorship Knowledge 69 4.1 Introduction . . . 69 4.2 Datasets . . . 70 4.3 Notation . . . 71 4.4 Assumptions . . . 72 4.5 Model Fusion . . . 73 4.5.1 What to Fuse . . . 75
4.5.2 Alternative View: Structural Probabilistic Models . . . 75
4.6 Results and Discussion . . . 75
4.6.1 Fusion Hyper-parameters . . . 78
4.6.2 Score Difference . . . 78
4.7 Analysis of Text Length . . . 81
4.7.1 Bringing Features from Different Responses . . . 83
4.8 Summary . . . 87
5 Multi-Domain Scoring within the Same Exam 89 5.1 Introduction . . . 89
5.2 Attributes . . . 90
5.2.1 Annotation . . . 91
5.3 Multi-Domain Learning . . . 94
5.3.1 Frustratingly Easy Domain Adaptation . . . 96
5.3.2 From Attributes to Domains . . . 97
5.3.3 Multi-Attribute Multi-Domain Learning . . . 98
5.3.4 Weighted FEDA . . . 100
5.3.5 Relation between W-FEDA and Other Types of Multi-Domain Learning Methods . . . 101
5.4.1 Weighted FEDA on Single Attribute . . . 103
5.4.2 Model Inspection . . . 106
5.4.3 Multiple Attributes versus Best Single Attribute . . . 109
5.4.4 Comparison between W-FEDA and U-FEDA . . . 110
5.4.4.1 Single Attribute . . . 110
5.4.4.2 Multiple Attributes . . . 114
5.5 Combined Model based on Authorship Knowledge and Intra-Exam Properties . . . 116
5.6 Discussion . . . 118
5.7 Summary . . . 120
6 Automated Scoring across Different Exams by Transfer Learning 123 6.1 Introduction . . . 123
6.2 Models . . . 124
6.2.1 Two-Stage Model . . . 124
6.2.1.1 Cummins et al.’s Model . . . 125
6.2.1.2 Two-Stage Feature-Rich Model . . . 126
6.3 Transfer-Learning Techniques . . . 127
6.3.1 W-FEDA . . . 127
6.3.2 Instance Weighting . . . 128
6.4 Implementation . . . 129
6.4.1 Baseline Models Trained on One Dataset . . . 129
6.4.2 Transfer-Learning Models Trained on Multiple Datasets . . . 130
6.5 Results . . . 130
6.5.1 Baselines . . . 131
6.5.2 Transfer-Learning Models . . . 134
6.5.3 Test sets . . . 136
6.6 Summary . . . 141
7 Jointly Modelling all Meta Properties 143 7.1 Select Inputs for Ensemble Learning . . . 143
7.2 Results . . . 144
7.3 Summary . . . 147
8 Conclusions 149 8.1 Future Work . . . 150
B Example Prompts of the FCE-PUB dataset 157
B.1 First Prompt of 0102 2002 6.xml . . . 157 B.2 First Prompt of 0102 2001 3.xml . . . 158
List of Figures
1.1 Meta properties of a learner’s text . . . 24
2.1 Illustration of SVMs . . . 36
2.2 Illustration of SVR . . . 40
3.1 Interpretation between each exam to its CEFR level . . . 58
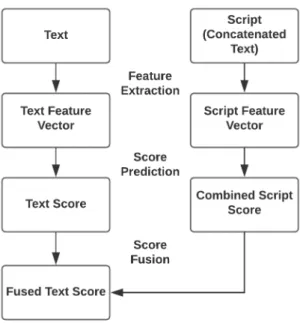
4.1 Score fusion between a text written by a learner and its corresponding script (concatenated text). . . 73
4.2 Feature fusion between a text written a learner and its corresponding script (concatenated text). . . 74
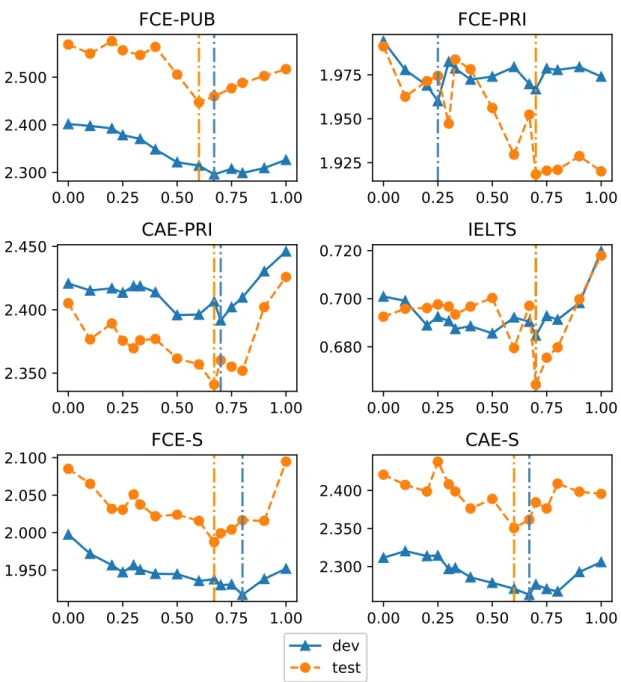
4.3 How RMSE changes withβin FF-CT. . . 79
4.4 How RMSE changes withβin FF-NT. . . 80
4.5 Illustration of halving a dataset and applying FF-NT to the halved dataset. 83 4.6 Illustration of halving a dataset and applying FF-NT to the halved dataset via cross concatenation. . . 84
5.1 An example prompt for the first task (data summarisation) in the IELTS academic exam . . . 92
5.2 An example prompt for the second task (essay) in the IELTS academic exam 92 5.3 An example prompt for the first task (letter) in the IELTS general exam . 93 5.4 An example prompt for the second task (essay) in the IELTS general exam 93 5.5 Example prompts from FCE-PUB in one exam session. . . 95
5.6 Prompt distribution in each dataset. . . 99
5.7 Illustration of multiple attribute FEDA. . . 100
5.8 Example answer to P1, receiving a score of 5 out of 5. . . 107
5.9 Example answer to P1, receiving a score of 5 out of 5. . . 108
5.10 First prompt from 0102 2001 3.xml of the FCE-PUB dataset. . . 119
5.11 First prompt from 0100 2001 6.xml of the FCE-PUB dataset. . . 119
5.12 Third prompt from 0102 2001 6.xml of the FCE-PUB dataset. . . 120
List of Tables
3.1 Score mapping for the FCE-PUB dataset. . . 61 3.2 Statistics of each dataset. . . 62 3.3 Comparison of previous work and our baseline models for the FCE-PUB
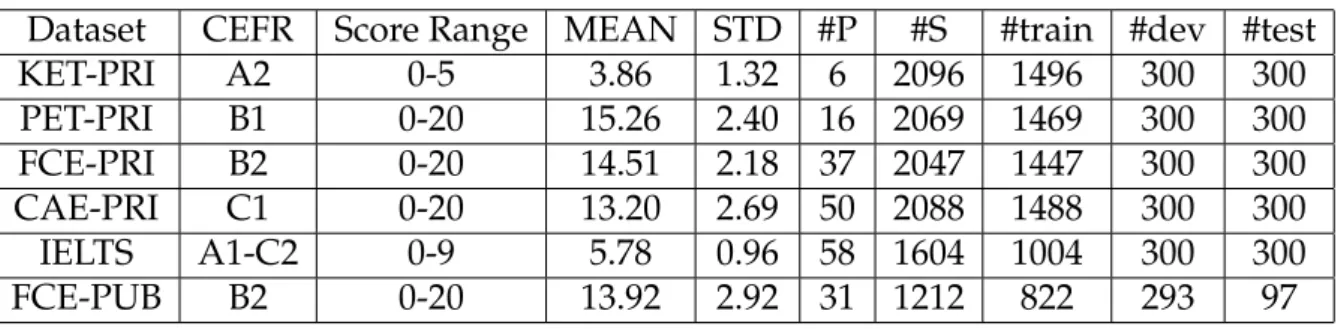
test set on the overall level. . . 65 3.4 Results of the baseline model for each dataset on the individual level. . . 66 4.1 Details of the six datasets used in Chapter 4. . . 71 4.2 Relation betweenTT1andTT2to check how the scores of the first and
second text written by each learner are correlated. . . 72 4.3 Results of different setups in Chapter 4. . . 76 4.4 p-value for each approach estimated by the Wilcoxon signed-rank test
across all the six datasets in Chapter 4. . . 77 4.5 Pearson correlation between performance difference PDm,j and script
score differencesdm,jon the development sets. . . 81 4.6 Pearson correlation between performance difference PDm,j and script
score differencesdm,jon the test sets. . . 81
4.7 Results for each halved dataset without/with authorship knowledge added. The numbers highlighted are the best numbers in each dataset. . 82 4.8 Comparison between cross-concatenated and non-cross concatenated
methods for the FCE-PUB, FCE-PRI and CAE-PRI halved test sets. . . . 85 4.9 Comparison between cross-concatenated and non-cross concatenated
methods for the IELTS, FCE-S and CAE-S halved test sets. . . 86 5.1 Distribution of attributes in each dataset. . . 94 5.2 W-FEDA on each single attribute in each dataset. . . 104 5.3 Word feature weights for the prompt-expanded model on the KET-PRI
dataset. . . 107 5.4 Feature weights learned for the POS trigram TO VV0 NP1 in the KET-PRI
dataset. . . 107 5.5 Feature weights learned for the trigram missing rate estimated on the
5.6 Trigram missing rate for each genre in the IELTS training set. . . 109 5.7 Feature weights learned for the word count of a learner’s text . . . 109 5.8 W-FEDA on multiple attributes, compared to W-FEDA on single attributes
and training a single baseline grader. . . 111 5.9 Comparison between U-FEDA and W-FEDA on the test sets. . . 113 5.10 Distribution of performance differences between W-FEDA and U-FEDA
on the test sets for each single attribute. . . 114 5.11 Distribution of W (W-FEDA) and U (U-FEDA) relative to the baseline on
the test sets. . . 114 5.12 W-FEDA and U-FEDA on multiple attributes. . . 115 5.13 Distribution of the performance difference between W-FEDA and U-FEDA
on the test sets on all available attributes. . . 115 5.14 Distribution of the performance differences of W-FEDA and U-FEDA
relative to the baseline on the test sets. . . 116 5.15 Results of combining the feature fusion and multi-domain learning
methods based on multiple attributes together on the test sets. . . 117 6.1 Results of different setups on the KET-PRI, PET-PRI and FCE-PRI
devel-opment sets. . . 132 6.2 Results of different setups on the CAE-PRI, IELTS and FCE-PUB
develop-ment sets. . . 133 6.3 p-value for each approach estimated by the Wilcoxon signed-rank test
across all the six development sets in Chapter 6 . . . 134 6.4 Distribution of how many times each approach achieving the best
perfor-mance on each metric across all the six development sets. . . 135 6.5 Reduced distribution of how many times each approach achieving the
best performance on each metric across all the six development sets. . . 135 6.6 Selected marking criteria for the CAE, FCE and KET exams. . . 137 6.7 Three baselines without using extra data and the transfer-learning models
achieving the lowest RMSE on the development sets. . . 138 6.8 p-value for each approach estimated by the Wilcoxon signed-rank test
across all the six test sets in Chapter 6. . . 139 6.9 Distribution of how many times each approach achieves the best
perfor-mance on each metric across all the six test sets. . . 139 6.10 Performance drop on each test set for the ranking W-FEDA model without
target dataset in the training set, compared to the baseline model. . . 140 7.1 Intra-exam properties to conduct W-FEDA for each dataset in this chapter.144
7.2 Results of different setups from Chapter 4 to 6 and ensemble learning on different datasets. . . 145 7.3 Interpolation weights of ensemble learning (Table 7.2) for each dataset.
Chapter 1
Introduction
The English language is one of the most commonly spoken languages in the world. Based on a report published by the British Council1, there are about 1.75 billion people who can speak English at a useful level. It is also estimated by the report that the number of English speakers will rise to two billion in 2020. English is also the most widely learned foreign language chosen by the people all around the world. For example, about 97.3% pupils studied English as a foreign language in the European Union (Eurostat, 2017). Besides that, the popularity of learning English is also visible in the number of non-native English speakers taking different English exams. Based on another report from the British Council2, more than two million International English Language Testing System
(IELTS) tests were taken in 2012-2013. The existence of various English exam products provides a useful and fair way for learners to measure their English skills accurately. It also offers a well-accepted standard to help schools, companies and immigration bureaux to quantitatively judge whether the foreign candidates and applicants who are non-native English speakers meet the compulsory language requirements they set up. To thoroughly and objectively evaluate a learner’s English skills from multiple dimensions, some educational organisations like Cambridge Assessment and Educa-tional Testing Service (ETS) propose different types of questions and practices in their English exam products. These questions and practices include not only multiple-choice, true-or-false and fill-in-the-blank style questions, but also more advanced questions such as free-text writing. This variety helps learners identify what they are good at and what their weaknesses are. It also gives them opportunities to practise their English in different ways.
Although the desire to learn English might be high, the hurdle to mastering it is not negligible. One existing barrier is that for some areas, there are not enough human examiners who can objectively evaluate learners’ writing quality. While it is relatively
1https://www.britishcouncil.org/sites/default/files/english-effect-report-v2.pdf 2https://www.britishcouncil.org/organisation/press/record-two-million-ielts-tests
easy to judge the correctness of a multiple-choice question or a true-or-false question if we know what the gold standard is, it requires much more skill to appropriately assess the quality of free-text writing. The lack of professional and qualified examiners makes it hard for learners to get accurate feedback on the quality of their English writing in a timely fashion. Consequently, it is hoped that an automated text scoring (ATS) system can possibly act as a kind of examiner to mitigate this problem, which offers an assistance to both learners and educators.
The main goal of ATS is to automatically evaluate the quality of a person’s writing in terms of specific grading criteria. The earliest research into ATS dates back to the 1960s (Page, 1968). It is also hoped that automated assessment will improve consistency and provide assistance in learning and teaching. The application of this technique not only frees educators from the burden of manually marking piles of texts, but also provides learners with instant feedback for iterative writing improvement. The ATS technique is often used as the second marker in high-stakes exams such as e-rater in the Graduate Management Admission Test (GMAT) (Burstein et al., 1998), the Test of English as a Foreign Language (TOEFL) (Chodorow and Burstein, 2004) and the Graduate Record Examinations (GRE) (Ramineni et al., 2012). ATS also acts as the only grader in low-stakes exams and online tutoring applications such as Cambridge English Write & Improve (Andersen et al., 2013) and Turnitin3.
1.1
Meta Properties
The performance of an ATS system directly determines the success of the automated assessment application. Previous work has approached ATS from different aspects including simple features such as word counts (Page, 1968), semantic similarity (Foltz et al., 1999), prompt relevance (Higgins et al., 2006; Briscoe et al., 2010; Cummins et al., 2016a), syntactic complexity (Yannakoudakis et al., 2011), coherence (Higgins and Burstein, 2007; Yannakoudakis and Briscoe, 2012), discourse relations (Lin et al., 2011; Feng et al., 2014; Song et al., 2017) and argument structure (Klebanov et al., 2016; Wachsmuth et al., 2017). One aspect not fully studied is whether and how the meta properties of a learner’s text affect ATS. In this section, we describe how we classify the meta properties of a text into different categories for the research of this thesis.
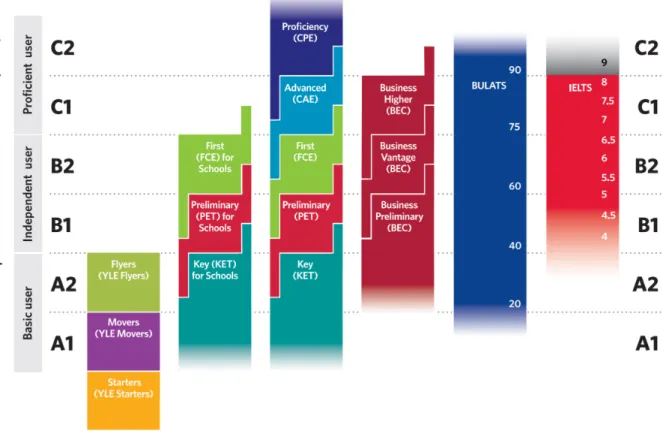
When an educational organisation designs an exam product, they do so with specific goals and philosophy in mind. For example, some exams are designed to gauge which proficiency level a learner has mastered, while others aim to test whether a learner has fulfilled the requirements for a specific level. In order to benchmark learners’ English skills, the Common European Framework of Reference for Languages (CEFR) provides
a common basis to assess language skills in European countries (Council of Europe, 2001). CEFR provides a range of proficiency levels to measure at what stage learners have mastered a specific language. The proposed proficiency is divided into six levels:
• A. Basic User: – A1 (Breakthrough) – A2 (Waystage) • B. Independent User: – B1 (Threshold) – B2 (Vantage) • C. Proficient User:
– C1 (Effective Operational Proficiency)
– C2 (Mastery)
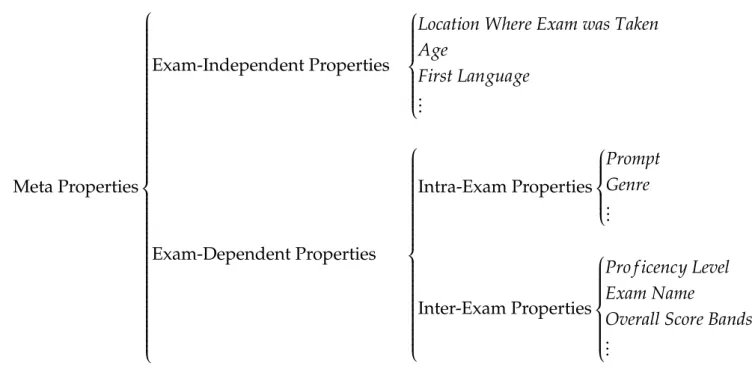
Based on this summary, the IELTS exam is designed to examine which CEFR level learners have achieved. In comparison, some exams like the Cambridge English First (FCE) and Advanced (CAE) exams examine whether participants have mastered a specific CEFR level (B2/C1) or not. Once the ultimate goals and philosophy of an exam product are determined, all the free-text writing questions within the same exam should share the same broad level goals and values on meta properties such as target proficiency level. We define these meta properties asthe intra-exam properties.
After the goals of the whole exam are decided, the examiners need to design the questions for the exam, and each question has its own focal points. For example, some questions require learners to write an essay, while others ask learners to describe a figure or a picture. Herein, each question also has its own goals, and so we define the meta properties that distinguish a question from other questions within the same exam asthe inter-exam properties.
When the exam organisation publishes their exam products, learners can then register to take the exams they want. Other meta properties that distinguish different writing could be but not limited to participant gender, native language and age. We define the meta properties which are independent of an exam but characterised by the external properties of participants or the environment where participants take the exam as the exam-independent properties. In contrast, we put the intra-exam and inter-exam properties under a broader term together asthe exam-dependent properties. The values of the exam-dependent properties of a text rely solely on the exam product, while the exam-independent properties are independent of the exam, the designers of
the exam and the questions in the exam. For example, two responses to the same prompt in the same exam can have different values for these exam-independent properties, but they must have the same value on any exam-dependent property. The relations between these meta properties are shown in Figure 1.1.
Meta Properties Exam-Independent Properties
Location Where Exam was Taken Age First Language ... Exam-Dependent Properties Intra-Exam Properties Prompt Genre ... Inter-Exam Properties
Pro f icency Level Exam Name
Overall Score Bands
...
Figure 1.1: Meta properties of a learner’s text
1.2
Research Questions
Obviously, some meta properties we list here affect and determine the grading criterion of a text, and explicitly differentiating meta-proprieties of different texts in an ATS system might be beneficial in improving system performance. It is always crucial to provide learners with accurate feedback regarding their writing quality. This thesis focuses on meta properties that have not been thoroughly examined in previous work. Specifically, we try to determine how text meta properties can be used in an ATS system. We also intend to investigate whether adding and explicitly modelling these meta properties can improve ATS system performance or not.
1.3
Thesis Structure and Contributions
The remainder of this thesis is structured:
• Chapter 3 describes how we prepare the datasets and baseline model for this thesis. We prepared six different datasets and extended the model proposed by Yannakoudakis et al. (2011). Based on the experimental results in this chapter, we chose the support vector regression model as the baseline model in the following chapters.
Chapters 4 to 6 take a closer look at three types of meta properties in ATS. The contents and the major contributions of each chapter are listed as follows:
• Chapter 4 focuses on the authorship knowledge of a text to study the exam-independent property in this chapter. In some English writing exams, learners are required to write texts to multiple free-text writing tasks. Previous work has implicitly assumed that all texts are composed independently and so ignores the fact that some texts are actually composed by the same learner in a single exam session. We define this information as the authorship knowledge of a text. In this chapter, we proposed two approaches to explicitly pass this knowledge to the baseline model by means of feature fusion and score fusion. The benefit of doing this is to add more connections among the training data so that the model can better understand a learner’s writing skills. We experimentally demonstrated that model performance improves in most cases, and that this improvement is irrespective of human examiners’ bias of knowing the authorship of each text even if this bias might exist.
• Chapter 5 looks at the intra-exam properties of a text. In this chapter, we examined three properties including prompt, genre and task as a starting point. We experimentally demonstrated that modelling these properties via frustratingly easy domain adaptation (FEDA) (Daume III, 2007) improves our grader performance on some datasets.
• Chapter 6 investigates the modelling of the inter-exam properties of a text. Par-ticularly, we distinguished which exam each dataset comes from and studied whether utilising multiple datasets is better than building a grader from only a single dataset.
In this chapter, we proposed a variant based on the model from Cummins et al. (2016b). They built a pairwise ranking model based on FEDA across multiple datasets and predicted a ranking scorefor each text, and they then used a linear regression model to map the outputs of the ranking model back to the original scores for each exam. We found that their model performed worse than the baseline model in terms of root-mean-square error on some development sets. To overcome this problem, we used the predicted ranking score of each text as an
extra feature and fed it back to the baseline model in Chapter 3. Compared to the other models evaluated in this thesis, this variant gets the best performance on four out of six development sets in terms of the root-mean-squared error.
Finally, the best-performing transfer-learning model utilising multiple datasets tuned on each development set is always better than the baseline model in Chapter 3 on the corresponding test set.
As we found that different datasets benefit from different meta properties proposed in Chapter 4 to Chapter 6, in Chapter 7, we jointly modelled all the meta properties together via ensemble learning. Compared to the baseline model in Chapter 3, the combined model has a statistically significant improvement on all the test sets in terms of root-mean-square error based on the permutation test.
Finally, Chapter 8 draws the conclusions and identifies possible future work for this thesis.
Chapter 2
Background
This chapter summarises the datasets and techniques that have been used in ATS. A more comprehensive survey can be found in Shermis and Burstein (2003); Valenti et al. (2003); Shermis and Burstein (2013); Burrows et al. (2015).
2.1
Learner Corpora
It is difficult to conduct research into ATS without a suitable learner corpus. A good learner corpus is required to provide an opportunity for us to conduct quantitative analyses and test assumptions about ATS. The quality of this corpus directly determines the quality of our work/research/models. In this section, we introduce several learner corpora that have been used for various purposes in previous work. The corpora not covered in this section can be found in the surveys written by Pravec (2002); Granger (2004); Nesselhauf (2004). A comprehensive list of learner corpora is available on the website of the Univerist´e catholique de Louvain.1
Many datasets have been created by different researchers and organisations. Building a learner corpus has substantially benefited various natural language processing tasks including:
• first language identification (Gebre et al., 2013; Tetreault et al., 2013, 2012; Brooke and Hirst, 2012; Kochmar, 2011; Koppel et al., 2005);
• grammatical error detection and correction (Ji et al., 2017; Yuan, 2017; Chollampatt et al., 2016; Herbelot and Kochmar, 2016; Rei et al., 2016; Yuan et al., 2016; Susanto et al., 2015; Kochmar, 2016; Andersen, 2011; De Felice and Pulman, 2009, 2008);
• grammatical error correction evaluation (Felice et al., 2016; Bryant and Felice, 2016; Napoles et al., 2016; Felice and Briscoe, 2015; Dahlmeier and Ng, 2012);
• artificial grammatical error generation (Felice, 2016; Felice and Yuan, 2014; Foster and Andersen, 2009);
• part-of-speech (POS) tagging and parsing of texts written by learners of English as a foreign language (EFL) (Berzak et al., 2016);
• analysing the similarity between learners’ first languages via their second language writing patterns (Berzak et al., 2015, 2014);
• ATS, which is the topic of this dissertation.
These corpora can be characterised by several other criteria. For example:
• the medium in which the learners’ responses are collected (hand-written or computer-typed);
• the learners’ first languages (English, Chinese, German);
• the text type (narrative, discussion, exams, assignments);
• the learners’ proficiency levels (beginning, intermediate or advanced);
• whether the corpus is publicly available or has limited access.
In this thesis, we are primarily interested in learners’ abilities in written English. One way to classify these corpora is based on whether the learners’ first language is English or not.
2.1.1
English Native Speaker Corpora
One of the most well-known publicly-available corpora for English native speakers is the Automated Student Assessment Prize (ASAP) dataset.2 The William and Flora
Hewlett Foundation (Hewlett) organised a shared task on ATS in 2013. In this shared task, Hewlett gathered about twenty thousand texts from eight different prompts. The essays were written by students in Grade 7 to Grade 10 in the United States, and each essay is between 150 to 550 words, depending upon the requirement of each prompt. The dataset has been used in previous work in ATS (Chen and He, 2013; Phandi et al., 2015; Alikaniotis et al., 2016; Cummins et al., 2016b; Taghipour and Ng, 2016; Dong and Zhang, 2016; Dong et al., 2017; Tay et al., 2018; Cozma et al., 2018).
2.1.2
EFL Corpora
In this dissertation, we are more interested in EFL learners corpora, as human examiners who can objectively assess learners’ writing are hard to access for EFL learners in some areas. That said, the research outcome from this dissertation should also be of benefit to ATS for native speakers even if we only use the EFL learners corpora to conduct our research. In this section, we introduce several EFL corpora and identify whether they are suitable for our research into ATS in this dissertation.
The International Corpus of Learner English (ICLE) (Granger et al., 2002) is one of the biggest and earliest corpora built for essays written by EFL learners. The first and second versions were released in 2002 and 2009, respectively. The second version contains argumentative essays and literature examination papers with 3.7 million words written by intermediate and advanced learners. There are sixteen different first language backgrounds for these learners including Bulgarian, Chinese, Czech, Dutch, Finnish, French, German, Italian, Japanese, Norwegian, Polish, Russian, Spanish, Swedish, Tswana and Turkish.3 Each essay contains 500-1000 words. Data collection involved the
collaboration of a group of participating universities. In this corpus, only prompts were controlled by Granger et al., and other factors were left to the participating universities to decide. For example, different students wrote texts in different environments and it is unclear whether they used dictionaries and grammar books or not. Although the second version of the corpus included meta-data such as gender, first, second or even third language, it did not contain any scores indicating the quality of each essay. Persing et al. consequently marked a sample of essays from this corpus based on organisation (Persing et al., 2010), thesis clarity (Persing and Ng, 2013), prompt adherence (Persing and Ng, 2014) and argument strength (Persing and Ng, 2015).
The National University of Singapore Corpus of Learner English (NUCLE) was created by Dahlmeier et al. (2013). It contains 1,400 essays with one million words written by students from the National University of Singapore on different topics. All the essays were annotated with error tags and corrections by well-trained English instructors, although the essays themselves are not marked with any grading criterion. Consequently, NUCLE is not directly suitable for research in ATS. Many corpora share the same problem that they are not marked based on any grading criteria such as the Langman Learner’s Corpus (LLC) (Gillard and Gadsby, 1998) and the Uppsala Student English (USE) corpus (Axelsson, 2000).
The Cambridge Learner Corpus (CLC) has been developed through a collaboration between Cambridge University Press (CUP) and Cambridge Assessment English since 1993 (Nicholls, 2003). The CLC contains 52.5 million words (16 million in 2003) written by non-native English learners in different types of exams. Each text was marked with
a score based on the grading criterion of the corresponding exam. The 2003 version has 86 different first languages, and the 350,000-word subset of the corpus is further annotated with 80 different error codes. Although access to the full CLC is restricted by CUP and its collaborators, a subset is publicly available. Specifically, the FCE public (FCE-PUB) dataset was released by Yannakoudakis et al. (2011). This dataset contains the writing sections from 1,141 exam papers answered by 1,141 learners in the year 2000 and 103 exam papers written by 103 learners in 2001.
TOEFL11 (Blanchard et al., 2013) are the essays collected from the Test of English as a Foreign Language (TOEFL) organised by the Educational Testing Service. This dataset was originally collected and prepared for the purpose of native language identification, but it can also be used in other research projects in education. It contains 12,100 essays with 11 different first languages, evenly sampled, including Arabic, Chinese, French, German, Hindi, Italian, Japanese, Korean, Spanish, Telugu and Turkish. Each essay in this dataset was marked with one out of three different levels (low/medium/high). Blanchard et al. pointed out one difference between the FCE-PUB public dataset and TOEFL11 is that the FCE-PUB dataset has a broader range of prompts available.
2.1.2.1 English Exams from Cambridge Assessment
In this dissertation, we use learners’ data collected from the English exam products designed by Cambridge Assessment. There are several advantages of using the Cambridge Assessment exams to conduct our research.
An advantage of the English exam products made by Cambridge Assessment is that the marking scheme and quality of each Cambridge English exam is strictly controlled (Ffrench et al., 2012). In particular, all examiners need to complete a training class and pass a qualification assessment in order to be qualified to assess learners’ writings. Next, during the marking procedure, the performance of each examiner is monitored and regularly reviewed by senior examiners to ensure that the scores assigned by examiners accurately reflect the writing ability of each learner. This monitoring procedure also provides instant feedback to examiners concerning their scoring performance. which ensures the quality of the dataset we use in this thesis.
In fact, such strict control is not only applied to the marking procedure but also to the environment in which learners compose and finish their writing. For instance, unlike in ICLE, the academic writing and general writing tasks in IELTS must be strictly completed within one hour.4 This guarantees that learners taking exams in different locations are all overseen and examined under the same conditions.
Another benefit of Cambridge English exams is that participating learners have different first languages, and they come from a variety of countries and cultures.
The CLC, for example, has collected responses from learners with 86 different first languages (Nicholls, 2003). This diversity can help us ensure the robustness of the automated grader we build. In other words, the grader is trained to capture the linguistic competency of each learner, regardless of their first language or cultural background. Also, different English exams in the CLC target learners of different CEFR levels, so we can investigate how the target proficiency level of an exam affects automated assessment. In contrast to the ICLE and TOEFL11 corpora, there are also different types/genres of text in each exam, and, similarly, this can be used to evaluate the robustness of the automated grader.
Our work is an extension of the previous work done by Briscoe et al. (2010); Yannakoudakis et al. (2011); Yannakoudakis and Briscoe (2012) (to be described in Section 2.4), who evaluated their approach on the same subset of the CLC. A common problem in ATS is that different approaches are not evaluated on the same dataset. For example, although some ATS systems (Page and Petersen, 1995; Cozma et al., 2018) have achieved reasonably good performance and even outperformed human annotation agreement on some datasets it is actually hard to interpret which system is better, because they all evaluated on their own private datasets. Hence, to benchmark with previous work, we hence test our hypotheses on the same CLC subset released by Yannakoudakis et al. (2011).
Finally, the CLC is the biggest dataset our research group can access. Due to licensing issues, many corpora such as the Hong Kong University of Science and Technology (HKUST) corpus (Milton and Chowdhury, 1994) are unobtainable. In contrast, our research partner Cambridge Assessment is willing to share their dataset to test our assumptions and methods in this thesis.
2.1.2.2 Product Categories
The products of Cambridge English exams can be classified into the following categories:
• The main suite consists of a series of exams including Key English Test (KET), Preliminary English Test (PET), First Certificate of English (FCE), Certificate of Advanced English (CAE) and Certificate of Proficiency in English (CPE). These exams target learners with different CEFR language proficiency levels;
• The business suite (BEC) focuses on business English (e.g. business preliminary, business vantage and business higher) with different CEFR language proficiency levels;
• The universal exams without a target proficiency level include the International English Language Teaching System (IELTS) and the Business Language Testing Service (BULATS).
All the Cambridge English exams have writing sections to examine and gauge learners’ writing abilities. The writing sections in the main suite and business suite are designed to target specific proficiency levels. In contrast, the universal exams do not target a specific proficiency level. In this thesis, we investigate the exams in the main suite and IELTS. We will describe the exams and their corresponding datasets in more detail in Chapter 3.
2.2
Machine Learning
Most previous work into ATS relies on machine learning to model the relationship between texts and scores (Page, 1968; Larkey, 1998; Yigal and Burstein, 2006; Yan-nakoudakis, 2013; Zesch et al., 2015; Dong and Zhang, 2016; Taghipour and Ng, 2016; Tay et al., 2018). In this section, we introduce several machine learning models used in ATS. More details about different machine learning techniques can be found in the textbooks and surveys of Mitchell (1997); Bishop (2006); Murphy (2012); Goodfellow et al. (2016). The aim of machine learning is to implement a system capable of learning from an experience related to a task to improve the system performance in this task based on a performance measure (Mitchell, 1997).
There are several tasks in machine learning, one of which issupervised learning. In supervised learning, the system learns a function f that predicts output yi ∈Ygiven
inputxi ∈Xwithout explicit human instructions. In automated assessment, the output
could be a scalaryi, which is the score of the text marked by a human examiner, or a vectoryi, which represents different aspects of the quality of a text. In this thesis, we
assume each output is a scalaryi. The inputxiis a text written by a learner. This learning process requires an annotated dataset, a machine learning model and an appropriate optimisation method to learn the relationship between the input and output space. In automated assessment, the annotated dataset consists of a collection of texts with scores marked by human examiners; we define this dataset as thetraining set{x}trainin
supervised learning. The procedure for the system to learn this relationship is called
training. The machine learning model can only read data in a specific format, and the
process that maps each text to a model-readable format is defined asfeature extraction. The format of the model-readable data ofxicould hence be a vectorxwith sizeD:
xi =<xi,1,xi,2, . . . ,xi,D >
It could also be a sequence of vectors or other possible forms depending on how the model is designed. During training, we want the predictions ˆyi made by the model on the inputxito be as close as possible to the gold score yi. We therefore need some
performance measuresPto quantitatively describe this closeness, and the model should be optimised on a pre-defined target function which reflects the performance measure we are interested in. In other words,Pshould ideally get better when we are optimising the pre-defined target function.
After we train a model, we need to ensure the model performs well on future unseen data. To evaluate future performance, we reserve an annotated dataset and evaluate the trained model on this held-out dataset. This procedure is calledtesting, and the unseen annotated dataset{x}test used in testing is thetest set. The format of the training and
test sets should be the same, and they should both have been marked and annotated by human examiners.
In order to optimise on the performance measure P, we need to define some configurational parameters before training. Compared to the parameters of the model directly learned during the training process, these configurational parameters cannot be directly learned from the training process. These configurational parameters are called
the hyper-parametersof the model. The hyper-parameters of a model could be the
parameters controlling the complexity of the parameters learned by the model including the regularisation term, the learning rate of the optimisation method, or the time when we stop training the model. During training, when deciding appropriate values for hyper-parameters, we can tune the model on a development set, which is another annotated dataset following the same annotation procedure as the training and test sets. We use the optimal hyper-parameters on the development set in the trained model we evaluate on the test set. This hyper-parameters tuning process is calledvalidation.
In contrast to supervised learning, unsupervised learning does not involve any annotated dataset but identifies the pattern and structure of some unannotated data that might be useful for some downstream tasks. At the intersection of supervised learning and unsupervised learning issemi-supervised learning. Semi-supervised utilises both labelled and unlabelled data instances to learn the relation between the input spaceX
and the output spaceY. Only limited work (Chen et al., 2010) in automated assessment
studied unsupervised learning.5 Most previous work in this field relies on supervised
learning (Page, 1968; Larkey, 1998; Briscoe et al., 2010; Yannakoudakis, 2013). Our work in the following chapters is also based on supervised learning because the patterns learned from unsupervised learning might not capture the patterns to predict the scores we are interested in. For this reason, we focus on supervised learning in this thesis.
5Although Chen et al. (2010) did not explicitly use essay scores in training their model; their work still needs some supervised signals, such as knowing the historical score distribution so that they knew the number of unique terms in each essay has a strong correlation with the essay scores in their dataset.
2.3
Supervised Learning
Generally speaking, three different board supervised learning methods that have previously been applied to automated assessment include regression, classification and ranking. In regression, the model predicts a score on a continuous scale, while in classification, it predicts a label from a finite set. For example, it would be a regression task to predict the amount of rainfall on a particular day, but a classification task to predict whether it will rain or not. This latter case is a binary-classification task. In contrast, a ranking model aims to determine the order of a set of inputs. For example, we can rank essays from best to worst based on overall quality.
In this section, we will describe several machine learning models used in automated assessment, which cover the necessary knowledge required to understand the techniques relevant to this dissertation.
2.3.1
Linear Regression
We start with the simplest regression model: linear regression. Linear regression is a regression technique. It assumes that given a data set{(xi,yi)}N
i=1ofNinstances, the input
spaceXand the output spaceYform a linear relationship. The prediction function f for
a given data instancexi ∈RD is defined as follows:
f(xi;w,b)=wTxi+b= yiˆ (2.1)
ˆ
yi is the value predicted by f forxi;w∈RD andb∈Rare the model parameters to
be learned in training. During training, the target function we would like to optimise can be described in Equation 2.2:
min
w,b Cost(w,b)=Error( ˆy,y)+λReg(w,b) (2.2) The first term Error( ˆy,y) in this equation means that we want to minimise the error between the predictions ˆy and gold labels y. Some common metrics quantifying
Error( ˆy,y) include the mean-squared error (L2 error):
ErrorL2( ˆy,y)= 1 N N X i=1 ( ˆyi−yi)2 (2.3)
and the mean-absolute error (L1 error):
ErrorL1( ˆy,y)= 1 N N X i=1 |yiˆ −yi| (2.4)
The second term in the target function Equation 2.2 is the regularisation term that simplifies the model complexity. After training, we expect the model not only to correctly mark texts in the training set, but also to accurately predict scores for unseen data instances. In other words, rather than merely memorising and overfitting the seen data, we want the model to generalise well on the unseen data. Adding a regularisation termλReg(w,b) into the target function can hence avoid the model overfitting to the noise in the training set. λis the hyper-parameter to balance the contribution between the error term and the regularisation term in the target function. Commonly used regularisation terms include the L2 penalty:
RegL2(w,b)=||w||22+b2 =
D
X
d=1
w2d+b2 (2.5)
and the L1 penalty:
RegL1(w,b)=||w||1+|b|=
D
X
d=1
|wd|+|b| (2.6)
The target function Equation 2.2 can be optimised by different approaches, the most well-known of which is gradient descent. In this approach, at each iteration, we calculate the partial derivatives of the parameterswandbover the target functionCost(w,b) with
∂Cost ∂w and ∂
Cost
∂b . We then update each parameter by adding its negative partial derivative:
w:=w−η∂Cost(w,b)
∂w
b:=b−η∂Cost(w,b)
∂b
(2.7)
ηis the learning rate hyper-parameter to be configured before we start to train the model. We repeat this procedure until w and b converge. It has been proven that gradient descent always converges to the global minimum if the target function is strictly convex and the learning rateηis appropriately chosen (Boyd and Vandenberghe, 2004). More advanced optimisation methods are also available, but they are not the focus of this dissertation so we refer the reader to Goodfellow et al. (2016); Boyd and Vandenberghe (2004) for more information.
2.3.2
Support Vector Machines
The support vector machine (SVM) is a popular machine learning technique proposed by Cortes and Vapnik (1995) used for classification. It has shown good performance in a wide variety of natural language processing tasks (Joachims, 1998b). The explanation in
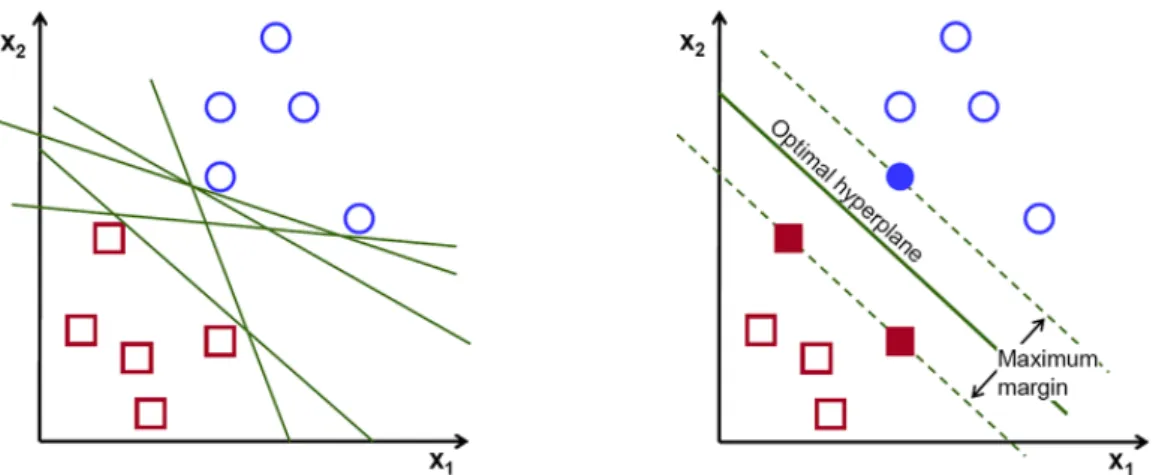
Figure 2.1: SVM hyperplanes that separate blue and red points. Left: some valid hyperplanes separating the given points; Right: the optimal-hyperplane found by the SVM which maximises the distance (margin) between the two dashed hyperplanes bounding the blue and red points, respectively.
this section can be found in the notes written by Ng6.
An SVM model is a maximum-margin classifier. In order to explain the intuition behind maximum margin, let us start with binary classification. In Figure 2.17, givenN
points{(x1,y1), . . . ,(xN,yN)}, we are asked to find a (green) boundary to separate these
Npositive and blue (y=1) and negative and red (y=−1) points. This hyperplane can
be described by the set of pointsxsatisfying the following equation:
wTx+b=0 (2.8)
In the SVM, it is assumed that the ideal boundary we are looking for should maximally separate the positive and negative data instances. If the data points are linearly separable by the ideal boundary, there should exist another two hyperplanes (the two green dashed lines in Figure 2.1) in parallel to the ideal boundary. Each dashed hyperplane bounds all the points from the same category. The distance between these two dashed hyperplanes is called the margin in the SVM, and the ideal hyperplane lies halfway between these two dashed hyperplanes. The data points (the red and bluesolidpoints) lying on the two dashed hyperplanes are the support vectors. The two dashed hyperplanes can respectively be described by the equations
wTx+b=−1 (2.9)
and
wTx+b= +1 (2.10)
6http://cs229.stanford.edu/notes/cs229-notes3.pdf
In order to maximise the margin between the two hyperplanes||w2||, we can reformulate
this problem as:
min w,b 1 2||w|| 2 subject toyi(wTxi+b)≥1∀i∈1, . . . ,N (2.11)
This is a quadratic convex optimisation problem that can be solved using existing optimisation methods such as the ellipsoid method (Gr ¨otschel et al., 2012, p.64).
So far, we have assumed that the points from negative and positive classes are linearly separable. In order to make the algorithm work in the non-linearly separable case and also more robust to the outliers in data, we add a slack variableξifor each data
instance (xi,yi) as:
ξi =max(0,1−yi(wTxi−b)) (2.12)
and we reformulate the minimisation problem in the following way:
min w,ξ C N X i=1 ξi+ 1 2||w|| 2 subject to yi(wTxi+b)≥1−ξi ∀i∈1, . . . ,N ξi ≥0,∀i∈1, . . . ,N (2.13)
Cis the hyper-parameter to balance the degree of error we can tolerate and how much sacrifice we can accept if the margin found by the model becomes smaller. This is similar to the hyper-parameter controlling the regularisation term in linear regression (Equation 2.2).
The optimisation problem we are solving now is defined as theprimal optimisation problem. In contrast, we can also turn the SVM optimisation into a dual problem. Solving the dual problem can help us know the contribution of each data instance in deciding the final learned hyperplane in the SVM model. For Equation 2.13, we first wrap the target function we are minimising and the constraints together intoL(w,b,ξ,a,r) (the generalised Lagarangian) by the Lagrange multiplier:
L(w,b,ξ,a,r)= 1 2w Tw+ C N X i=1 ξi− N X i=1 αi[yi(xTiw+b)−1+ξi]− N X i=1 riξi (2.14)
Here we define: f0(w,ξ)≡ 1 2w Tw+C N X i=1 ξi (2.15) fiα(w,b, ξi)≡ −[yi(xTi w+b)−1+ξi] (2.16) fir(ξi)≡ −ξi (2.17)
We representθprimal(w,b,ξ) as maxα,r:α,r0L(w,b,ξ,a,r), and minw,b,ξθprimal(w,b,ξ) is
equivalent to the primal optimisation problem in Equation 2.13:
p∗=min
w,b,ξθprimal(w,b,ξ)=minw,b,ξ α,rmax:α,r0L(w,b,ξ,a,r) (2.18)
If we swap the minimum-maximum order in this equation, we get thedual optimisation problemmaxα,r:α,r0θdual(α,r):
d∗ = max
α,r:α,r0θdual(α,r)
≡ max
α,r:α,r0minw,b,ξL(w,b,ξ,α,r) (2.19)
The solution to the dual (maximisation) problemd∗
is the lower bound to the solution of the primal (minimisation) problemp∗
:
d∗≤p∗ (2.20)
Based on the Slater condition (Slater, 1959), the lower bound provided by the dual problem is exactly the optimal solution for the primal problem, because f0, fiαand firare
all convex functions. Moreover, the optimal solutionsw∗
,b∗
,ξ∗
,α∗
andr∗
should satisfy the Karush-Kuhn-Tucker (KKT) conditions (Karush, 1939; Kuhn and Tucker, 1951):
∂ ∂wiL(w ∗ ,b∗,ξ∗,α∗,r∗)=0, i=1, . . . ,N ∂ ∂ξi L(w∗,b∗,ξ∗,α∗,r∗)=0, i=1, . . . ,N ∂ ∂bL(w ∗ ,b∗,ξ∗,α∗,r∗)=0 a∗ifiα(w∗,b∗, ξ∗i)=0, i=1, . . . ,N r∗i fir(ξi∗)=0, i=1, . . . ,N fiα(w∗,b∗, ξ∗i)≤0, i=1, . . . ,N fir(ξ∗i)≤0, i=1, . . . ,N α∗ i ≥0, i=1, . . . ,N r∗i ≥0, i=1, . . . ,N (2.21)
Based on the KKT conditions, we can substitutew,b,ξandrbyαand further turn maxα,r:α,r0θdual(α,r) into the following form:
max α W(α)= N X i=1 αi− 1 2 N X i,j=1 yiyjαiαjK(xi,xj) subject to 0≤αi ≤C∀i∈1, . . . ,N PN i=1αiyi =0 (2.22)
whereK(xi,xj) is the kernel function that encodes the relationship between xi andxj.
More specifically,K(xi,xj) is the inner product between vectorsxi andxjifKis a linear
kernel. We can also use other kernels such as a polynomial or radial basis function kernel to mapxinto a non-linear space, which might improve the model’s capability of capturing more useful patterns in classification and handling of cases when data are not linearly separable.
By treating the primal problem as a dual problem, it becomes easier and faster to do non-linear transformations on theXspace by applying different kernels including the
radial basis function and polynomial kernels. In addition, some optimisation methods such as sequential minimal optimisation (Platt, 1998) and tricks such as heuristic shrinkage (Joachims, 1998a) can accelerate the convergence rate and reduce the memory usage of SVMs. Besides that, by combining the primal and dual optimisation problems together, Hsieh et al. (2008) further speeds up SVMs by the dual coordinate descent method based on the linear kernel.
2.3.3
SVM Pairwise Ranking
An easy approach to solve a ranking problem by SVMs is Ranking SVM (Joachims, 2002). This method treats ranking as a pairwise ranking problem. In this problem, we haveNtexts, andris the set of all the pairs of textsxi andxjwherexireceives a higher score thanxj has. The model needs to correctly decide which text should get a higher score in each pair of texts. We can apply the binary classification framework used in the SVM to solve the ranking problem based on a linear kernel by:
min w,ξ C X (xi,xj)∈r ξi,j+ 1 2||w|| 2 subject to wT(x i−xj)≥1−ξi,j ∀(xi,xj)∈r ξi,j ≥0,∀(xi,xj)∈r (2.23)
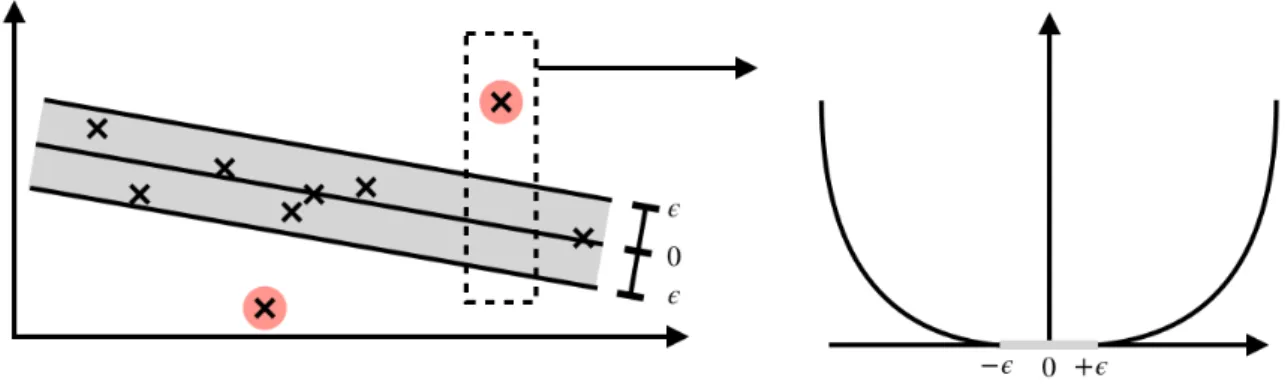
Figure 2.2: Illustration of SVR. Left figure: The black boundaries of the grey region represent the upper and lower boundaries of SVR. The scores of the points in the grey area can be correctly predicted by SVR, and the score errors predicted by the SVR model for the points outside of the grey region are zero (Equation 2.24). Right figure: the error function of L2 loss in SVR.
The number of constraints is twice the size of all the possible pairsr, and we can use the same optimisation strategy used in the SVM to learn the model optimal parameters asw∗.
During prediction, given a dataset{xi}N
i=1, we calculate the ranking score ˆy
rank
i for each
data instancexibyw∗·
xi, and the rank of{xi}Ni=1is sorted based on{yiˆ}Ni=1. The ranking
problem is also solvable in the dual form in the SVM with different kernels other than the linear kernel.
2.3.4
Support Vector Regression
For the target function of linear regression model described in Equation 2.2, we can see that the regression problem can actually be fitted into the SVM framework in Equation 2.13 as support vector regression (SVR) (Vapnik, 1999; Smola and Sch ¨olkopf, 2004), because both equations contain the error and regularisation terms to be minimised. Based on the optimisation problem for the SVM in Equation 2.13, the regression problem based on a linear kernel is formulated by adding the error constraints in both directions with L2 loss by:
min w,b,ξupper,ξlower C N X i=1 ((ξupperi )2+(ξloweri )2)+ 1 2||w|| 2 subject to yi−wTx i−b≤+ξ upper i wTx i+b−yi ≤+ξloweri ξupper i , ξ lower i ≥0 ∀i∈1, . . . ,N (2.24)
whereCis the cost hyper-parameter, andis the hyper-parameter controlling the margin of tolerance where no penalty is given to errors. ξupperi andξlower
i describe how
much error the model makes onxi in terms of the upper and lower boundaries in the
SVR (Figure 2.2). Similarly to the SVM, this regression problem can still be converted to its dual form so that we can find the support vectors of SVR. After we find the optimal parameters w∗ and b∗
during training, we can easily do prediction for an incoming instancexi as ˆyi =w∗·xi+b∗
.
2.4
Related Work in ATS
Many researchers have studied different aspects of ATS Some work focus on scoring on different types of texts including short text (Leacock and Chodorow, 2003b; Sukkarieh et al., 2003; Pulman and Sukkarieh, 2005; Mohler et al., 2011; Tack et al., 2017), narra-tion (Somasundaran et al., 2015, 2018), academic writing (Yang et al., 2018) and essay scoring. Automated essay scoring could be further split into non-English (Ishioka and Kameda, 2006; ¨Ostling et al., 2013; Horbach et al., 2017) and English essay scoring. Researchers approach English essay scoring from rule-based approaches (Mitchell et al., 2002) and different machine learning approaches including regression (Page, 1968, 2003; Burstein, 2003; Cozma et al., 2018), classification (Larkey, 1998; Rudner and Liang, 2002; Ros´e et al., 2003; Coniam, 2009) and ranking (Briscoe et al., 2010; Yannakoudakis et al., 2011; Chen and He, 2013) based models. More recent work focus on neural network without handle crafted feature engineering but innovation on model structure (Alikan-iotis et al., 2016; Taghipour and Ng, 2016; Dong and Zhang, 2016; Dong et al., 2017; Tay et al., 2018). Other aspects have been addressed in ATS including spelling and grammatical errors (Leacock and Chodorow, 2003a; Han et al., 2006; Tetreault and Chodorow, 2008), semantics (Rehder et al., 1998; Lonsdale and Strong-Krause, 2003), coherence (Miltsakaki and Kukich, 2000, 2004; Higgins and Burstein, 2007; Burstein et al., 2010; Yannakoudakis and Briscoe, 2012; Burstein et al., 2013; Somasundaran et al., 2014), discourse (Burstein et al., 2001; Lin et al., 2011; Feng et al., 2014; Song et al., 2017), argu-mentation (Persing and Ng, 2015; Ghosh et al., 2016; Klebanov et al., 2016; Wachsmuth et al., 2017), prompt (Higgins et al., 2006; Persing and Ng, 2014; Cummins et al., 2016a; Rei, 2017), clarity (Persing and Ng, 2013), structure (Somasundaran et al., 2016; Persing et al., 2010), sentence parallelism (Song et al., 2016), question difficulty (Pado, 2017), non-English response detection (Yoon and Higgins, 2011), utilising data from different sources (Phandi et al., 2015; Cummins et al., 2016b) and evaluation (Williamson, 2009; Yannakoudakis and Cummins, 2015). In this section, we describe several influential approaches in this field. For more detailed reviews of ATS, see Shermis and Burstein (2003); Valenti et al. (2003); P´erez-Mar´ın et al. (2009); Shermis and Burstein (2013);
Burrows et al. (2015).
Page is one of the pioneers of ATS research. The Project Essay Grade (PEG) (Page, 1968, 1994; Page and Petersen, 1995; Page, 2003) built by his team was the first attempt at building an ATS system. In the original paper (Page, 1968), Page claimed that the writing quality of an essay could be measured by different observable attributes. He proposed several features to approximate these attributes, which he namedproxes. The proxes used in his system include:
• word count;
• the number of pronouns, POS tags, punctuation marks and paragraphs;
• word length describing the complexity of word usage;
• the presence of a title
Linear regression was used to learn the relationship between essays and scores.
Page’s original work in the 1960s was not widely used because computer usage availability was minimal at the time, and Page needed to hire staffto transcribe texts from paper to tape and punched cards so that a computer could directly handle and read these texts (Page, 2003). This problem did not change until the 1990s when more families could afford and access computers. This not only encouraged more researchers to work on ATS, but also made it easier to build larger learner corpora and apply more advanced technology in ATS. For example, Shermis et al. (2001) added a web interface to PEG to make it easier and faster to collect learners’ texts for further research, and Page (2003) added more features including different dictionaries and parsers. PEG was evaluated on 1,314 essays provided by the Educational Testing Service (ETS) from the Praxis test to assess applicants for teacher certifications. The average correlation between the system and human judge was 0.742, even higher than the average inter-annotator correlation 0.646 (Page and Petersen, 1995).
In terms of the real-world application of ATS systems, Kukich (2000) pointed out two problems that have discouraged people from using ATS systems. One problem is that these systems are relatively easy to fool. Specifically, since longer essays tend to get higher scores, learners could cheat simply by writing more words. Another more crucial problem is that people think these proxes do not capture other critical writing features including content, organisation and style. It may be artificial to emphasise the ability to score highly on an ATS system, when this might not correlate with the ability to plan, compose and reorganise high-quality texts in different conditions and circumstances.
To make an ATS system work better, different researchers have approached this problem from various angles. For example, Larkey (1998) brought classification approaches to ATS to add extra features to the regression model. He used the naive
Bayes classifier (Maron, 1961) to predict whether an incoming essay was good or bad, and the k-nearest-neighbour classifier (Altman, 1992) to gauge the similarity between the incoming essay and all the low-quality and well-written essays in the training set. For naive Bayes, he built several classifiers, one for each level band. Each classifier was used to predict the probability that the grade of an incoming essay was higher or lower than the given level band. Compared to the Project Essay Grade, Larkey also injected more lexical information into his ATS system via his classification models. A bag of stemmed words was used to represent the features of each essay in naive Bayes. For the k-nearest-neighbour classifier, they encoded each essay via its word occurrence weighted by term-frequency inverse-document-frequency (Sp¨arck Jones, 1972). Finally, a linear regression grader with low variance features filtered was built to predict essay scores based on the outputs from the naive Bayes, the k-nearest-neighbour classifier and extra features measuring the length statistics of characters, words and sentences, and word varieties in each essay. The grader was trained and tested on five different datasets separately from social studies, physics, law and two general college exams, and Larkey experimentally showed that the classification models with lexical information could boost ATS system performance based on text-complexity features such as word length and the number of sentences in one essay.
Rudner and Liang (2002) treated ATS as a classification task as well. Their system, the Bayesian Essay Test Scoring sYstem (BETSY), was based on the multivariate Bernoulli model (McCallum and Nigam, 1998) and the multinomial naive Bayes model to classify a given essay with an appropriate grade. The features they used include the word unigram and bigram counts in each essay. They conducted their research on the responses to a biology exam for the Maryland High School Assessment. The best combination of model, features and feature selection method achieved 80% accuracy. One potential problem with their approach was that it ignored the order among different level bands. For example, given the three levels 1, 2 and 3 in a grading criterion, the classification method they used did not know that score 3 is better than 2 and 1, and 2 is better than 1. This is different from Larkey (1998)’s work, which preserved the order between bands. Furthermore, the likelihoods from Larkey’s classifiers were also used as features in a regression model, which further preserved the difference between bands. Further experiments in Briscoe et al. (2010) also showed that the ranking and regression approaches outperformed treating ATS as an unordered classification task such as naive Bayes and maximum entropy classification.
Foltz et al. (1999) built their ATS grader to mark essays. Their product Intelligent Essay Assessor (IEA) mainly used the features from the following five categories:
• content (essay semantic similarity and vector length based on latent semantic analysis);
• lexical sophistication (word variety and confusable words);
• mechanics (punctuation, spelling and capitalisation);
• grammar (n-gram features, grammatical errors and grammar error types);
• style, organisation and development (sentence-sentence coherence, overall essay coherence and topic development)
Unlike the work we have discussed so far, they started to emphasise the importance of content using latent semantic analysis (LSA) (Deerwester et al., 1990; Laham and Landauer, 1998; Landauer et al., 1998). For LSA, they trained a semantic model from a large domain-specific background corpus. The texts from this corpus were similar to the reading materials read by the learners who participated in their exams. LSA builds a co-occurrence matrixAfor the background corpus, in which the rows and columns represent the words and the paragraphs in the corpus, respectively. Elementai jin the matrixAdescribes whether wordiappears in paragraph jof the background corpus or not. The truncated singular-value decomposition is then applied to compress the matrix to a smaller one.
To use LSA to mark a text submitted by a learner, they treated each text as a bag of words (Harris, 1954), in which each text was a vector and each element of that vector was a word count. The bag of words vector for each text was then mapped to the latent space. They then calculated the cosine similarity between the model answers and learners’ responses to represent the similarity of the conceptual content. For each learner’s essay, they selected the topKgraded essays with the highest cosine similarity as the learner’s essay, and gave the learner’s essay a score equal to the average of these topKessay grades. In subsequent work, they found that the length of the LSA vector strongly correlated with the essay scores (Rehder et al., 1998). In addition to semantic features, Foltz et al. (1998) used coherence features which were calculated from the average similarity of adjacent sentences in learners’ texts according to LSA. Although they claimed other types of features, such as the strength of introduction, arguments and conclusion, were also used in their system, they did not disclose how these features were extracted and used in ATS.
The Educational Testing Service (ETS) developed their ATS system e-rater and deployed it to score high-stakes assessments including Graduate Record Examinations (GRE) and TOEFL (Burstein, 2003; Attali and Burstein, 2004). E-rater has several sub-systems that extract features from each text. The outputs from these sub-sub-systems are then combined together. They grouped their features into the following categories:
• grammatical errors;