13. Performance Management
13.1 Introduction
13.1.1 This chapter sets out how the Council will ensure that it delivers the outcomes of its second Local Transport Plan. Appropriate indicators and targets are identified that will demonstrate progress towards meeting the overall LTP2 objectives and delivering our investment priorities. This chapter describes the processes that have been put in place to monitor progress and performance. It goes on to describe the indicators that have been identified to monitor
performance and concludes with a detailed description of the derivation of each target, and the actions required by the Council and its partners to achieve the target and to manage risk.
13.2 Corporate Performance Management
113.2.1 Our corporate planning processes are the method by which we plan effectively for the future and ensure that we use our resources to maximum effect for local people. In order to do this we need to be clear about what we can achieve, know when we achieve it and take any action needed if things are not on track. Our corporate planning, performance and financial
processes provides a framework to make sure that we:
• Work with our partners to deliver the City’s shared vision • Set clear priorities for achieving this vision
• Set ourselves clear and challenging targets to help us achieve the vision • Identify resources to achieve the Council’s priorities and goals
• Learn from our customers, partners and staff in our drive for continuous improvement
• Integrate all elements of the Council’s planning processes to ensure links between service and
financial planning
• Take account of national and local influences for change
• Identify risk and introduce management measures to reduce or eliminate the risk
13.2.2 Our planning is informed through consultation with the community and our partners and the outcomes of consultation are considered during the annual planning cycle.
13.2.3 The Corporate Performance Management Framework provides a common ‘thread’ that draws together implementation of the Medium Term Financial Plan (MTFP) and the People Strategy. It ensures that the City Strategy goals for Plymouth are linked via the City Council’s Corporate Plan priorities to Service Plans, such as the Local Transport Plan and the performance of service managers. Moreover it clarifies the contribution that each council officer can make to achieve the city vision.
13.2.3 The Council has put in place a performance management system that allows every level of the Performance Framework to be monitored against targets that have been set by members, officers and other stakeholders. Information is available on-line and is constantly updated by officers responsible for individual targets and activities. The system has been in place for 3 years and is progressively being updated to provide reporting across all services. It provides information on Best Value Performance Indicators (BVPI’s), Comprehensive Performance Assessment (CPA) indicators and local indicators established within each service area. It provides a “traffic light” system of green, amber and red to highlight those indicators that are on track and those where performance is either better or worse than the target / trajectory. The following screen shots give examples of the Council’s on-line reporting system. The first shows a “dashboard” or scorecard for a single indicator, whilst the second shows an overview of indicators for use by senior management in performance monitoring across a service area.
1
Figure 13.1: Performance Management ‘Dashboard’ Screenshot
Figure 13.2: Performance Management Screenshot
13.2.4. The Council’s management team and Cabinet receive quarterly progress reports of the Corporate Plan, Improvement and Best Value targets, indicating when key milestones have been achieved. The Resources and Performance Overview and Scrutiny Panel receives performance information on a similar basis and analyses trends, receives updates on slippage and makes recommendations to the Cabinet if Members believe that action should be taken. 13.2.5 The Performance Management Framework will provide an essential tool for ongoing
monitoring of the LTP2 indicators. This means that rather than monitoring performance as an annual activity, monitoring will take place, where appropriate at least quarterly so that prior
areas can assist in performance against the Local Transport Plan indicators and also where transport interventions can contribute to the Councils’ corporate performance. This alignment of the LTP with the City Strategy and thematic strategies extends beyond the City Council through the alignment of other delivery agencies via the Local Strategic Partnership.
13.3 Comprehensive Performance Assessment (CPA)
13.3.1 The Audit Commission has proposed that an authority's approach to transport, informed by LTP assessment, will feature significantly in the corporate part of the CPA from 2005. Since the City Council’s CPA in 2002, significant progress has been made in addressing a range of key areas for improvement. The table below illustrates the progress made between the Council’s CPA in 2002 and its assessment in December 2004.
Table 13.1: Audit Commission Comparison
Audit Commission Findings in 2002 Audit Commission Findings in 2004
Political and managerial leadership is lacking capacity ‘at the highest level’
Political and managerial leadership is strong: ‘significant improvements’ have been made in the management of the Council over the last year’
The Council ‘lacks strategic vision’ The Council has ‘clear vision and ambition’ Overall focus of the Council ‘is weak’ The Leader and Chief Executive have
‘dramatically increased’ focus
Ambitions are set too low ‘There are realistic long term ambitions that people recognise’
The Council is unclear about its priorities The Council is clear about its priorities 13.3.2 Under the CPA arrangements the Council is required to report on a number of key
performance indicators, known as mandatory indicators. Furthermore, the Audit Commission has established “rule-bound” indicators for which the Council is required to achieve a set performance level. For transport the only such indicator is:
• Non-intervention by the Secretary of State under the Traffic Management Act 2004
13.4 Performance in the Transport Service
LTP1 Performance Summary
13.4.1 We have improved our LTP performance from weak (42%) in 2002/03 to fair (67%) in 2004/05 as shown in the table below.
Table 13.2: APR Rating Comparison
13.4.2 Following the weak 2002/03 APR, during 2004 the Council, in addition to 7 other local authorities, participated in the Department for Transport ‘Working With Weaker Local Authorities’ (WWLA) programme to identify the nature and extent of problems affecting transport performance, develop possible solutions, and agree expected improvements.
Year Rating Score
APR3: 2002/03 Weak 42%
APR4: 2003/04 Average 66%
13.4.3 WWLA identified eight areas where action was required in the technical transport planning process, and seven areas where management actions, will be necessary to underpin performance improvements. The response of the Council to the WWLA Report has been managed through a Monitoring Board of Chief Officers and Members and is summarised below.
Table 13.3: Technical Challenges
Challenge Response
T1: Over reliance on bottom-up processes for
programme assembly
The LTP2 process has established a clear transportation strategy that supports the City Strategy and is itself supported by detailed thematic strategies identifying clear objectives and investment priorities.
T2: Difficulties in
obtaining/managing data and distilling from this a coherent explanation of progress
The authority has made great strides in establishing good quality baseline and historic data although it is
acknowledged that it will take time to reap the benefits from this effort.
T3: Difficulties in setting realistic yet challenging targets
Setting realistic yet challenging targets is dependant to a large degree upon the quality of information available to the authority. Improvements in the baseline data will contribute to setting targets. Furthermore the Council has undertaken benchmarking across a range of indicators with other local authorities having similar transport characteristics. T4: Difficulties with
distinguishing between performance indicators that reflect desired
outcomes (objectives) and other indicators that describe inputs and outputs
The process of producing the second Local Transport Plan has provided the opportunity to review performance
indicators and ensure that the indicators selected will focus performance management upon the desired LTP outcomes.
T5: Cumbersome consultation processes that delay rather than assist delivery
The Council is committed to undertaking timely consultation with residents, businesses, stakeholders and partners and a thorough consultation process has underpinned the
production of the second LTP and informed the setting of objectives, investment priorities and detailed strategies. T6: Lack of experience and
expertise in progress reporting
T7: A failure to explain divergence from
programme and planned progress
The Council is working to improve its capacity in
performance reporting. Difficulties in recruiting and retaining suitable staff has reduced the level of progress in these areas but the recent appointment of a Transport Strategy and Programme Management Team Manager will help to drive improvements in this area.
T8: Not fully capturing the benefits of joint working and learning from others
The Council is seeking to work with neighbouring and other local authorities to develop improved working relationships and understanding across a range of transportation issues.
Table 13.4: Management Challenges
Challenge Response
MI: Insufficient priority afforded to the APR itself and the monitoring of progress
The Council has established a corporate monitoring process that will be used as a framework to guide the preparation of the APR. In addition the Council is committed to ensure that sufficient resources are made available to improve the quality of the APR itself – as evidenced by the success of the recent APR4 and APR5.
M2: Insufficient linkage between local authority transport agendas (plans and delivery) and
corporate objectives
During the process of producing the second LTP
considerable effort has been made to show how it links to the overarching corporate strategy.
M3: Corporate improvement plans stimulating large scale reorganisation diluting the focus on delivery on the ground M4: Weak project,
programme and
performance management
The Council has now established a structure that draws together the former Engineering Consultancy and the transportation client into a single organisation that has enabled scheme development from concept to completion to take place under a single management structure.
M5: Lack of cost management and prioritisation of
budgets to ensure effective programme delivery
The successful delivery of the A386, George Junction major scheme and the opportunity to increase the number of parking spaces provided within budget is evidence of the focus of the Council upon cost management issues and value for money. The LTP has established a prioritisation process that will be reviewed on an annual cycle to ensure that the programme continues to deliver value for money. The principles of “value engineering” will underpin scheme development.
M6: Insufficient recognition of
the importance of communication
The Council very much values the developing relationship with regional government officers. The Council has also increasingly established sound working relations with other agencies for example via the joint working on the Eastern Corridor Study.
M7: Recruiting and retaining the required skills
The Council recognises the importance of recruiting and retaining appropriate skills in order to deliver the LTP. This has proved to be an ongoing challenge but one that the Council is determined to rise to. The recent appointment of a Transport Strategy & Programme Management Team Manager will help to drive improvements in this area.
13.5 Performance Indicators
13.5.1 The LTP2 performance management programme has been developed based on advice provided in the DfT Technical Guidance on Monitoring the LTP2 Mandatory Indicators (2004) and subsequent advisory letters.
13.5.2 In line with the DfT technical guidance on monitoring local transport plans, this plan sets out a number of mandatory national indicators which assist the measurement of progress on the transport shared priorities, including on improving accessibility and public transport, whilst reducing problems of traffic congestion, air pollution and road safety – and asset maintenance. The following 17 mandatory indicators are relevant to Plymouth:
• Total Killed and Seriously Injured Casualties (BVPI 99(a) • Child Killed and Seriously Injured Casualties (BVPI 99(b) • Total Slight Casualties (BVPI 99 (c)
• Footway Condition (BVPI 187) • Principal Road Condition (BVPI 223)
• Non-Principal Classified Road Condition (BVPI 224a) • Unclassified Road Condition (BVPI 224b)
• Public Transport Patronage (BVPI 102)
• Satisfaction with Local Bus Services (BVPI 104)
• Accessibility (Health) Public Transport Access to Derriford Hospital (LTP1) • Change in Area Wide Road Traffic Mileage (LTP2)
• Cycling Trips (Annualised Index) (LTP3) • Mode Share of Journeys to School (LTP4) • Bus Punctuality (LTP5)
• Changes in Peak Period Traffic Flow into Urban Centres (LTP6) • Air Quality: Exeter Street (LTP8)
• Air Quality: Mutley Plain (LTP8)
13.5.3 The following regional indicators have been developed:
• SW Regional Traveline:
o Completeness and Accuracy to timing points o Completeness and Accuracy to all stops o Verified Traveline data
13.5.4 In addition the City Council has developed the following 9 local indicators to monitor the impact of LTP2 on Plymouth:
• Accessibility (Employment) Public Transport Access to Derriford Hospital and Science Park • Satisfaction with Local Transport Information (BVPI 103)
• Missed Doctors Appointments due to Transport Reasons • Patronage on Community Transport (Ring and Ride) • Patronage on the Tamar Valley Community Railway Line • Mode Share of Non-car Modes on the Torpoint Ferry • Mode Share of Journeys to Work
• Pedestrian Trips into the City Centre • Ease of Use of Rights of Way (BVPI 178)
13.5.5 The above indicators will be used to track progress on delivery of the LTP2 strategy objectives and investment priorities. Targets have been set for each indicator that are challenging yet realistic and demonstrate achievement of the LTP2 strategy outcomes by 2010/2011. The targets are intended to be achievable without the benefits that may arise from planned major schemes, and reflect:
• The objectives set out in Chapter 3
• The impact of the detailed strategies set out in Chapters 6 to 9 • Programme prioritisation set out in Chapter 12
• Past performance based on LTP1, Best Value Performance Plans, and internal monitoring of
transport
13.5.6 A robust process for setting targets and monitoring performance against trajectories has utilised evidence from past performance during the previous LTP including evidence on trends in outcomes and investments and benchmarking with other local authorities.
13.5.7 The prioritisation process described in Chapter 12 has identified the contribution of each intervention towards achieving the LTP2 objectives through assessing the impact on each indicator. This has only considered the transportation element to each scheme and has effectively capped the level of ‘costs’ in relation to ‘benefits’ delivered by each intervention. This means that target setting has used realistic estimates of the benefits that can be derived from the overall programme of interventions and reduced the risks to the achievement of the targets.
13.5.8 The process has been iterative so that once initial capital and revenue programmes have been prepared it has been possible to assess the contribution that interventions will make in
achieving individual objectives and targets. This has enabled robust setting of targets in the light of actual intervention programmes that are within the planning guidelines.
13.5.9 The evidence base linking past performance and level of investment will continue to be developed throughout the Plan period to improve the accuracy of the targets and the value for money achieved from set levels of investment. The prioritisation exercise will be repeated on an annual basis as part of a ‘Stage Gate’ review of the benefit and costs that are provided through each intervention and ensure value for money is maximised. This will again reduce the risk associated with delivery of LTP2 outcomes.
13.5.10 Table 13.5 shows how each indicator will be used to monitor progress in the delivery of the LTP2 objectives.
Table 13.5 Cross-Referencing of LTP2 Indicators Against Objectives Im pr ov e ac ce ss ib ili ty an d so ci al in cl us io n Im pr ov e ai r qu al ity & th e en vi ro nm en t Im pr ov e ro ad sa fe ty R ed uc e th e ra te o f g ro w th of tr af fic co ng es tio n S up po rt P ly m ou th ’s ur ba n re na is sa nc e & su st ai na bl e gr ow th M ak e m ai nt en an ce m or e ef fic ie nt an d ef fe ct iv e Im pr ov e qu al ity o f l ife Asset Maintenance BVPI223 - Principal Road
Condition
BVPI224a – Non Principal
Road Condition BVPI224b - Unclassified Road Condition BVPI187 - Footway Condition Road Safety
BVPI99(a) - KSI Casualties
BVPI99(b) - Child KSI
Casualties
BVPI99(c) - Slight
Casualties
Accessibility LTP1(a) - Accessibility
(Health) Public Transport Access to Derriford Hospital LTP1(b) - Accessibility (Employment) Public Transport Access to Derriford Hospital and Science Park Missed Outpatient Appointments due to Transport Problems Public Transport BVPI102 - Public Transport
Patronage
BVPI104 - Bus Satisfaction
LTP5 - Bus Punctuality
BVPI103 - Satisfaction with
Local Transport Information
Patronage on Community
Transport (Ring and Ride)
Patronage on the Tamar Valley Community Railway Line
Mode Share of Non-Car
Modes on Torpoint Ferry
SW Regional Traveline
Targets
Demand Management LTP2 - Change in Area Wide
Road Traffic
LTP6 - Change in Peak
Im pr ov e A cc es si bi lit y an d S oc ia l in cl us io n Im pr ov e A ir Q ua lit y & t he E nv iro nm e nt Im pr ov e ro ad sa fe ty R ed uc e th e ra te o f g ro w th of tr af fic co ng es tio n S up po rt P ly m ou th ’s ur ba n re na is sa nc e & su st ai na bl e gr ow th M ak e m ai nt en an ce m or e ef fic ie nt an d ef fe ct iv e Im pr ov e qu al ity o f l ife
Walking and Cycling
LTP3 - Cycling Trips
Mode Share of Journeys to
Work
LTP4 - Mode Share of
Journeys to School
BVPI178 - Ease of Use of
Rights of Way
Pedestrian Trips into the
City Centre
Air Quality LTP8 - Air Quality: Exeter
Street
LTP8 - Air Quality: Mutley
Plain
Asset Maintenance
Principal Road Condition – BVPI 223
Target: To maintain the percentage of the principal road network where structural maintenance
should be considered at less than 8.3% throughout the LTP2 period
Definition: The percentage of the local authority principal road network where structural
maintenance should be considered (based on SCANNER surveys)
Monitoring of LTP2 objectives: Make maintenance more efficient and effective
Past Performance
This indicator has been reported before in both LTP1 and recent BVPPs.
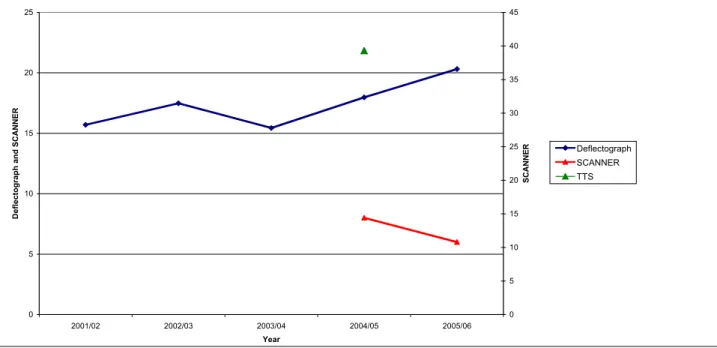
BVPP monitoring of principal road condition changed from Deflectograph to TTS (TRACS Type Survey) in 2004/05, and then again to SCANNER (Surface Condition Assessment for the National Network of Roads) in 2005/06. For 2004/05 and 2005/06, the Council decided to carry out Deflectograph, TTS and SCANNER surveys in parallel, so that an ongoing comparison could be made and reported for this indicator until the end of LTP1. However, it should be noted that there has been no extensive investigation of the correlation between BV (96) TTS and either BV (96) Deflectograph or BV (96) Coarse Visual Inspection (CVI). The original intention for the principal road condition target, which was set at the beginning of LTP1, was to achieve 10% of roads requiring structural maintenance by 2005/06. However, this target was set with the caveat that it was only meaningful as long as consistent forms of measurement were applied.
Subsequent changes to the methodology and updated Rules and Parameters led to a new baseline and trajectory having to be set in 2003/04 and it would now appear that the original LTP1 target was misinterpreted to be 0%, subsequently the trajectory was miscalculated for the years 2003/04 and 2004/05.
In 2005/06 we will be reliant upon the SCANNER methodology under BV (223), which is not wholly compatible with previous methodologies. Thus a more meaningful target needs to be set. A 2004/05 SCANNER figure was extrapolated from the TTS data to serve as a comparison. However, this should be viewed with caution due to the differences in the measurements, additional parameters, and different weighting of results. ‘SCANNER Surveys for Local Roads’ (UK Roads Board, July 2005) outlines the differences between TTS and SCANNER results in more detail, while also indicating a lack of known correlation between TTS and SCANNER.
0 5 10 15 20 25 2001/02 2002/03 2003/04 2004/05 2005/06 Year Deflectograph and SCANNER 0 5 10 15 20 25 30 35 40 45 S C A N N E R Deflectograph SCANNER TTS
Figure 13.3: Principal Road Condition
Evidence Behind Target
Expenditure on road maintenance has declined during the LTP1 period and Deflectograph data suggests that the condition of principal roads is deteriorating.
The Council will be seeking to target funding on highway maintenance in ways that will give the most effective return on available resources. For example we are exploring Prudential Borrowing for street lighting replacement, which will in turn, make available funding for highway
maintenance.
For these reasons a standstill target to maintain principal road condition at below 8.3% is both challenging and realistic. The target is also challenging because the Council only has one year’s worth of principal road condition data collected using the SCANNER specification (2005/06) and one year’s worth of SCANNER output derived from TTS surveys (2004/05), of which the UK Roads Board has expressed some reservations over the degree of correlation.
Methodology For Monitoring
Baseline: 2004/05=8.3% (SCANNER data derived from TTS survey)
Calendar or Financial Year: Financial Year
Reporting Frequency: Annual in LTP APR and BVPP
This indicator is to be monitored in line with BVPP guidance. TTS surveys were undertaken on the principal road network in both directions in 2004/05. The 2004/05 BVPI 96 figure (39.284%) was based on TTS which, when used to determine a SCANNER output, yields an output figure of 8.3%.
Actions of Plymouth City Council
• Finalisation of the Transport Asset Management Plan (TAMP)
• Delivery of capital and revenue maintenance programme, in line with the TAMP
• Work in partnership with Road Safety to ensure that road safety schemes, for example
1.39 18.1 9.5 1.54 0 2 4 6 8 10 12 14 16 18 20 2001/02 2002/03 2003/04 2004/05 2005/06 % o f N o n -P ri n ci p al R o ad s W h er e S tu ct u ra l M ai n te n an ce S h o u ld B e C o n si d er ed
Figure based from splitting BVPI97 into BVPI 97a and 97b - data not comparable with 2002/03 figure
Change in methodology from visually assessed rut depths to 'machine measured' rut depths and updated UKPMS Rules and Parameters
Actions of Partners and Operators
• Contractors to undertake monitoring of this BVPI for the Council in line with DfT, ODPM, and
Audit Commission requirements for the monitoring year
• The Council will consider the suitability of alternative funding sources such as the recently
announced PFI process for highway maintenance
Potential Risks and Preventative Measures/ Solutions
Risk Solutions
Bad or unusual weather can severely affect the condition of roads
Try to undertake surveys on days with similar weather conditions in order to draw meaningful comparisons.
Poor weather causing a backlog of schemes
Efficient annual programming of work
Non-Principal Road Condition – BVPI 224a
Target: Not required in Final LTP
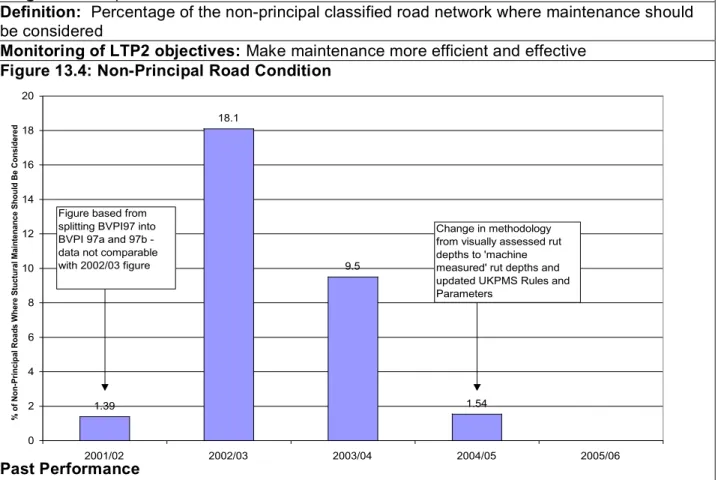
Definition: Percentage of the non-principal classified road network where maintenance should
be considered
Monitoring of LTP2 objectives:Make maintenance more efficient and effective
Figure 13.4: Non-Principal Road Condition
Past Performance
This indicator has been reported before in both LTP1 and recent BVPPs.
Prior to 2002/03, non-principal and unclassified roads were monitored as part of the same BVPI (BVPI 97). In 2002/03 BVPI 97 was split into two parts (97a & b) and data held before 2002/03 cannot be accurately compared with data after 2002/03. Also, within the period 2004/05, a change in survey methodology for non-principal roads took place, with a move away from visually assessed rut depths to ‘machine measured’ rut depths, in addition to updated UKPMS Rules and Parameters at the request of DfT. It was not practical to undertake a CVI in parallel with this new survey method in 2004/05 and hence 2004/05 data bears no correlation with previous data.
LTP2 targets are not required for BVPI 224a due to the lack of historical non-principal classified road SCANNER data. The Council will continue to collect CVI data for non-principal roads to aid the target setting process when required by DfT and to continue prioritising the maintenance of non-principal roads.
Evidence Behind Target
A target for non-principal road condition is not required in Final LTPs due to a changeover to SCANNER surveys. There have been changes in the monitoring methodology in the past which will make setting a target challenging. When required, a target will be set taking a view of the state of the non-principal road network and available capital and revenue funding.
Provisional LTP benchmarking showed that 69% of unitary authorities had not set a target (due to the change in methodology for 2005/06); 26% set a target for overall improvement.
Methodology For Monitoring
Baseline: NA
Calendar or Financial Year: Financial Year
Reporting Frequency:Annual in LTP APR and BVPP
This indicator is to be monitored in line with BVPP guidance. The figure for BVPI 224a in 2005/06 onwards was derived from SCANNER surveys.
Actions of Plymouth City Council
• Finalisation of the Transport Asset Management Plan (TAMP)
• Delivery of capital and revenue maintenance programme, in line with the TAMP
• Work in partnership with Road Safety to ensure that road safety schemes, for example
anti-skid surfacing is undertaken at the same time as routine maintenance wherever possible
Actions of Partners and Operators
• Contractors to undertake monitoring of this BVPI for the Council in line with DfT, ODPM, and
Audit Commission requirements for the monitoring year
Potential Risks and Preventative Measures/ Solutions
Risk Solutions
Bad or unusual weather can severely affect the condition of roads
Try to undertake surveys on days with similar weather conditions in order to draw meaningful comparisons.
Poor weather causing a backlog of schemes
Unclassified Road Condition - BVPI 224b
Target
:
To reduce the percentage of unclassified road where structural maintenance should beconsidered to 8% by 2010/11, from a baseline of 13.4% in 2003/04
Definition: Percentage of the unclassified road network where structural maintenance should
be considered
Monitoring of LTP2 objectives:Make maintenance more efficient and effective
Past Performance
This indicator has been reported before in both LTP1 and recent BVPPs.
The percentage of unclassified roads where structural maintenance should be considered improved between 2003/04 and 2004/05. Since 2002/03 there have been large fluctuations in the reported figures for unclassified roads. This indicator only measures a percentage of the highway network annually, and this variability is compounded by the subjective nature of CVI surveys. Therefore the target is being based on the higher 2003/04 figure of 13.40%, rather than the lower 2004/05 figure of 7.42%.
Figure 13.5: Unclassified Road Condition
Evidence Behind Target
The Council will be seeking to target funding on highway maintenance in ways that will give the most effective return on available resources.
Historical data shows large fluctuations in the results for BVPI 224b, which is partially due to the variable results of CVI. Therefore the trajectory is being set based upon the 2003/04 figure of 13.4% to ensure that a realistic target is produced.
The 2010/11 target is for overall improvement, to reduce the figure to below 8%.
Provisional LTP benchmarking showed that 51% of unitary authorities had not set a target for unclassified road condition, and 33% set a target for overall improvement.
0 2 4 6 8 10 12 14 16 2001/02 2002/03 2003/04 2004/05 2005/06 % of Unclassified Roads Where Structual Maintenance Should Be Considered
Figure 13.6: Unclassified Road Condition Target
Methodology For Monitoring
Baseline:2003/04 = 13.4%
Calendar or Financial Year:Financial Year
Reporting Frequency:Annual in LTP APR and BVPP
Monitoring of BVPI 224b in Plymouth is based on a visual survey of a proportion of the unclassified road network using the UKPMS CVI survey method.
Actions of Plymouth City Council
• Finalisation of the Transport Asset Management Plan (TAMP).
• Delivery of capital and revenue maintenance programme, in line with TAMP.
• Work in partnership with Road Safety to ensure that road safety schemes e.g. anti-skid
surfacing is undertaken at the same time as routine maintenance wherever possible.
Actions of Partners and Operators
• Contractors to undertake monitoring of this BVPI for the Council in line with DfT, ODPM, and
Audit Commission requirements for the monitoring year.
Potential Risks and Preventative Measures/ Solutions
Risk Solutions
Bad or unusual weather can severely affect the condition of roads
Try to undertake surveys on days with similar weather conditions in order to draw meaningful comparisons.
Poor weather causing a backlog of schemes
Efficient annual programming of work Variability of CVI survey and the effect
on being “on track” from year to year
Target set based 2003/04 performance. Analysis of results to more effectively target unclassified road maintenance 0 2 4 6 8 10 12 14 16 2001/02 2002/03 2003/04 2004/05 2005/06 2006/07 2007/08 2008/09 2009/10 2010/11 BVPI 224b BVPI 224b Target
Footway Condition – BVPI 187
Target: To reduce the percentage of the category 1, 1a and 2 footway network where structural
maintenance should be considered to below 21% by 2010/11, from a baseline of 23.75% in 2003/04
Definition: Percentage of the category 1, 1a and 2-footway network where structural
maintenance should be considered. Footway categories are defined in the Code of Practice for Maintenance Management (Institution of Highways and Transportation, 2001)
Monitoring of LTP2 objectives:Make maintenance more efficient and effective; Improve
accessibility and social inclusion; Improve air quality and the environment; Improve road safety; Reduce the rate of growth of traffic congestion; Support Plymouth’s urban renaissance and sustainable growth
Past Performance
This indicator has been reported before in both LTP1 and recent BVPPs.
This indicator is based on the collection and analysis of Detailed Visual Inspection (DVI) measurements using the Rules and Parameters for UKPMS. The threshold is indicative of the need for an investigation to determine whether maintenance is needed to preserve the footway serviceability.
The percentage of footways where structural maintenance should be considered has increased overall from 31.68% in 2002/03 to 43.9% in 2004/05; although in the 2003/04 baseline year, the figure was 23.75%.
This indicator was originally based on all sections of footway where the Overall Condition Index was >20. From 2004/05 onwards this was changed to all sections where the Overall Condition Index was => 20. Therefore sections of footway where the Overall Condition Index =20 are now included, and footway that previously would not have required investigation for maintenance, now qualifies, and as such has produced a larger result than the original trajectory had suggested.
Figure 13.7 shows that before the method for calculation changed, there was progress from 31.68% down to 23.75% between 2002/03 and 2003/04. It is not possible to correlate the result from 2004/05 (43.9%) to previous years and thus, given the uncertainty, setting a baseline on 2003/04, with a target of 21% by 2010/11 is believed to be challenging.
Figure 13.7: Footway Condition
31.68 23.75 43.90 18.65 0.00 5.00 10.00 15.00 20.00 25.00 30.00 35.00 40.00 45.00 50.00 2001/02 2002/03 2003/04 2004/05 2005/06 Year % of footways exceeding threshold
Figure 13.8 shows that past expenditure on footways maintenance decreased between 2004/05 and 2005/06.
Figure 13.8: Past Expenditure on Footways Maintenance Past Expenditure on Footways Maintenance
750 800 850 900 950 1000 1050 2001/02 2002/03 2003/04 2004/05 2005/06 Year T h o u sa n d s o f P o u n d s
Evidence Behind Target
The Council will be seeking to target funding on highway maintenance in ways that will give the most effective return on available resources.
The 2010/11 target is a continuation of the 2007/08 target in the 2005/06 BVPP and aims for overall improvement during LTP2. It assumes that the 2004/05 is a one-off fluctuation.
Figure 13.9: Footway Condition Target
The road condition data held in the UKPMS database has been used to identify a range of footway maintenance schemes. DVI was used to identify footway resurfacing schemes. In 2004/05, 360 footway schemes were identified at a cost of £303,300.
Provisional LTP benchmarking showed that 50% of unitary authorities had not set a target for footway condition, and 50% set a target for overall improvement.
Methodology For Monitoring
0 5 10 15 20 25 30 35 40 45 50 2001/02 2002/03 2003/04 2004/05 2005/06 2006/07 2007/08 2008/09 2009/10 2010/11 Year % o f fo o tw ay s b el o w t h re sh o ld BVPI 187 Target BVPI 187
Reporting Frequency:Annual in LTP APR and BVPP
This indicator is to be monitored in line with BVPP guidance. It is based on the collection and analysis of Detailed Visual Inspection (DVI) measurements. It is designed to provide the
percentage length of the footway network with a Footway Condition Index greater than a defined threshold value.
Actions of Plymouth City Council
• Finalisation of the Transport Asset Management Plan (TAMP)
• Delivery of capital and revenue maintenance programme, in line with the TAMP Actions of Partners and Operators
• Contractors to undertake monitoring of this BVPI for the Council in line with DfT, ODPM, and
Audit Commission requirements for the monitoring year
Potential Risks and Preventative Measures/ Solutions
Risk Solutions
Poor weather causing a backlog of
Road Safety
Total Killed and Seriously Injured Casualties – BVPI 99(a)
Target: To achieve a 60% reduction in the 1994-1998 average by 2010 (56 by the year 2010)
Definition: Number of people killed or seriously injured (KSI) in road traffic collisions
Monitoring of LTP2 objectives: Improveroad safety
Past Performance
This indicator has been reported before in both LTP1 and recent BVPPs.
The City Council has already achieved the DfT’s national road safety target to reduce total KSIs by 40% by 2010, based on the average of the KSI casualties from 1994-98 (Figure 13.10). The implementation of Road Safety Education, Training and Publicity, Engineering and Enforcement measures have made a significant impact in reducing casualties against a background of increasing road user mileage.
Figure 13.10: Killed or Seriously Injured (KSI) Casualties 1994-2010
40 60 80 100 120 140 160 180 200 19 94 19 95 19 96 19 97 19 98 19 99 20 00 20 01 20 02 20 03 20 04 20 05 20 06 20 07 20 08 20 09 20 10
New KSI Target Old KSI Target KSI Actual 94-98 baseline avg
The trend for pedestrian and pedal cycle KSIs is downward compared to the 1994-98 baseline. Motorcycle KSIs are on average showing a downward trend from the 1994/98 average although there is concern that progress may be stalling. Car user KSIs in 2004 are below the 2000-2004 five-year average of 26, and continue to be below the 1994/98 average.
Evidence Behind Target
The City Council is pleased with the success of achieving the National Road Safety targets but also recognises the need to further improve safety by stretching the 2010 targets.
The City Council’s new targets have been considered and set as a result of careful analysis of casualty data and due regard for plans concerning modal shift, growth and development in the City. The new target for KSI casualties is 56 by the year 2010, corresponding to a 60% reduction based on the 1994/98 average.
Comparative analysis of Unitary authority Provisional LTPs shows that the City Council’s new target is the second most stretching, only exceeded by Blackburn & Darwen’s 65% reduction in total KSI target (Figure 13.11). The City Council’s target is also the most stretching Provisional LTP Total KSI target for the South West.
65 % 60 % 60 % 55 % 52 % 45 % 45 % 45 % 44 % 42 % 42 % 40 % 40 % 40 % 40 % 40 % 40 % 40 % 40 % 40 % 40 % 40 % 40 % 40 % 40 % 40 % 40 % 40 % 39 % 0% 10% 20% 30% 40% 50% 60% 70% 80% Blackburn & Darwen
Windsor & Maidenhead
G re at er N ot tin gh am ( Jo in t) C en tr al L ei ce st er sh ire ( Jo in t) S lo ug h W es t B er ks hi re D er by ( Jo in t) Hartlepool M ilt on K ey ne s S ou th E as t D or se t, B ou rn em ou th , P oo le (J oi nt ) Sto ck to n-on -T ee s Telford & Wrekin Torbay W ok in gh am Lu to n & D un st ab le ( Jo in t)
Target KSIs % Reduction 1994-98 to 2010
Figure 13.11: Comparison KSI Targets for Unitary Authorities
Key interventions to support the target are the Motorcyclist Safety Engineering Programme, Local Safety Schemes Programme, Safety Barrier Programme, school travel plans and safer crossings in deprived wards. In total £3.0 million of capital funding has been prioritised for road safety schemes from the £17.2 million Planning Guidance. The spend of an additional £1.759 million through revised funding from the Safety Camera Partnership from 2007/08 onwards will be based on a separate business plan which will identify the split between capital schemes and revenue funding of road safety initiatives.
The capital prioritisation process has also shown that other transport scheme types also
contribute towards the road safety objective. For example there are schemes within the Demand Management and Walking/ Cycling category that help address the Road Safety shared priority in addition to road safety schemes. Revenue funding over LTP2 will remain the same in real terms to support road safety initiatives.
Figure 13.12: Road Safety: Past and Future Capital Spend
£0 £200,000 £400,000 £600,000 £800,000 £1,000,000 £1,200,000 £1,400,000 £1,600,000 2001 /02 2002 /03 2003 /04 2004 /05 2005 /06 2006 /07 2007 /08 2008 /09 2009 /10 2010 /11 Year E xp en di tu re
LTP1: Average Capital Spend Per Year on Road Safety
LTP2: Average Capital Spend Per Year on Road Safety
LTP1: Road Safety Capital (Local Safety Schemes and Road Crossings) Spend Per Year
LTP2: Road Safety Capital Spend Per Year
The target is challenging because the 2010 target has been stretched beyond the national road safety targets but with similar levels of funding to LTP1. Figure 13.12 shows that the average capital spend per year during LTP1 was £941,600. For the LTP2 period, in total £4.759 million has been prioritised for road safety schemes (including funding from the Safety Camera Partnership), equating to an average figure of £951,800 per year.
The target is realistic taking into account the excellent progress made to date in reducing KSIs, the contribution that other scheme types can make towards improving road safety, and the analysis which has been undertaken to produce this target.
Methodology For Monitoring
Baseline: 1994-1998 = 139
Calendar or Financial Year: Calendar Year
Reporting Frequency: Annual in LTP APR and Best Value Performance Plan
Total KSI statistics are obtained from STATS19, which is the system for collecting information on injury accidents. A range of measures and mechanisms are in place or under development to improve the quantity and quality of data captured to show progress and help to target resources and programmes. The City Council will be responsive to developing situations but see a positive and proactive programme as the best way to deliver objectives.
Actions of Plymouth City Council
• Delivery of Motorcyclist Safety Engineering Programme and Local Safety Schemes • Continued evaluation of scheme successes and casualty statistics in programme
development
• Continued undertaking of Road Safety Audits
• Ensure all new cycle route facilities are introduced only after being subject to all stages of
safety audit
• Ensure roads are properly maintained to reduce accident risk
• Ensure the provision of sufficient resources for training, education and publicity
• Continued enforcement of on-street parking, particularly parking prohibitions and restrictions • Greater understanding of the root cause of pedestrian, cycling and powered two wheeler
accidents
• Continue to work in partnership with Devon and Cornwall Safety Camera Partnership Actions of Partners and Operators
• For Devon & Cornwall Constabulary to continue to work in close partnership with PCC and
help to deliver the City’s Road Safety Strategy and reduce casualties
Potential Risks and Preventative Measures/ Solutions
Risk Solutions
Continued reduction in accidents will become more difficult as they become more dispersed as cluster sites are treated
Continue to implement safety and education measures
Continued growth in motorcycle use To implement the program of work drawn up for safety including education, training and publicity regarding motorcycle use and safety
Child Killed and Seriously Injured Casualties – BVPI 99(b)
Target: To achieve an 80% reduction in the 1994-1998 average by 2010 (7 by the year 2010)
Definition:Number of children (aged under 16 years) killed or seriously injured (KSI) in road
traffic collisions
Monitoring of LTP2 objectives:Improve road safety; Improve accessibility and social inclusion
Past Performance
This indicator has been reported before in both LTP1 and recent BVPPs.
The City Council has already achieved the DfT’s national road safety target to reduce child KSI’S by 50% by 2010, based on the average of the child KSI casualties from 1994-98 (Figure 13.13).
Figure 13.13: Child KSI Casualties 1994-2010
0 5 10 15 20 25 30 35 40 45 50 19 94 19 95 19 96 19 97 19 98 19 99 20 00 20 01 20 02 20 03 20 04 20 05 20 06 20 07 20 08 20 09 20 10
New KSI Target Old KSI Target KSI Actual 94-98 Baseline
Evidence Behind Target
The City Council is pleased with the success of achieving the National Road Safety targets but also recognises the need to further improve safety by stretching the 2010 targets. The City Council’s new targets have been considered and set as a result of careful analysis of casualty data and due regard for plans concerning modal shift, growth and development in the City. The new target for Child KSI is 7 by the year 2010, corresponding to an 80% reduction based on the 1994/98 average.
Comparative analysis of Unitary authority Provisional LTPs shows that the City Council’s 80% reduction in the 1994-1998 average by 2010 target is the joint most stretching child KSI target (Figure 13.14). It is also the most stretching for the South West, where most other authorities have adopted the national 50% reduction in the 1994-1998 average by 2010 target.
Key interventions to support the target include Local Safety Schemes, the Child Road Safety Engineering Programme, and School Travel Plan schemes. In total £3.0 million of capital funding has been prioritised for road safety schemes from the £17.2 million Planning Guidance. The spend of an additional £1.759 million through revised funding from the Safety Camera
Partnership from 2007/08 onwards will be based on a separate business plan which will identify the split between capital schemes and revenue funding of road safety initiatives.
The capital prioritisation process has also shown that other transport schemes also contribute towards the road safety objective. For example there are schemes within the Demand
Management and Walking/ Cycling category, which help address the Road Safety, shared priority in addition to road safety schemes. Revenue funding over LTP2 will remain the same in real terms to support road safety initiatives.
Figure 13.14: Comparison Child KSI Targets for Unitary Authorities 80 % 80 % 60 % 60 % 54 % 51 % 50 % 50 % 50 % 50 % 50 % 50 % 50 % 50 % 50 % 50 % 50 % 50 % 50 % 50 % 50 % 50 % 50 % 50 % 48 % 42 % 40 % 0% 10% 20% 30% 40% 50% 60% 70% 80% 90% Blackburn & Darwen Brighton & Hove
Windsor & Maidenhead
B la ck po ol East Riding G re at er N ot tin gh am ( Jo in t) M ilt on K ey ne s S ou th E as t D or se t, B ou rn em ou th , P oo le (J oi nt ) Southend-on-sea S w in do n T hu rr oc k W ok in gh am Lu to n & D un st ab le ( Jo in t) Torbay
Target KSIs % Reduction 1994-98 to 2010
Figure 13.15: Road Safety: Past and Future Capital Spend
£0 £200,000 £400,000 £600,000 £800,000 £1,000,000 £1,200,000 £1,400,000 £1,600,000 2001 /02 2002 /03 2003 /04 2004 /05 2005 /06 2006 /07 2007 /08 2008 /09 2009 /10 2010 /11 Year E xp en di tu re
LTP1: Average Capital Spend Per Year on Road Safety
LTP2: Average Capital Spend Per Year on Road Safety
LTP1: Road Safety Capital (Local Safety Schemes and Road Crossings) Spend Per Year
LTP2: Road Safety Capital Spend Per Year
The target is challenging because the 2010 target has been stretched beyond that of the national road safety targets but with similar levels of funding to LTP1. Figure 13.15 shows that the
average capital spend per year during LTP1 was £941,600. For the LTP2 period, in total £4.759 million has been prioritised for road safety schemes (including funding from the Safety Camera Partnership), equating to an average figure of £951,800 per year.
The target is realistic taking into account the excellent progress made to date in reducing child KSIs, the contribution that other scheme types make towards improving road safety, and the analysis which has been undertaken to produce this target.
Methodology For Monitoring
Baseline: 1994-1998 = 33
Calendar or Financial Year:Calendar Year
Reporting Frequency: Annual in LTP APR and Best Value Performance Plan
Child KSI statistics are obtained from STATS19, which is the system for collecting information on injury accidents. A range of measures and mechanisms are in place or development to improve the quantity and quality of data captured to show progress and help to target resources and programmes. The City Council will be responsive to developing situations but see a positive and proactive programme as the best way to deliver objectives.
Actions of Plymouth City Council
• Delivery of Local Safety Schemes, the Child Road Safety Engineering Programme, and
School Travel Plan Schemes
• Continued evaluation of scheme successes and casualty statistics in programme
development
• Continued undertaking of Road Safety Audits
• Ensure all new cycle route facilities are introduced only after being subject to all stages of
safety audit
• Ensure roads are properly maintained to reduce accident risk
• Ensure the provision of sufficient resources for training, education and publicity
• Greater understanding of the root cause of pedestrian, cycling and powered two wheeler
accidents
• Implementation of Child Casualty Reduction Scheme programme
• Continue to work in partnership with Devon and Cornwall Safety Camera Partnership • Maintaining/enhance existing scholars bus fare concessions
• Development and implementation of school travel plans and Safer Routes to Schools
schemes
Actions of Partners and Operators
• For Devon & Cornwall Constabulary to continue to work in close partnership with PCC and
help to deliver the City’s Road Safety Strategy and reduce casualties
Potential Risks and Preventative Measures/ Solutions
Risk Solutions
Continued progress will become more difficult as accidents become more dispersed, and more accident cluster sites are treated
Continue to implement safety measures and education of the public
Total Slight Casualties – BVPI 99(c)
Target: To achieve a 20% reduction in the 1994-1998 average by 2010 (890 by the year 2010)
Definition:Number of people slightly injured in road traffic collisions
Monitoring of LTP2 objectives:
I
mprove road safetyPast Performance
This indicator has been reported before in both LTP1 and recent BVPPs.
The City Council has already achieved the DfT’s national road safety target to reduce total slight casualties 10% by 2010, based on the average of the casualties from 1994-98. Figure 13.16 shows slight casualties by road user type.
Figure 13.16: Historical Slight Casualties Data by Road User Type Slight Casualties 0 100 200 300 400 500 600 700 800 94/9 8 Av erag e 1999 2000 2001 2002 2003 2004 Year N u m b e r Pedestrians Pedal Cyclists Motorcycles Car Users Other
Evidence Behind Target
The Authority is pleased with these successes to date but also recognises the need to further improve safety by stretching the 2010 targets.
The new target for Total Slight Casualties is 890 by 2010 corresponding to a 20% reduction based on the 1994-98 average (Figure 13.17).
Figure 13.17: Slight Casualties 1994-2010
850 900 950 1000 1050 1100 1150 1200 19 94 19 95 19 96 19 97 19 98 19 99 20 00 20 01 20 02 20 03 20 04 20 05 20 06 20 07 20 08 20 09 20 10 Slight casualties 1994/98 baseline Target New Target
target and exceeds the national target. Against an increasing trend in area wide vehicle
kilometres, this target will be challenging to achieve. Furthermore, Plymouth City Council’s target is the most stretching in the South West where most authorities have chosen to adopt targets of 10% reduction 1994-98 average to 2010.
Figure 13.18: Comparison Slight Casualties Targets for Unitary Authorities
Key interventions to support the target include the Motorcyclist Safety Engineering Programme and Local Safety Schemes. In total £3.0 million of capital funding has been prioritised for road safety schemes from the £17.2 million Planning Guidance. The spend of an additional £1.759 million through revised funding from the Safety Camera Partnership from 2007/08 onwards will be based on a separate business plan which will identify the split between capital schemes and revenue funding of road safety initiatives.
The capital prioritisation process has shown that other transport schemes also contribute towards the road safety objective. For example there are schemes within the Demand Management and Walking/ Cycling category, which help address the Road Safety Shared Priority in addition to Road Safety schemes. Revenue funding over LTP2 will remain the same in real terms to support road safety initiatives.
£0 £200,000 £400,000 £600,000 £800,000 £1,000,000 £1,200,000 £1,400,000 £1,600,000 2001 /02 2002 /03 2003 /04 2004 /05 2005 /06 2006 /07 2007 /08 2008 /09 2009 /10 2010 /11 Year E xp en di tu re
LTP1: Average Capital Spend Per Year on Road Safety
LTP2: Average Capital Spend Per Year on Road Safety
LTP1: Road Safety Capital (Local Safety Schemes and Road Crossings) Spend Per Year
LTP2: Road Safety Capital Spend Per Year
Figure 13.19: Road Safety: Past and Future Capital Spend
41 % 35 % 20 % 20 % 11 % 11 % 10 % 10 % 10 % 10 % 10 % 10 % 10 % 10 % 10 % 10 % 10 % 6% 0% 5% 10% 15% 20% 25% 30% 35% 40% 45% 50% Lu to n & D un st ab le ( Jo in t) Blackburn & Darwen P ly m ou th
Windsor & Maidenhead
B la ck po ol N or th L in co ln sh ire Darlington East Riding M ed w ay M ilt on K ey ne s S ou th E as t D or se t, B ou rn em ou th , P oo le (J oi nt ) Sto ck to n-on -T ee s T hu rr oc k Torbay Warrington Wok in gh am C ity o f Y or k C en tr al L ei ce st er sh ire ( Jo in t)
The target is challenging because the 2010 target has been stretched beyond that of the national road safety targets but with similar levels of funding to LTP1 (Figure 13.19). The average capital spend per year during LTP1 was £941,600. For the LTP2 period, in total £4.759 million has been prioritised for road safety schemes (including funding from the Safety Camera Partnership), equating to an average figure of £951,800 per year.
The target is realistic taking into account the excellent progress made to date in reducing slight KSIs, the contribution that other scheme types make towards improving road safety, and the analysis which has been undertaken to produce this target.
Methodology For Monitoring
Baseline: 1994-1998 = 1098
Calendar or Financial Year: Calendar Year
Reporting Frequency: Annual in LTP APR and Best Value Performance Plan
Total Slight Casualty statistics are obtained from STATS19, which is the system for collecting information on injury accidents. A range of measures and mechanisms are in place or
development to improve the quantity and quality of data captured to show progress and help to target resources and programmes. The City Council will be responsive to developing situations but see a positive and proactive programme as the best way to deliver objectives.
Actions of Plymouth City Council
• Delivery of Local Safety Schemes and the Motorcyclist Safety Engineering Programme • Continued evaluation of scheme successes and casualty statistics in programme
development
• Continued undertaking of Road Safety Audits
• Ensure all new cycle route facilities are introduced only after being subject to all stages of
safety audit
• Ensure roads are properly maintained to reduce accident risk • Provision of sufficient resources for training, education and publicity
• Continued enforcement of on-street parking, particularly parking prohibitions and restrictions • Greater understanding of the root cause of pedestrian, cycling and powered two wheeler
accidents
Actions of Partners and Operators
• For Devon & Cornwall Constabulary to continue to work in close partnership with PCC and
help to deliver the City’s Road Safety Strategy and reduce casualties
Potential Risks and Preventative Measures/ Solutions
Risk Solutions
Continued progress will become more difficult as accidents become more dispersed, and more accident cluster sites are treated
Continue to implement safety measures and education of the public
Continued growth in motorcycling use To implement the program of work drawn up for safety including education, training and publicity regarding motorcycle use and safety. Increase funding for the Motorcyclist Safety Engineering Programme
Accessibility
Accessibility (Health) Public Transport Access to Derriford Hospital - LTP1(a)
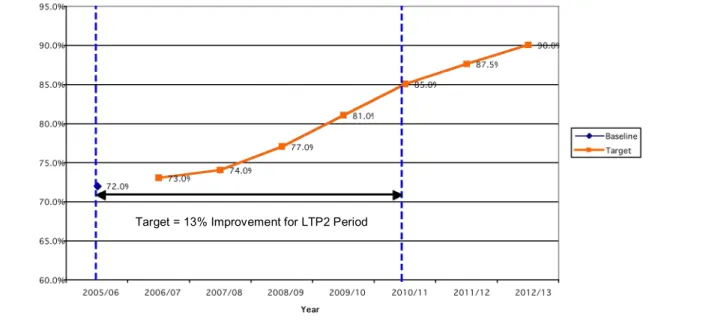
Target: To increase the percentage of households within 30 minutes travel time by public
transport to Derriford Hospital that do not have a car, from 82% in 2005/06 to 87% in 2010/11
Definition:Percentage of population with no car ownership within 30 minutes travel time of
Derriford Hospital between 1-3pm by public transport as determined by Accession runs
Monitoring of LTP2 objectives: Improve accessibility and social inclusion; Improve quality of
life
Past Performance
This indicator has not been reported prior to LTP2.
Derriford Hospital is Plymouth’s only major hospital. Steer Davies Gleave’s (SDG) 2005 study found that there is a correlation between public transport travel time, low car ownership and missed appointments. This suggests that there may be poor access to the site from the more deprived areas of the city. If access to the hospital by public transport is improved this would help to improve social inclusion, reduce the effects of deprivation and offer cost savings to the NHS due to a reduction in the number of missed appointments.
Derriford Hospital was also perceived as the most difficult place to get to without a car in a Plymouth residents survey and strategic accessibility analysis. Bus access is the only mode of public transport to Derriford Hospital although as the hospital is the main sub-regional facility and connections with road and rail services in Plymouth is important.
There is no historic data for this indicator and a baseline has been established for 2005/06. Output from Accession for 2005/06 shows the following results for accessibility to the hospital for non-car owning households between the hours of 1pm and 3pm.
Table 13.6: Accessibility by Households Without Access to a Car to Derriford Hospital
20min 30min 40min 60min
32% 82% 94% 99%
Evidence Behind Target
The target for the mandatory accessibility indicator is to increase the percentages of households that are without a car within 30 minutes of Derriford Hospital by public transport from 82% in 2005/06 to 87% in 2010/11. The concave trajectory in Figure 13.20 takes into account the
phasing of the Northern Corridor bus priority schemes throughout the LTP2 period and the cumulative effect of initiatives such as RTPI.
Figure 13.20: Accessibility (Health) Public Transport Access to Derriford Hospital Target
Key interventions that will ensure that the target is achieved include the Northern Corridor bus priority schemes, which will reduce journey times and improve the punctuality of those bus services serving Derriford from Stonehouse, Mutton Cove, Devonport and North Prospect. Discounted ticketing would reduce the financial burden of the bus trip amongst those that are on limited fixed incomes.
The target is challenging because Derriford Hospital was perceived as the most difficult place to get to without a car in a Plymouth residents survey and strategic accessibility analysis.
The target is realistic because public transport journey time savings identified though a study into the Northern Corridor bus priority has informed the identification of this target.
Methodology For Monitoring
Baseline: 2005/06 = 82%
Calendar or Financial Year: Financial Year
Reporting Frequency:Annual in LTP APR
This indicator will be monitored using the Accession model to show the percentage of people without a car within 30 minutes travel time by public transport of the hospital.
Accession runs based on latest public transport data using a 400 metre walking limit will show a 30 minute public transport travel time threshold from the hospital. Monitoring this will show improvements in public transport journey times arising from bus priority through frequency enhancement and more bus services.
82.00% 82.25% 82.75% 83.75% 85.00% 87.00% 79.00% 80.00% 81.00% 82.00% 83.00% 84.00% 85.00% 86.00% 87.00% 88.00% Baseline Figure 2006/07 2007/08 2008/09 2009/10 2010/11 Year P er ce nt ag e of h ou se ho ld s w ith ou t a ca r w ith in 3 0m in p ub lic tr an sp or t tr av el t im e of D er rif or d H os pi ta l
Actions of Plymouth City Council
• Implement the Plymouth Accessibility Strategy and Passenger Transport Strategy • Deliver the Accessibility Action Plan for Health
• Use the Accession model outputs to identify areas where accessibility is poor
• Continue to improve bus journey times by installing bus lanes and bus priority measures on
key routes to the area
• Publicise new more direct and improved bus services to Derriford Hospital including
innovative community transport based measures
• Develop targeted interventions through the Accessibility Strategy to develop additional
services funded from challenge bids and private developer funding to maximise access for households without a car
Actions of Partners and Bus Operators
• PCT and the City Council to conduct patient surveys and accessibility analysis
• Local Bus Company to analyse the viability of any modifications to existing services or
introduction of new services
• Bus Company to make improvements to service or run new more direct service/s Potential Risks and Preventative Measures/ Solutions
Risk Solutions
Lack of uptake of any new service Robust staff travel plan already established by the Plymouth NHS Trust which can be built on with potential to develop a Derriford Employers Staff Travel Plan Cluster
Lack of interest from local bus company Transport could be subsidised initially until patronage levels increase to sustainable levels
Some people cannot get to the hospital at all
Health services may not be accessible at all from some places especially outside the City boundary. Community transport initiatives could be used to assist people in accessing the site
Accessibility (Employment) Public Transport Access to Derriford Hospital and the
Science Park – LTP1(b)
Target: To increase the percentage of all households that are within 30 minutes public transport
travel time of Derriford Hospital and Tamar Science Park from 78% in 2005/06 to 85% in 2010/11
Definition: Percentage of the population within 30 minutes travel time by public transport of
Derriford Hospital between 7-9am as determined by accession runs
Monitoring of LTP2 objectives: Improve accessibility and social inclusion; Improve quality of
life
Past Performance
This indicator has not been reported prior to LTP2.
Derriford is the only major hospital in Plymouth and is therefore a major employer to ‘key workers’ such as nurses, cleaners and porters. The nature of the work at the hospital is shift based and therefore staff are required to access the site throughout the day. Adjacent to the hospital is the science park, which requires improved access in peak periods of the day.
Derriford Hospital was perceived as the most difficult place to get to without a car in a Plymouth residents survey. This means that it is perceived to be difficult for key workers to get to the hospital and commuters to get to the science park via public transport.
There is no historic trend and a baseline has been established for 2005/06. Output from
Accession for 2005/06 shows the following results for accessibility to the hospital for households between the hours of 7am and 9am.
Table 13.7:Accessibility by Households Without Access to a Car to Derriford Hospital and the Science Park
20min 30min 40min 60min
36% 78% 92% 98%
Evidence Behind Target
Public transport journey time savings identified through a study into northern corridor bus priority have informed the identification of this target. The target for accessibility to Derriford Hospital and Tamar Science Park is to increase the percentage of households within 30 minutes travel time by public transport of Derriford Hospital from 72% in 2005/06 to 85% in 2010/11. The concave trajectory takes into account the phasing of the Northern Corridor bus priority schemes throughout the LTP2 period.
Figure 13.21: Accessibility (Employment) Public Transport Access to Derriford Hospital and the Science Park
Key interventions to ensure that the target is achieved include the Northern Corridor bus priority schemes, which will reduce journey times and improve the punctuality of those bus services serving Derriford from Stonehouse, Mutton Cove, Devonport and North Prospect. The key
strategy is to improve access by public transport to the Hospital and Science Park throughout the day. New bus services would have to have increased patronage or be subsidised initially to improve uptake of services.
The target is challenging because it is more demanding than the mandatory accessibility indicator as the access to employment indicator focuses on the morning peak period and therefore has greater scope to reduce journey times relative to the car through bus priority schemes. Also major levels of employment growth are envisaged for the Derriford area.
The target is realistic because public transport journey time savings identified though a study into the Northern Corridor bus priority scheme informed the identification of this target.
Methodology For Monitoring
Baseline: 2005/06 = 78% 78% 78.50% 79.25% 80.25% 85% 82.00% 74% 76% 78% 80% 82% 84% 86% Baseline Figure 2006/07 2007/08 2008/09 2009/10 2010/11 Year P er ce nt ag e of h ou se ho ld s w ith in 3 0m in p ub lic t ra ns po rt t ra ve l tim e of D er rif or d H os pi ta l a nd S ci en ce P ar k
This indicator will be monitored by using Accession runs to determine the percentage of population within 30 minutes public transport travel time of Derriford between 7-9am.
Actions of Plymouth City Council
• Implement the Passenger Transport Strategy and Plymouth Accessibility Strategy • Deliver the Accessibility Action Plan for Employment
• Use the Accession model outputs to identify areas where accessibility is poor
• Continue to improve bus journey times by installing bus lanes and bus priority measures on
key routes to the area as described in the capital programme
• Publicise new and improved bus services to Derriford Hospital Actions of Partners and Operators
• Employers at the Science Park and to survey staff on journey to work habits • Employers to develop Workplace Travel Plans
• Employers at the Science Park and Derriford Hospital would need to develop staff travel
plans to improve patronage on any proposed service
• Bus operators to analyse the viability of any modifications to existing services or introduction
of new services
• Bus operators to make improvements to service or run new more direct service/s where
appropriate
• Bus operators and employers to promote new and improved bus services Potential Risks and Preventative Measures/ Solutions
Risk Solutions
Lack of uptake of any new service Robust staff travel plan already established by the Plymouth NHS Trust which can be built on with potential to develop a Derriford Employers Staff Travel Plan Cluster
Lack of interest from local bus company Transport could be subsidised initially until patronage levels increase to sustainable levels
Missed Outpatient Appointments Due to Transport Problems
Target: To reduce the percentage of Outpatient appointments that are missed each year due to
transport reasons – target to be set following baseline data collection in 2006/7
Definition: The percentage of Outpatient appointments that are missed due to transport reasons
Monitoring of LTP2 objectives: Improve accessibility and social inclusion; Improve quality of
life
Past Performance
This indicator has not been reported prior to LTP2.
Steer Davies Gleave’s (SDG) 2005 study suggests that there is a correlation between car ownership, public transport travel time and missed appointments. Further work will be undertaken by the City Council to further develop this research.
Evidence Behind Target
There is no historic data for this indicator. The delivery of measures to improve accessibility to Derriford Hospital will help reduce the impact of appointments missed due to transport reasons. In 2006/07 work will be undertaken to establish whether there is a clear link between transport and missed appointments. If there is a clear link, then this indicator will be monitored from 2006/07 onwards through partnership working with the PCT.
Comparative analysis of Provisional LTPs shows that no other Provisional LTP includes an indicator to measure missed medical appointments.
Key interventions which will ensure that the target, once it is set, will be achieved includes the delivery of the Northern Corridor bus priority schemes will ensure that buses to the hospital run on time and attract more people to the service. The Accessibility Strategy may also develop
targeted interventions to contribute to this. Delivery of the Public Transport Information Strategy will ensure that appropriate information is provided to enable people to plan their journeys to the hospital. The Plymouth Community Transport Strategy also outlines the need for a more
formalised demand responsive service linking to the Derriford Hos