Management Forecasts in Crowded Sectors
Abstract
Thispaperdocumentsadualrolefordisclosure. Inadditiontothetraditionalroleof alleviat-inginformationasymmetry,firmsaremotivatedtodisclosetoattractinvestors’limitedresources andorderflow awayfrom otherfirms (Fishman andHagerty,1989). Inperiods whenfirms re-turnscomovemorewiththeirsector’sreturnsandthusfacemorecompetitionforinvestors,they issuemore guidance,especially capex guidance. Theeffectof firm-sectorcomovement("sector crowdedness")onguidanceincreases withfiercercompetitionforinvestors. Guidanceincreases liquidity and price efficiency (measured as investment sensitivity to price), but the impact of guidancedecreasesin sector crowdedness,consistentwiththepropositionthatmore disclosure in the crowded sectors is investor-seeking rather than precision increasing. Although the im-pact ofguidance oninvestment-price sensitivity islower in more crowdedsectors, theeffect is still positive, suggesting that firmscan improve priceefficiency by issuingguidance to attract informedinvestorstothefirm.
1
Introduction
A substantial literature examines disclosure as a tool firms use to reduce information
asymme-try.1 One set of studies in this literature tests the hypothesis that disclosure will increase a firm’s
liquidity and reduce its cost of capital (e.g. Diamond, 1985; Diamond and Verrecchia, 1991). A
second line of research supposes that if information asymmetry reduction motivates disclosure, then firms with the greatest information asymmetry problems, or with the greatest incentives to miti-gate them, will disclose more. Empirical studies have documented a number of firm characteristics associated with disclosure, assuming disclosure is motivated by incentives to mitigate information
asymmetry, including periods of raising capital (e.g.,Lang and Lundholm,2000), stock-based
com-pensation plans (e.g., Nagar et al., 2003), institutional following and ownership (e.g., Bushee and
Noe, 2000; Ali et al., 2014), corporate governance (Ajinkya et al., 2005), and many others.
To-gether these studies are interpreted as evidence that disclosure is an effective tool firms use to reduce information asymmetry.
We examine a different motivation for voluntary disclosure choice – competing with other stocks
for limited investor resources. As modelled by Fishman and Hagerty (1989), when investors have
limited resources to study firm disclosures and extract valuable information, they must allocate their limited resources among stocks. Firms, which are motivated to attract informed investors to improve price and investment efficiency, can attract informed investors to study them by providing
more precise disclosures than other firms. Fishman and Hagerty(FH) predict a prisoners
dilemma-style equilibrium in which the level of disclosure is greater than the socially optimal disclosure level. Firms make more disclosures than they would in an unconstrained environment because they use disclosure not only to reduce information asymmetry but also as a tool to win investors’
limited attentiveness.2 The investor-seeking motive for disclosure, in addition to an information
asymmetry reduction motive, generates novel predictions about when and which firms will disclose and the consequences of disclosure.
Before discussing our findings, we note that our proxy for disclosure is the issuance of man-agement guidance. FH model disclosure as an informative signal in the traditional sense that the
1SeeBeyer et al.(2010) for a review of the literature. 2
Attentiveness represents the investor’s conscious choice to spend her limited resources to "attend" to or study a firm’s disclosures.
disclosure increases the precision of a trader’s estimate of firm value. As an example, they suggest that a firm could increase the precision of the signal by improving disclosures within the 10-K.
Man-agement guidance fits the description of a precision-increasing disclosure based on prior research.3
In addition, empirical evidence shows a positive association between the frequency of management
guidance and proxies for financial reporting quality (Ball and Shivakumar,2008;Ball et al.,2012).
Thus, we use guidance frequency as a proxy for the firm’s overall strategy regarding disclosure precision.
Our first analysis relates to the question of when and which firms will disclose assuming that increased disclosure is a tool firms can use to compete for investors. We show that firms that have greater return comovement with their industry peers ("firm-sector comovement" or greater
"sector crowdedness"), issue more frequent guidance.4 A high degree of firm-sector comovement
suggests that the firm’s economic fundamentals are likely to experience common shocks with its industry peers which, from investors’ perspectives, increases the substitutability among the stocks. Information precision becomes a relatively more important factor in an investor’s choice about which firms to study and ultimately about security selection. This result is consistent with firms viewing disclosure as having a dual role – reducing information asymmetry and attracting investors who only study a limited set of firms within a sector.
The correlation between sector crowdedness and forecasting is most economically significant for capital expenditure forecasts, which we expect contain more firm-specific information that can im-prove precision. But, the correlation also holds for total guidance, earnings-related guidance, and sales guidance and for short and long horizon guidance. This result is not driven by firm-level fac-tors that are potentially correlated with both firm-sector comovement and firm-level management forecast decisions. The set of control variables we include comes from a recent review article on the
antecedents on forecasting (Hirst et al.,2008) and includes proxies for analyst and investor
environ-ment, information asymmetry, firm performance, litigation risk, and product market competition. Common shocks to investment at the industry-year level do not explain the higher likelihood of capex guidance for firms with greater firm-sector comovement.
3SeeHirst et al.(2008) for a survey of the literature on consequences of management guidance. 4
We refer to the explanatory power of a model of the comovement of a firm’s returns with the returns of other firms in the sector as "firm-sector comovement." We use the term "return synchronicity" for the explanatory power of a market model, that regresses a firm’s return on a market index (e.g.,Morck et al.(2000)), and possibly other factors.
In cross-sectional analysis, we show that firms with the greatest incentives to differentiate them-selves from the crowd provide more total guidance as sector crowdedness increases. We predict that the benefits of disclosure in terms of attracting investors are greater for smaller firms with lower analyst following and for firms that are not in the S&P 500. We also predict that disclosure benefits are greater for firms that have more volatile variation in institutional holdings, under the assump-tion that firms value instituassump-tional ownership. Based on all four firm-level proxies for incentives to compete, the sensitivity of disclosure to sector crowdedness is stronger for firms that face greater exposure to the limits on investors’ resources. We also examine industry-level proxies for incentives to compete. The guidance decisions of firms are more sensitive to firm-sector comovement in sectors with high levels of comovement or proportions of firms that comove. This finding is consistent with our assumption of category investing, which predicts that category investing increases comovement
(Barberis and Shleifer,2003;Barberis et al.,2005). As investment in a particular category increases,
regardless of what drives the sentiment, firms will disclose to capture a piece of the pie. Also, firms disclosures are less sensitive to comovement in industries followed by more dedicated investors and more sensitive to comovement in industries characterized by quasi-indexers. Both the firm-level and industry-level variation in the disclosure-comovement sensitivity is consistent with the prediction that competition for investors is a factor in disclosure choice.
We next examine predictions about disclosure consequences assuming that increased disclosure is a tool firms can use to compete for investors. We first confirm the well-documented association
between management forecasts and liquidity and cost of capital (Leuz and Verrecchia, 2000; Lang
and Maffett,2011;Balakrishnan et al.,2014). Given our finding of an association between
comove-ment and disclosure, we question whether part of the disclosure-liquidity relation could be driven by an association between firm-sector comovement and liquidity. Prior literature hypothesizes and finds a positive association between synchronicity and liquidity because the common information
in price reduces adverse selection costs (Chan et al.,2013;Baruch et al.,2007). We find, however,
that guidance and comovement have independent effects on our three proxies for liquidity. Adding fixed effects significantly reduces the coefficient estimates, particularly for the effect of management forecasts on liquidity. Hence, the effect of guidance on liquidity is mainly cross-sectional rather than time-varying, but sector crowdedness is an important driver of both time-varying within-firm and cross-sectional liquidity.
The key finding, however, is that the effect of guidance on liquidity and price efficiency, measured as the sensitivity of investment to price, decreases with the level of firm-sector comovement. This evidence is consistent with FH’s proposition that, when firms compete for investors, disclosure is greater than is needed to increase information precision. The excess disclosure is an optimal strategic response necessary to attract traders’ limited resources. Thus, the marginal effect of the disclosure on liquidity and price efficiency is smaller as firm-sector comovement increases.
The finding that sector crowdedness affects guidance decisions provides a new explanation for the well-documented association between disclosure and liquidity. Both information asymmetry reduction and competition for investors motivate disclosure. Competition is fiercer when assets are more substitutable, in which case the driving factor in the investor’s asset selection decision within the sector is not firm fundamentals, but rather the relative precision of the information about the fundamentals. Thus, from the firm’s point of view, disclosure serves a dual role. It provides information, which reduces information asymmetry, but it also provides incentives for more traders to study and invest in the firm’s stock. Our analysis of liquidity confirms that the disclosures increase liquidity and price efficiency.
These findings have implications for the learning-from-price literature. Chen et al. (2006), for
example, show that the sensitivity of corporate investment to stock price is higher for firms with lower firm return synchronicity with market and industry returns. They interpret this result as evidence of a learning channel, based on the assumption that lower return synchronicity implies
more firm-specific information in price. Thus, Chen et al. (2006) conclude that firms with a weak
information environment have worse price and investment efficiency. Our findings suggest that higher return synchronicity could mean that the firm’s fundamentals are more correlated with the
sector, reducing adverse selection as inChan et al.(2013), not that the firm has a weaker information
environment. Moreover, the firm-sector comovement motivates disclosure. Taken together, the analysis shows that firms can change the investment-price efficiency calculus by issuing guidance and increasing disclosure precision.
The paper proceeds as follows. Section 2 sketches out the FH model and discusses the literature on return comovement and category investing, which are the building blocks of our proposition. Section 3 discusses our sample and the model and variable specifications. Sections 4 and 5, respec-tively, report our analysis of disclosure and sector crowdedness and the capital market consequences
of disclosure in crowded sectors. Section 6 concludes.
2
Limited Investor Resources and Disclosure
2.1 The Fishman-Hagerty model
Our empirical predictions about sector crowdedness and disclosure follow the logic of the
Fish-man and Hagerty (1989) model, which predicts that competition for limited investor resources
motivates firm-level disclosure. FH model a single market in which firms make an unobservable investment in a risky asset and provide a signal of the project’s value. Firms have an incentive to increase price efficiency and hence investment efficiency, which they can accomplish by disclosing a more precise signal. The firm chooses the disclosure’s precision; greater precision is more costly.
Individual traders can study firms’ disclosures and then trade. Each trader can observe the signal of one firm costlessly; observing more than one signal is prohibitively costly. The assumption that observing signals is costly means that traders must incur costs to extract informative signals
from publicly available documents. For example, all traders may be able tosee a 10-K document,
but it is costly toobservethe informative signal within the 10-K. The assumption that traders study
only one firm is made for mathematical convenience, but the general idea that investors follow a
subset of firms in the market is plausible (Merton,1987;Barberis and Shleifer,2003). After traders
observe the signal, trading occurs in a securities market as inKyle (1985).
FH predict that firms will compete to induce investors to study their disclosures by producing more precise signals. A more precise disclosure about the project value has two effects: (1) precision directly increases the precision of the order flow and (2) precision attracts more informed traders to study the firm. These two effects together lead to a more efficient price for the disclosing firm. A firm’s precise disclosure creates a negative externality – a less efficient price for firms that provide less precise disclosures. The result is a prisoners dilemma-style equilibrium in which the level of disclosure is higher than in settings in which investor resources are less constrained. FH conclude that firms that are exposed to this type of competition for limited investor resources expend more resources on disclosure than is socially optimal.
2.2 Translating the FH model
The FH model assumes that investors make their resource allocation decision across firms in a single market. The informed traders then trade only the shares of the firm they have studied; trading other firms is unprofitable. A more realistic version of the stylized FH model assumes that traders first make a portfolio allocation decision across investment categories and subsequently they (or their delegated asset managers) select specific securities within the category to study and trade. This practice – commonly called category investing – can arise optimally with costly information
processing or when investors are subject to information acquisition constraints (Van Nieuwerburgh
and Veldkamp,2010).5 Peng and Xiong (2006) also offer theoretical support for category investing,
by showing that costly information acquisition and limited investor resources lead to category-learning behavior.
We focus on sectors as an investment category. Peng and Xiong (2006) suggest industry as a
category that investors could want to learn about. Firms in the same industry are more likely to be subject to common shocks because they use similar inputs and produce similar outputs. Evidence
suggests that analysts tend to concentrate on certain industries (O’Brien,1990;Dunn and Nathan,
2005). Analyst concentration consolidates the learning of common information (Veldkamp, 2006),
but leaves open the need for firm-level disclosures to analysts who can study and understand them. Empirically, we observe category investing by industry. As of December 31, 2016, there were 356 sector funds with total net asset value of 360 billion dollars.
Assuming investors engage in sector investing, firms will consider their industry peers to be the
set of firms they compete against for investors’ limited resources through increased disclosure.6 The
more substitutable the assets in a sector, the more important disclosure precision will be to the investor’s security selection within the category. Without substitutability, fundamentals are a clear driver of asset selection. With substitutability, investors will choose between otherwise "identical" stocks based on information precision. This proposal implies a time-varying measure of similarity with other firms in the sector to capture the notion of fiercer competition. As the substitutability
5
Van Nieuwerburgh and Veldkamp (2010) predict that this sort of information gathering will lead to under-diversified portfolios.
6
Minton and Schrand(2016) predict that firms appeal to investors by remaining exposed to a common factor that is an attractive investment index, such as gold or oil prices. Remaining exposed to a factor bynot hedging it is a costly real activity. A credible disclosure policy is an alternative.
increases, the firm will engage in strategies to increase disclosure precision and attract investors.
2.3 Empirical predictions
The first testable prediction is that firms that face more crowded sector conditions – with highly substitutable assets – will disclose more. To capture within-sector asset substitutability, we use a time-varying firm-level measure of the comovement of a stock’s returns with the average returns of stocks in the firm’s sector ("firm-sector comovement"). Higher firm-sector comovement indicates greater correlation among the underlying economic fundamentals, which increases the substitutabil-ity of the stocks. Including year-quarter and firm fixed effects and other documented determinants of disclosure in the model mitigates concerns about omitted variables that are correlated with both disclosure and firm-sector comovement. Our model explains the within-firm response of disclosure to time-varying comovement.
Our comovement measure is distinct from typical return synchronicity measures used in prior
literature. Typically, even studies that examine industry comovement measure the R2 of a
two-factor market model that includes industry returns. Our R2 is based on a model that does not
include the market index. This measure is consistent with our assumption that investors engage in sector investing, thus the correlation of returns with the market is unrelated to the choice of assets within the sector. This measure is a proxy for correlated fundamentals within the sector.
Although we use firm-sector comovement as a proxy for correlated fundamentals, it is correlated with return synchronicity and we recognize the possibility that higher return comovement could be correlated with the amount of firm-specific information in price. There are two schools of thought on a possible correlation between return synchronicity and the extent of private information in price. The first is that return comovement represents a weaker information environment and less
firm-specific information in price. This idea is common in the literature,7 particularly related to
cross-country or industry synchronicity, with studies primarily citing empirical evidence in Morck
et al. (2000). For clarification, Morck et al. (2000) examines variation in country-level measures
of synchronicity. They show that cross-country variation in synchronicity is not explained by their country-level measure of synchronous fundamentals – a country-level index for comovement of ROA – but it is associated with country-level measures of a weak information environment. Since the
publication of Morck et al. (2000), studies have assumed that return synchronicity is negatively correlated the amount of firm-specific information in price, not just in cross-country studies, but also in studies within the U.S that compute firm-level measures of synchronicity with the market
or an industry factor. In the context of disclosure, Haggard et al. (2008) document a negative
concurrent association between return synchronicity and disclosure rankings, concluding that better
disclosure increases the amount of firm-specific information in price. Hutton et al. (2009) find that
firms with more opaque financial statements, measured by greater abnormal accruals, have higher
R2sin a two factor market model with an industry factor. The effect ends after the Sarbanes-Oxley
Act (SOX) in 2002. They attribute the cessation of guidance to greater monitoring such that the
abnormal accruals measure no longer captures opacity. Recently, the generalizability of theMorck
et al. (2000) findings have been questioned for cross-country synchronicity (Alves et al.,2010) and
synchronicity in general (Li et al.,2014)). Alves et al.(2010) suggests that the results are specific
to 1995, the only year of analysis inMorck et al. (2000). Subsequent literature largely ignores the
idea that correlated fundamentals would also generate return synchronicity, although prominent as
an alternative inMorck et al. (2000).
Overall, while there is theoretical support for the idea that synchronicity implies a weak
informa-tion environment, studies subsequent to Morck et al. (2000) suggest that our firm-sector measure
of comovement is unlikely to reflect a weaker information environment. In addition, we provide descriptive and anecdotal evidence consistent with our interpretation of firm-sector comovement as a measure of correlated fundamentals. The types of industries with higher comovement on average
have a common commodity factor such as gold or oil (see Figure1). In addition, we find that firms
in more crowded sectors have higher liquidity, analyst following, and institutional ownership, all characteristics of a stronger, not weaker, information environment. Finally, our results hold despite controls for a weak information environment in all of the models.
A second school of thought suggests that comovement represents greater transparency andmore
private information in price, opposite to the first school. One theory is that comovement implies that
price contains more public and easily observable information for the market maker (Baruch et al.,
2007). The commonality reduces adverse selection costs and results in higher volume and liquidity.8
8
Dasgupta et al.(2010) suggest another possibility. For more transparent firms, price better reflects information about the future. More informative current prices imply fewer surprises in subsequent periods, which implies greater return synchronicity as measured byR2.
Empirical evidence is consistent with the idea that synchronicity implies more common information
in price. If higher comovement impliesmoreinformation in price, then using comovement as a proxy
for substitutability biases the tests against our hypothesis as firms in more crowded sectors would
not need to disclose; they could free ride on the information in peer firm disclosures as inBaginski
and Hinson (2016).9 Nonetheless, in robustness tests, we include lagged peer disclosures and firm
fixed effects in the model to proxy for external information. All results, including the cross-sectional results, are robust to this specification.
Our proxies for disclosure are various measures related to the existence and frequency of man-agement guidance. The premise behind these proxies is that information precision is higher when a management forecast is provided, and when more forecasts are provided, than when no forecast is provided. These measures are basic, but there is substantial evidence that forecasts on average can
provide information (Hirst et al., 2008). In addition, Ball and Shivakumar (2008) and Ball et al.
(2012) provide evidence that guidance frequency is correlated with earnings quality metrics and
audit fees. Thus, guidance is one of a number of correlated choices that reflect greater precision in financial reporting overall.
Throughout the analysis, we examine capital expenditure forecasts separately from sales or earnings forecasts. We expect capital expenditure forecasts to contain relatively more firm-specific information that can differentiate the firm from its peers than earnings forecasts on average. Earn-ings reflects both firm-specific news and common macroeconomic or industry trends, and the latter is easily accessible from public information. For example, an earnings announcement by a gold firm aggregates information about gold prices with information about the firm’s business model as it relates to gold production or distribution. The gold price component is public knowledge and does not require costly study by investors. Hence, sales and earnings forecasts are expected to provide the sort of precision investors can profit from only if the growth in sales or earnings is abnormal relative to an overall trend for the firm or sector. Capital expenditure forecasts, by contrast, are more likely to contain information that increases precision and attracts investors to study the firm. Prior research suggests that disclosures of future capital expenditures are a relevant signal of firm
value and managerial reputation (e.g., McConnell and Muscarella,1985; Hirshleifer, 1993;Chung
9
Baginski and Hinson(2016) show that when a firm stops issuing guidance, firms in the same industry that were "free riding" on the common information increase forecasting activity, which affects their cost of capital.
et al.,2001;Brailsford and Yeoh,2004).
We provide evidence on sector crowdedness, measured by firm-sector comovement, as an an-tecedent of disclosure choice, measured by guidance issuance, in three steps. Our first analysis establishes the positive temporal correlation between sector crowdedness and subsequent quarter management guidance decisions, in general, and for capex guidance in particular. Second, we con-sider alternative explanations for the positive association between sector crowdedness and disclosure and attempt to rule them out through robustness and falsification tests. Finally, we show predictable covariation in the disclosure-crowdedness relation. We predict that the influence of sector crowd-edness on disclosure will be strongest for smaller firms with lower analyst following, who are less studied. At the firm level, we also predict that disclosures of firms with more variable institutional ownership and those that are not in the S&P 500 will be more sensitive to sector crowdedness. At the industry level, we predict that the guidance of firms in sectors with higher comovement on average and with a greater proportion of competing firms will be more sensitive to crowdedness, following
the predictions ofBarberis et al.(2005). Their analysis shows that correlated fund flows into a style,
which could be a sector, lead to greater comovement in asset prices within the style. This result implies that the overall industry-level of comovement will increase the competition for investors. Our model includes firm-sector comovement as a main effect and also conditions on industry-wide comovement, which represents a bigger pie that firms are competing for with the other stocks in the same sector. Finally, we predict that the effect will be stronger for firms that rely on quasi-indexers that choose to trade a subset of available securities from the sector they are tracking.
We next examine disclosure consequences. Although the proposition that firms are motivated to disclose to compete for limited investor resources predicts excessive disclosure – more than is socially optimal – the guidance nonetheless increases liquidity and price efficiency. As recognized in the FH model, disclosure serves the dual role of increasing liquidity and price efficiency by attracting more
informed investorsand by reducing information asymmetry. Increasing liquidity and price efficiency
are also predicted if information asymmetry alone motivates disclosure. The motives of information asymmetry reduction and investor-seeking are not mutually exclusive.
To distinguish whether investor-seeking is an incremental factor in disclosure choice beyond the objective to reduce information asymmetry, we estimate the marginal effect of disclosure on liquidity and price efficiency as sector crowdedness increases. FH propose that firms facing limited investor
resources disclose more than they would disclose in an unconstrained environment. Since some of
the disclosure in a crowded sector is excessive, disclosure improves liquidity and price efficiencyless
in more crowded sectors. In less crowded sectors, firms have incentives to disclose only to reduce information asymmetry. This proposition implies that the marginal unit of disclosure will impact liquidity and price efficiency less when disclosure is motivated by investor-seeking, that is when firm-sector comovement is higher. Our analysis models liquidity and price efficiency as a function of guidance, consistent with the existing literature, and also includes an interaction term between guidance and firm-sector comovement.
3
Model and Variable Specifications
To test the association between sector crowdedness and firm-level guidance decisions, we estimate
OLS models of the existence and frequency of management forecasts by firmiin quarterq on
firm-sector comovement of firmiin quarter q−1 (Comoveiq−1) as follows:
Yiq=α0+α1Comoveiq−1+ Γ0cControlsiq−1+iq, (1)
where the dependent variable is one of several firm-quarter forecast measures described below. We lag firm-sector comovement by one quarter to control for the possibility that forecast issuance
can reversely cause changes in comovement. Γc is a vector of coefficient estimates on the control
variables. Standard errors are clustered at the firm level.
As a benchmark, we estimate the model without fixed effects. Throughout the paper, the
primary specification includes control variables (raw and industry-adjusted as described below), firm fixed effects, and fixed time (year-quarter) effects to control for time trends in comovement and disclosure.
3.1 Management forecasts
Our dependent variables are the existence and frequency of different types of management fore-casts. We obtain management forecasts issued between January 2003 and December 2016 from
I/B/E/S Guidance.10 We choose 2003 as the start year because I/B/E/S started collecting guid-ance data in 2003.
We assign management forecasts from I/B/E/S Guidance into each quarter by comparing the forecast announcement dates with firms’ fiscal quarter end dates from the Compustat Quarterly File.
Following Anilowski et al. (2007), we exclude forecasts issued just after the firm’s corresponding
fiscal quarter end date because these forecasts are likely to be pre-announcements of quarterly results instead of informative guidance. The dataset includes forecasts of all types (e.g., mainly earnings, sales, capital expenditures), horizons (forecasts for the forthcoming and future quarters), and frequency (annual and quarterly).
We construct the following forecast variables. The existence of management forecasts (Guide) equals one if management issues at least one forecast between the previous quarter end date and the current quarter end date. The number of management forecasts (N um Guide) is the natural logarithm of one plus the total number of forecasts issued between the previous quarter end date
and the current quarter end date. Capex F cst is the existence of at least one capital expenditure
forecast, and N um Capex F cst is the natural logarithm of the number of capital expenditure
forecasts. Capital expenditure forecasts are conceptually closer to the notion of a signal inFishman
and Hagerty(1989) that, if studied in the context of the firm’s full set of available information, can
increase the precision of an investor’s estimate of firm value. We also compute the natural logarithm of one plus the total number of unique types of forecasts (N um F cst T ypes). In addition, we present the main results separately for forecasts with a horizon longer than a year (Long Horizon), forecasts for the next quarter (Short Horizon), and sales forecasts (Sales F cst).
3.2 Firm-sector return comovement
We operationalize the concept of sector crowdedness with a firm-quarter measure of a stock’s return comovement with other firm’s returns in the same industry. This measure captures asset substitutability by measuring the degree to which the stocks in a sector have similar responses to
10
Chuk et al. (2013) question the validity of classifying firm disclosure decisions using CIG (Company Issued Guidance) data and find that CIG does not correctly record the frequency of guidance. The data from I/B/E/S Guidance is an upgrade from CIG. The likelihood of guidance using I/B/E/S Guidance is similar to the hand-collected sample ofChuk et al.(2013).
common shocks. We estimate the model using daily stock returns for firmiin quarterq as follows:
Retiqt=αiq+βiq,−1IndRetjqt−1+βiq,0IndRetjqt+βiq1IndRetjqt+1+iqt,
where Retiqt is the daily stock return of firm i on day t of quarter q and IndRetjqt is the
value-weighted stock return of industryjon daytof quarterq, excluding firmi’s own stock return. Leads
and lags of IndRet are included to control for potential infrequent trading bias. The regression
requires a minimum of 50 daily stock return observations for a firm quarter. Firm-sector comovement is:
Comoveiq= log(1 + Riq 2 1−Riq2
),
whereRiq2 is the adjusted R squared of each regression. A higher comovement value means that a
firm’s stock return is more correlated with the industry returns. Comoveiq is set to zero whenever
the adjusted R squared is negative, which is equivalent to negligible predictive value of the regression.
3.3 Control variables
Our regression models include control variables for factors that prior research has determined are associated with disclosure choice. We draw the most comprehensive list based on a recent
review of the guidance literature (Hirst et al.,2008), and we follow their framework to classify the
determinants of management forecast decisions into forecast environment variables and forecaster characteristics. We construct these variables using data from the Compustat Quarterly File, CRSP, and I/B/E/S Detail History.
3.3.1 Forecast environments
InHirst et al.(2008) the forecast environment includes the regulatory environment as well as the
firm’s analyst and investor environment. Because our sample starts after Regulation FD and SOX, the regulatory environment stays relatively stable. Nevertheless, we include calendar year-quarter
fixed effects to control for common trends (Lang et al.,2012).
The model includes controls for analyst following and institutional ownership. Prior studies find a positive association between analyst following and institutional ownership and the existence
and frequency of management forecasts (e.g. Healy et al., 1999; Bushee and Noe, 2000; Ajinkya
et al., 2005). Following Ajinkya et al. (2005), we measure analyst following (Analyst f ollowing)
as the number of analysts that make a forecast for firm i during quarter q−1, and institutional
ownership (Inst holdings) as the percentage of institutional ownership of firm i during quarter
q−1. Controlling for these variables reduces an omitted correlated variable bias given that prior
literature also finds an association between return synchronicity and institutional ownership and
analyst following (Piotroski and Roulstone, 2004; Chan and Hameed,2006; An and Zhang, 2013;
Hameed et al.,2015;Israelsen,2016).11
3.3.2 Forecaster characteristics
Forecaster characteristics include information asymmetry, pre-commitment to forecasts, litiga-tion risk, managerial incentives, prior forecasting behavior, and proprietary costs including product
market competition (Hirst et al.,2008).
Information asymmetry. Information asymmetry reduction is the commonly explored
mo-tive for voluntary disclosure, with the predicted consequence being higher liquidity (e.g.,Diamond
(1985), Diamond and Verrecchia (1991)). Empirical evidence finds that higher information
asym-metry is positively associated with the likelihood of guidance (Coller and Yohn,1997;Balakrishnan
et al.,2014;Billings et al.,2015).12 The information asymmetry motive is not one that we attempt
to rule out, but rather one that co-exists with the investor-seeking motive for issuing guidance. We control for information asymmetry in the model so that we can measure the incremental ex-planatory effect of sector crowdedness on guidance. We use return volatility (Return volatility) of
the previous quarter to capture a firm’s information environment (Nagar et al.,2003;Chen et al.,
2011a). We also control for the market to book ratio (M arket−to−book) and leverage (Leverage)
atq−1to account for information asymmetry that arises from firms’ growth opportunities (Bamber
and Cheon,1995;Ajinkya et al.,2005).
Pre-commitment to forecasts. One factor that leads to more frequent/regular forecasts is
firm performance. Miller(2002),Chen et al.(2011a), andHouston et al.(2010) document a positive
11
Veldkamp(2006) predicts that the existence of information markets in which investors pay for analysis will lead to higher return synchronicity when the cost of information is fixed. Investors purchase information with valuation implications for multiple firms.
12
Waymire (1985), for an earlier time period, found a lower likelihood of management forecasts as information asymmetry increases, which he attributes to the difficulty of forecasting.
relation between the likelihood of disclosure and performance. We measure firm performance using
return on assets (ROA) of firm i in quarter q−1 and we include an indicator variable if quarter
q−1is a loss quarter (Loss). We also control for earnings surprise (EarningsSurprise), consistent
with prior research showing that firms’ discretionary disclosure decisions are associated with the
size of an earnings surprise (Kasznik and Lev,1995).
Litigation risk. A large literature documents a positive relation between management forecast
decisions and litigation risk (e.g.,Skinner,1994;Field et al.,2005). Hirst et al.(2008) identify four
factors that affect litigation risk: “(1) firm size, (2) variability of returns, (3) impending negative news that leads to a large drop in stock price, and (4) industry membership.” We control for firm
size (Size) using one plus the natural logarithm of the total assets of quarterq−1(Feng and Koch,
2010). Variability of returns and news are controlled for by return volatility and firm performance,
respectively. Industry membership is implicitly controlled for by including firm fixed effects. We do not additionally control for impending negative news; we expect our other control variables such as ROA and earnings surprise and the fixed effects are adequate.
Product market competition. Studies find mixed evidence on measures of product market
competition and guidance. Rogers and Stocken (2005) find that firms in more concentrated
indus-tries (a proxy for proprietary costs) issue more pessimistic forecasts to deter entry. Wang (2007)
finds that R&D expenditure scaled by total assets is negatively related to the likelihood of
manage-ment forecast decisions. Ajinkya et al. (2005), however, find no relation between a firm’s forecast
decisions and proprietary costs, proxied by the market-to-book ratio. Li(2010) argues that the
ef-fect of competition on disclosure depends on the nature of the competition. She finds that existing rivals decrease guidance but potential entrants increase it. The model includes the market-to-book ratio, a proxy for a firm’s growth opportunities, to capture the time-varying element of proprietary costs. In untabulated analysis, we find that our results are robust to the inclusion of an industry Herfindahl index as an alternative measure of proprietary costs that arise from product market competition.
Managerial incentives. Studies document that equity based compensation affects the likeli-hood of forecasting because it increases managers’ incentives to boost short-term stock price (e.g.
Nagar et al.,2003). Despite the potential relevance to disclosure, there is no evidence that
including control variables for incentives as control variables. Moreover, managerial incentives are driven by firm news and the information environment, which are captured by our existing control
variables, such as firm performance (ROA and Loss), firm size, return volatility, and the fixed
effects (Nagar et al.,2003;Aboody et al.,2005). We therefore do not control for managers’ equity
based compensation directly.
Prior forecast behavior. Hirst et al.(2008) define prior forecast behavior as historical forecast accuracy and tendency to meet or beat analyst forecasts. We do not control for historical forecast accuracy because computing historical forecast accuracy requires firms to have issued forecasts in the past, which will impose a selection bias. We believe our overall controls for the information environment and the fixed effects are adequate.
3.4 Descriptive statistics
Our sample consists of 183,884 firm-quarter observations from 2003 to 2016 with non-missing variables. The sample excludes firms in the utility and financial services industries. We obtain management forecast data from I/B/E/S Guidance. Financial variables are from Compustat and CRSP.
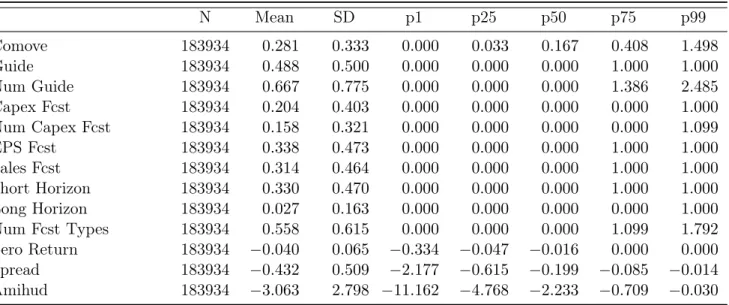
Table 1summarizes the distribution of the variables used in our empirical analysis. As reported
in Panel A, average firm-sector comovement is 0.28 with a standard deviation 0.33, which suggests sufficient variation for the empirical analysis. Approximately 49% of firm-quarter observations in our sample issue some form of management forecast. Earnings forecasts are the most common type (34%), followed by sales forecasts (31%) and capital expenditure forecasts (20%). Short horizon forecasts (i.e., for the next quarter) are more common than forecasts with a horizon longer than a year (33% vs. 2.7%).
[Insert Table 1]
Table 1 Panels B through E report summary statistics for other variables used throughout the
analysis. Raw control variables (Panel B) are adjusted by their industry and year averages (Panel C). Industry-adjusting occurs before we exclude observations with missing data from the sample, thus the sample averages of the industry-by-year adjusted variables can differ from zero. All control variables are winsorized at 1% and 99%.
Table 2 presents averages for the guidance, liquidity, and control variables by comovement
decile.13 The likelihood of providing a management forecast increases monotonically as the
comove-ment of the firm’s return with its industry peers increases. This univariate pattern is consistent with our proposition that sector crowdedness motivates disclosure. Our various measures of liquid-ity (zero return days, bid-ask spread, and Amihud illiquidliquid-ity) have been multiplied by -1 so that a smaller negative amount represents higher liquidity. All three measures increase monotonically in
firm-sector comovement, consistent with Baruch et al. (2007) andLi et al. (2014).
[Insert Table 2]
The univariate patterns are useful for assessingComoveiq as a proxy for correlated fundamentals
(i.e., asset substitutability) that would drive firms to compete for investors. The analysis also provides evidence to assess whether comovement is positively related to information asymmetry as
inMorck et al.(2000) or positively related to information transparency and lower adverse selection
as described in Chan et al.(2013) and Baruch et al.(2007). The results offer suggestive evidence
that, if anything, comovement is related to a better firm information environment, instead of a lack of firm-specific information in price. For the control variables, larger, better-performing and less volatile firms, and firms with higher institutional ownership and analyst following have higher sector comovement. These patterns are inconsistent with comovement as an inverse measure of firm-specific information in price. The patterns are consistent with studies that show that comovement of asset returns can attract more informative order flows and increase liquidity. These variables are included as controls in the disclosure model given their relations with both comovement and disclosure. Hence, we interpret an effect of comovement on guidance as incremental to the effect of information asymmetry.
Figure 1 plots the distribution of firm-sector comovement across one-digit SIC industries
ex-cluding the financial service and utility industries. Consistent withMinton and Schrand (2016), we
find that mining and construction industries have the highest median comovement (SIC=1). Min-ing and construction industries are subject to common economic shocks such as commodity price
movements. The descriptive evidence is consistent with our interpretation thatComoveproxies for
correlated economic fundamentals. 13
Because return comovement = 0 for greater than 10% of the observations, we combine observations in the first and second deciles.
[Insert Figure 1]
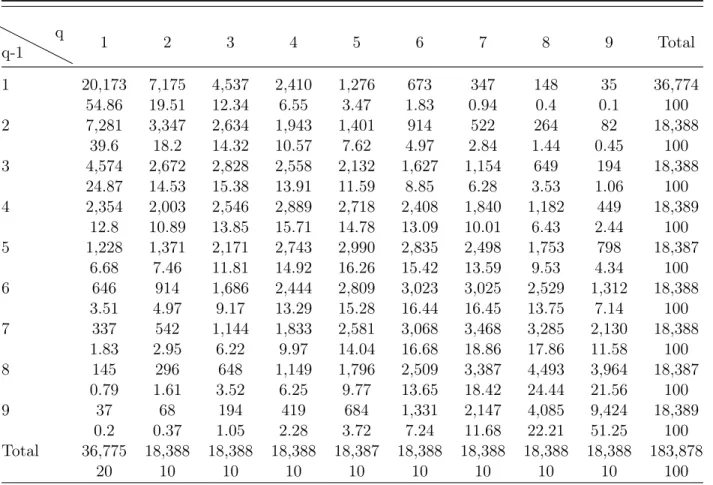
Table3is a quarter-to-quarter transition matrix ofComove, which shows the persistence of
firm-sector comovement. The columns represent comovement deciles in quarterq and the rows represent
comovement deciles in quarterq−1. Twenty percent of the observations appear in decile 1 because
greater than ten percent of the observations had comovement measures that were indistinguishable from zero. Each cell contains (1) the number of observations in a particular comovement decile combination (top) and (2) the percentage of observations in a particular comovement decile in
quarterq among all the observations in the comovement decile in quarterq−1 (bottom). The sum
of the percentages in each row is 100. The higher percentages (or number of observations) in the diagonal line indicate that quarterly firm-sector comovement is persistent. However, time variation exists, which can be seen from the off-diagonal elements. The time variation allows us to identify the effects of a crowded sector using a within-firm specification, which helps to mitigate concerns about various omitted correlated variables.
[Insert Table 3]
4
Results: Disclosure Choice
We first examine the association between sector crowdedness, proxied by Comove, and the
likelihood and frequency of management forecasts in Section4.1. In Section4.2, we explore several
alternative explanations for the results. In Section 4.3, we analyze cross-sectional variation in the
sensitivity of disclosure to comovement as a function of firm and industry-level factors that vary exposure to competition for limited investor resources.
4.1 Forecast likelihood and frequency
Table 4 Panel A documents the effects of firm-sector comovement in quarter q −1 on the
likelihood and frequency of management forecasts in quarter q using model (1). Columns (1)-(4)
report results using the existence of management forecasts in quarter q as the dependent variable
and different combinations of fixed effects and control variables. Standard errors are clustered by firm for all specifications.
The coefficient estimate onComovein column (1) is 0.417. Including firm and year-quarter fixed effects and control variables decreases the coefficient to 0.048 in the model with control variables (column 3), and 0.051 in the model with raw and industry-adjusted control variables (column 4), both statistically significant. Because we include firm fixed effects, it is not surprising that adding industry-adjusted control variables has little impact on the coefficient estimates or significance levels. We use the model with industry-year-adjusted control variables (plus raw control variables and firm and year-quarter fixed effects) as our main specification going forward. Based on the coefficient estimate from column (4), a one standard deviation increase in comovement (0.33) is associated with 1.68 percentage point (0.33*0.051) higher probability of issuing a management forecast. The economic magnitude is small relative to the unconditional likelihood of management forecasts (0.49). Column (5) reports results using the natural logarithm of the total number of management
forecasts in quarterqas the dependent variable and includes the full set of raw and industry-adjusted
control variables and fixed effects. A one standard deviation increase in firm-sector comovement (0.33) is associated with a 2% (0.33*0.06) increase in the number of management forecasts.
[Insert Table 4]
Panel B models capital expenditure forecasts. Both the likelihood and number of capital expen-diture forecasts increase with sector crowdedness. A one standard deviation increase in comovement is associated with a 1.81 percentage point increase in the likelihood of issuing capital expenditure forecasts. Given the unconditional likelihood of 20%, the effect of comovement on capital expen-diture forecasts is more dramatic than for total forecasts. A one standard deviation increase in comovement is associated with a 1.49% increase in the number of capital expenditure forecasts (column 5).
Table 4 Panel C reports results for the other forecast variables. Column (1) shows that the
likelihood of EPS forecasts responds less to changes in comovement than does the likelihood of capex forecasts. A one standard deviation increase in comovement is associated with a 0.83 percentage point increase in the likelihood of an EPS forecast. The economic magnitude is small relative to the unconditional likelihood of 34%. Similarly, a one standard deviation increase in comovement is associated with a 1.1 percentage point increase in sales forecasts, again a small effect compared to capital expenditure forecasts and the unconditional likelihood of 31%. The relative strength of the economic effect of sector crowdedness on capital expenditure forecasts compared to EPS and sales
forecasts is consistent with our conjecture that capital expenditure forecasts are the most likely to
increase the precision of traders’ estimates of value in the sense ofFishman and Hagerty (1989).
Columns (3) and (4) show that the results hold for both long and short horizon forecasts. This
result sheds light on the difference between our findings and those in Gong et al. (2013). They
document that firms withless earnings synchronicity issue more long term guidance. At first their
findings seem to contradict our findings, as we predict and find that firms withhigher comovement
issue more forecasts. Their result holds only for long horizon forecasts, which are a small element of total forecasting behavior. In addition, instead of return synchronicity, they examine earnings (non) synchronicity, which is measured using earnings before extraordinary items. Nonrecurring items are included in their earnings measure. Thus, their earnings synchronicity measure could be capturing firm quarters with large negative one-time items, which motivate the firm to issue a long horizon
forecast based on only the persistent component of earnings. Gong et al. (2013) do not separately
examine capital expenditure forecasts.
The signs on the control variables are consistent with reported patterns in prior studies. Better
performance (based on ROA and Loss), lower return volatility, higher growth, greater analyst
following and institutional ownership, and better news are associated with a higher likelihood and
number of management forecasts. When using capital expenditure forecasts as the dependent
variable, loadings on the control variables are similar except that the loadings on firm performance, return volatility, and earnings surprise are not significant.
4.2 Alternative explanations and robustness tests
The finding that capital expenditure forecasts are increasing in firm-sector comovement could be explained by a correlation between comovement and actual capital expenditures. That is, high-comovement firms could have greater capital expenditures on average to issue guidance about. We examine this possible confounding effect by estimating equation (1) controlling for the level of capex, where capex is defined as capital expenditure scaled by lagged total assets. The coefficient on comovement remains similar (untabulated).
A second alternative explanation we consider is that industries with higher comovement also have lower proprietary costs of disclosure. Our results are robust to controlling for firm, year-quarter, and industry-by-quarter fixed effects. To the extent that the level of competition is mainly
cross-sectional, the fixed effects structure mitigates the competition explanation. In addition, our results are robust to controlling for product market competition, measured using an industry Herfindahl index (untabulated). Finally, this argument likely applies more to capital expenditure forecasts than to forecasts of earnings that will be released in the forthcoming financial reports within a quarter at most. Our results are concentrated in capital expenditure forecasts, where we expect the proprietary costs to be higher, which is not consistent with this argument.
Finally, in untabulated analysis, we estimate the regressions with lagged peer firm disclosures. Disclosure by a peer firm could inform investors about the firm’s private information endowment, which affects traders’ beliefs about the non-disclosing firm and results in return comovement. We find that the comovement-guidance association is incremental to the effects of lagged peer
disclo-sures.14
One potential concern in our model specification is that the panel data analysis hides the effects of a few major shocks to high comovement industries, and the firms’ correlated responses to the shock drive the results. The model includes industry-adjusted control variables, which should mitigate this concern. In addition, we estimate the model including industry-by-year fixed effects, which absorb time varying industry specific shocks, and find similar results (untabulated). Finally, we
estimate the model by year. The untabulated results for Capex F cst are positive and significant
beginning in 2005 (not 2003 or 2004) and remain significant through 2016.15 The results forGuide
are significant and positive in 2008 - 2016. The consistency of the results across the years also helps to alleviate concerns about asymmetric synchronicity, which has been documented to be higher
during down markets compared to bull markets (e.g., Ang and Chen,2002).
4.3 Predictable cross-sectional variation
In the FH model, all firms are identically motivated to compete for informed investors to improve price efficiency. In reality, firms face varying incentives to disclose and attract the limited resources of investors. We separately examine firm characteristics and industry characteristics that affect the incentives of firms in a crowded sector to differentiate themselves from their peers in the following sections.
14The cross-sectional tests in the next section are also robust to inclusion of lagged peer firm guidance. 15
Two studies note a disruption to guidance practice in 2003 following Coca Cola’s announcement that it would stop issuing earnings guidance (Chen et al.,2011b;Houston et al.,2010).
4.3.1 Firm characteristics
We predict that larger firms and firms with greater analyst following have less incentive to disclose to attract investors. Because greater amounts of accessible information are generated about these firms by external parties, investors have greater incentives to study larger, well-followed firms within a sector relative to their smaller and less-followed peers. Even absent disclosure by the firm, the cost of studying these firms is lower. Assuming disclosure is costly, larger, well-followed firms will have less incentive to use guidance to compete for investors. We predict a smaller cross-sectional effect of size and analyst following on the sensitivity of capex guidance to crowdedness, assuming that capex guidance provides more unique information than earnings guidance. Hence, their disclosure decisions are expected to be less responsive to sector crowdedness.
The next two firm-level cross-sectional variables capture the firm’s exposure to competition for investors. First, we measure the within-firm variation in the percentage of institutional ownership (Inst SD). Greater volatility of institutional ownership should imply more exposure to competition
for investors, and we expect the disclosure decisions of firms with greater Inst SD to be more
sensitive to sector crowdedness. Second, firms that are in the S&P 500 have lower incentives to use
costly disclosure to attract investors. The evidence inBarberis et al.(2005) suggests that investors
view stocks in the S&P 500 as an investment category,16 hence firms in the index have less need
to attract more investors and their disclosure decisions are expected to be less responsive to sector crowdedness.
Table 5 presents cross-sectional results conditional on industry-year firm size and analyst
fol-lowing; the within-firm standard deviation of institutional ownership; and S&P 500 index inclusion.
We predict a negative coefficient estimate on the interaction of Comove with firm size, analyst
following, and S&P 500 inclusion since such firms are less motivated to use disclosure as a tool to
compete for investors, and a positive coefficient estimate on the interaction of Comove with the
16
Barberis et al.(2005) examine the comovement between a stock’s return and the S&P 500 return after the stock’s inclusion in the index. They find a significant increase in the stock’s beta. Given that fundamentals are unlikely to change upon index inclusion, they interpret their findings as evidence that sentiment-driven demand for a particular habitat (i.e., the S&P 500) explains a stock’s comovement with the stock’s category. Their results are consistent with category investing, as assumed in our analysis. Although they claim that their findings "...cannot easily be explained by the fundamentals-based view of comovement", their evidence on S&P 500 index inclusions does not provide evidence – either for or against – on our firm-sector comovement measure as a proxy for asset substitutability within a sector.
within-firm standard deviation of institutional ownership.17 Columns (1), (3), (5), and (7) report
the regression results using Guide as the dependent variable; columns (2), (4), (6), and (8) report
results for Capex F cst. The models include raw and industry-adjusted control variables and firm
and calendar year-quarter fixed effects. The interaction terms in all cases have the predicted signs
and are statistically significant: when firms are smaller, with fewer analysts,not in the S&P 500, or
with high time-varying institutional holdings, their disclosures are more sensitive to sector crowd-edness. These firm characteristics moderate the effect of return comovement on a firm’s guidance decision. In all cases, incentives to compete play less of a moderating role for capital expenditure forecasts.
[Insert Table 5]
4.3.2 Industry characteristics
Our second set of cross-sectional predictions conditions on industry-level characteristics. We first predict that firms in industries with higher comovement are more exposed to competition for
investors. We use two variables to measure industry-level comovement. High Comove SIC is an
indicator variable equal to one if the median comovement of a two-digit SIC industry is in the
upper quartile for all two-digit SIC industries, and zero otherwise. % High Comove is a
time-varying measure of industry-level comovement that equals the percentage of firms in a two-digit SIC industry-quarter whose comovement is higher than the median comovement of the full sample.
[Insert Table 6]
Table6columns (1) through (4) present the results. For both measures of the absolute magnitude
of industry-level comovement, the interaction term is positive and significant.18 These results are
consistent with our proposition that the effect of comovement on disclosure is related to competition for investors, which becomes more fierce as sector crowdedness increases.
We also examine exposure to competition for investors using classifications based on observed
trading activity (Bushee, 1998): dedicated owners, quasi-indexers, and transient investors.
Dedi-17
For columns (1) through (4), the main effect (firm size or analyst following) is included with the control variables, as described previously. For columns (5) and (6), the main effect is redundant with the firm fixed effects and is excluded from the model.
18
The main effect ofComoveis negative in column (4). This coefficient represents the case in which%High Comove
= 0, which is less than the 1st percentile (see Table 1, Panel D). The main effect therefore reflects an extreme case and should not be interpreted alone.
cated owners have large, long-term holdings, concentrated in a small number of firms, and are more likely to gather private information about a firm and directly monitor its managers. Quasi-indexers tend not to rely heavily on private information and adopt a passive monitoring style. Transient in-vestors hold small stakes in many firms and trade frequently on publicly available information, but they do not generally acquire private information. We assume that quasi-indexers are most likely to behave as category investors, choosing to study and trade a subset of stocks within a particular sector. Hence, we predict that firms in industries with high percentages of quasi-indexers are the most likely to use disclosure to compete for investors. Firms in industries dominated by dedicated investors are unlikely to need to use costly disclosure to compete. We use transient investors as the baseline. We create two industry-quarter variables for the percentages of firms in a two-digit SIC industry-quarter whose proportions of dedicated (DED) and quasi-indexer (QIX) institutional
holdings are higher than the corresponding full sample medians.19
The last two cross-sectional covariates focus on institutional investors. The models that predict
category learning and investing as an optimal choice (Peng and Xiong,2006;Van Nieuwerburgh and
Veldkamp,2010) predict that investors with greater information processing capacity (i.e., less
con-strained) will engage in specialized information acquisition about common risk factors and allocate more wealth to the “learning” portfolio. Assuming institutions are less constrained than individ-ual investors, institutions should engage in sector investing and choose among assets in the sector. More constrained investors should focus on generalized learning and invest in the market portfolio. Prior empirical evidence also suggests that firms compete for the attention of institutional investors
(Bushee and Noe,2000).
Table 6 columns (5) and (6) present results using Guide and Capex F cst as the dependent
variables. The coefficient estimate on the interaction between DED and Comove is negative and
significant. This finding is consistent with the proposition that guidance would not be an effective tool to compete for investors when the industry is exposed to higher levels of dedicated investors.
In such cases, the costs of disclosure would outweigh the benefits.20 The coefficient estimate on the
interaction term of Comove with a measure of exposure to quasi-indexers, in contrast, is positive
19We thank Brian Bushee for making the institution classification data available on his website:
http://acct.wharton.upenn.edu/faculty/bushee/IIclass.html).
20
The main effect ofComoveis negative in column (6). This coefficient represents the case in which the proportion of dedicated investors in the industry (%High DED) equals 0.
and significant. This variable represents industry-quarters in which quasi-indexers were trading more heavily in the sector, and quasi-indexers are more likely to be category investors that choose among substitutable securities in a sector.
Overall, the evidence in Table6suggests that the response of firm guidance to sector crowdedness
increases in periods when the firms’ exposures to competition for investors are predicted to be the highest.
5
Results: Disclosure Consequences
Our first analysis examines the joint effects of sector crowdedness and guidance on three proxies for firm liquidity. The effect of management guidance on liquidity is well documented, but our evidence now shows that disclosure is endogenously related to sector crowdedness, measured by firm-sector comovement. If return comovement is related to liquidity, then our finding raises a question about a form of reverse causality in the documented disclosure-liquidity relation. Prior literature has linked return synchronicity to liquidity, both theoretically and empirically, suggesting that higher return synchronicity makes the price of an asset less sensitive to its own order flows and
attracts both liquidity and informed traders (Chan et al.,2013;Baruch et al.,2007). In other words,
return synchronicity begets liquidity. Thus, one reason for examining the direct relation between comovement and liquidity is to estimate whether the comovement-liquidity relation partially explains the disclosure-liquidity relation.
The analysis also recognizes that information asymmetry reduction and competition for investors are not mutually exclusive motives for disclosure choice. The FH model predicts excessive disclosure – more than is socially optimal – when firms compete for limited investor resources, but the disclosure nonetheless increases precision. Since our findings in the first part of the paper suggest that more of the guidance in crowded sectors is issued for investor-seeking purposes, we predict that the impact of disclosure on liquidity will decrease as sector crowdedness increases. In summary, we expect that
sector crowdedness has a direct effect on liquidity, consistent with prior literature (Chan et al.,
2013). We also expect that guidance has a direct effect on liquidity, as documented in the prior
literature and consistent with theory (e.g. Diamond, 1985; Diamond and Verrecchia, 1991). Our
other and whether the effect of crowdedness moderates the previously documented effect of guidance on liquidity. The moderation prediction is important because it is unique to our proposition that firms disclose to compete for investors. The information asymmetry reduction proposition does not predict a marginally decreasing effect of guidance on liquidity as sector crowdedness increases.
We model liquidity as follows:
Liquidityiq =β0+β1Comoveiq−1+β2Guideiq−1+ Γ0cControls+ηiq, (2)
whereLiquidityiq represents one of three liquidity measures for firm iin quarter qdescribed below,
and Guideiq−1 equals one if a firm provided a forecast in quarter q −1 and zero otherwise. We
estimate the model with only Comove and Guide, each with a one quarter lag. We also estimate
the model with these main effects plus an interaction term between Guide and Comove. Γc is a
vector of coefficient estimates on the control variables. Following prior studies on liquidity (Leuz
and Verrecchia,2000;Balakrishnan et al.,2014), we control for firm size, return volatility, S&P 500
membership, and institutional ownership. We also control for firm stock price because similarly
priced stocks tend to move together (Green and Hwang,2009) and the level of stock price can also
affect liquidity (Heflin et al., 2005). In all specifications, we add firm and calendar year-quarter
fixed effects. The standard errors are clustered at the firm level.
The three measures of liquidity are the percentage of zero return days out of all trading days with
positive trading volume, bid-ask spread, and the price impact of trade (Amihud, 2002). Because
these variables are highly skewed, we take the natural logarithm of one plus the variable. We then multiply them by minus one so that higher values indicate higher liquidity.
[Insert Table 7]
Table 7 Panel A presents estimates of the main effects of Comove and Guide. Firm-sector
comovement and management forecasts both have positive effects on liquidity, which confirm the results from studies of disclosure and liquidity and studies of return synchronicity and liquidity (e.g.
Leuz and Verrecchia,2000;Chan et al.,2013). When both Comoveand Guideare included in the
regression, the coefficient estimates for each variable are similar to those when they are separately included in the model. The effects of disclosure and sector crowdedness on liquidity do not subsume
each other.21
Table 8presents our tests for the marginal effects of guidance on liquidity conditional on sector
crowdedness. Across all three measures of liquidity, the effects of guidance on disclosure decrease as sector crowdedness increases. The economic effect is large. Using the estimates in column (3), which controls for firm fixed effects, the marginal effect of issuing a management forecast on bid
ask spread is 0.053-0.093*0.408=0.015 when Comove is at the 75th percentile, a relatively small
effect compared with the full sample mean for bid ask spread of -0.432.22 In contrast, the marginal
effect of issuing a management forecast is 0.050 when Comove is at the 25th percentile, a much
larger effect than that whenComoveis at the 75th percencile. Similar results hold for the marginal
effects of issuing capex forecasts and for using other liquidity measures as the outcome variable. The results confirm the interpretation of our main result that firms disclose to compete for investors at levels that go beyond the effects of disclosure on information asymmetry.
[Insert Table 8]
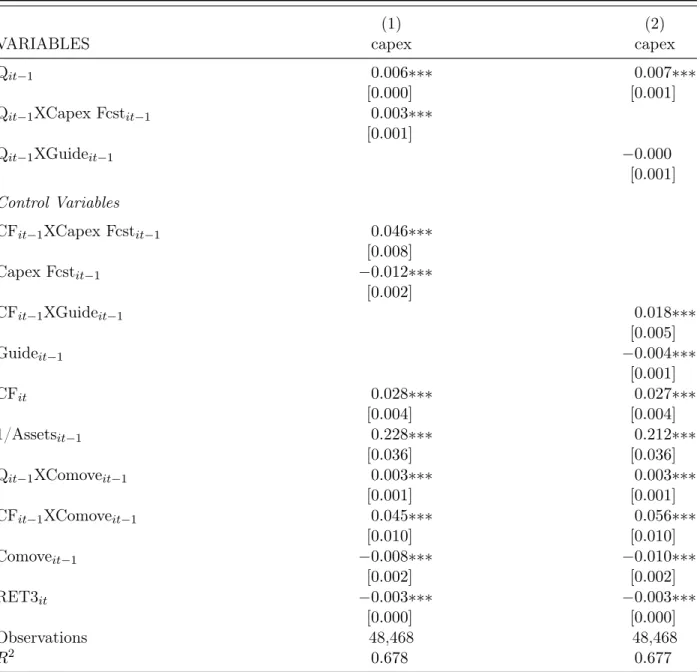
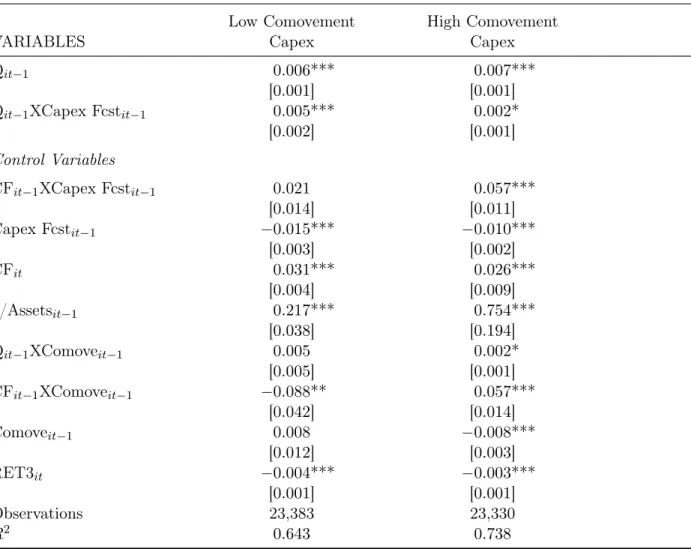
The final analysis examines a second predicted consequence of increasing disclosure – greater
price efficiency. In the model of Fishman and Hagerty (1989), more disclosure attracts investors
to study the firm. The resulting decrease in the noise in the firm’s stock price makes stock price
more sensitive to investment, which in turn increases the incentive to invest. Fishman and Hagerty
(1989) therefore predict that disclosure increases investment-price sensitivity.
A higher investment-price sensitivity is also predicted by a learning channel. Studies interpret a positive association between investment and Tobin’s Q as evidence that management can learn from
an informative stock price.23 This learning channel, although different from the mechanism in the
FH model, similarly predicts that investment-price sensitivity should be higher when price is more
informative. One such study in this literature is Chen et al.(2006), which we have chosen because
they use industry-level return synchronicity as a proxy for price informativeness. They assume that
return synchronicity isnegatively associated with price informativeness based onMorck et al.(2000).
As discussed previously, subsequent studies have questioned the validity of return synchronicity as 21In untabulated analysis, we repeat the estimations excluding firm fixed effects. Excluding fixed effects significantly
increases the coefficient estimates, particularly for the effect of management forecasts on liquidity. The results suggest that the effect of management forecasts on liquidity is mainly cross-sectional rather than time-varying. In contrast, sector crowdedness is an important driver of both within-firm and cross-sectional liquidity, which is consistent with the time variation noted in Table3.
22Recall that the mean bid ask spread is negative because we transform the raw bid ask spread using−log(1 +x). 23