This is the author’s version of a work that was submitted/accepted for
pub-lication in the following source:
Bhatia, Sajal,
Kush, Nishchal
,
Djamaludin, Chris
,
Akande, Ayodeji
, &
Foo,
Ernest
(2014) Practical Modbus flooding attack and detection. In
Param-palli, Udaya & Welch, Ian (Eds.)
Proceedings of the Twelfth Australasian
Information Security Conference (AISC 2014) [Conferences in Research
and Practice in Information Technology, Volume 149]
, Australian Computer
Society, Inc., Auckland University of Technology, Auckland, pp. 57-65.
This file was downloaded from:
http://eprints.qut.edu.au/66228/
c
Copyright 2014 Australian Computer Society, Inc.
This
paper
appeared
at
the
Australasian
Information
Security
Conference(ACSW-AISC 2014),
Auckland,
New Zealand,
January
2014. Conferences in Research and Practice in Information Technology
(CRPIT), Vol. 149, Udaya Parampalli and Ian Welch, Ed. Reproduction for
academic, not-for-profit purposes permitted provided this text is included.
Notice:
Changes introduced as a result of publishing processes such as
copy-editing and formatting may not be reflected in this document. For a
definitive version of this work, please refer to the published source:
Practical Modbus Flooding Attack and Detection
Sajal Bhatia
Nishchal Kush
Chris Djamaludin
James Akande
Ernest Foo
Information Security Discipline, Queensland University of Technology,
Email:{s.bhatia, n.kush, christopher.djamaludin, ayodejijames.akande, e.foo}@qut.edu.au
Abstract
The Modicon Communication Bus (Modbus) proto-col is one of the most commonly used protoproto-cols in in-dustrial control systems. Modbus was not designed to provide security. This paper confirms that the Modbus protocol is vulnerable to flooding attacks. These attacks involve injection of commands that re-sult in disrupting the normal operation of the con-trol system. This paper describes a set of experi-ments that shows that an anomaly-based change de-tection algorithm and signature-based Snort thresh-old module are capable of detecting Modbus flooding attacks. In comparing these intrusion detection tech-niques, we find that the signatubased detection re-quires a carefully selected threshold value, and that the anomaly-based change detection algorithm may have a short delay before detecting the attacks de-pending on the parameters used. In addition, we also generate a network traffic dataset of flooding attacks on the Modbus control system protocol.
Keywords: Modbus, Denial-of-Service (DoS), Change Detection, Intrusion Detection
1 Introduction
Supervisory Control and Data Acquisition (SCADA) systems are used in many industrial sites to remotely monitor and activate motors, pumps and other equip-ment that run water processing plants, factories, re-fineries and electricity substations.
In recent years control systems have been upgraded from the standard serial bus systems to modern Transmission Control Protocol (TCP)/Internet Pro-tocol (IP) based systems. This has resulted in cost savings as standard Information and Communications Technology (ICT) Ethernet cabling can be used, but it has also provided the convenience of allowing these control systems to be connected to existing data net-works. The trade off in this course of action, that is connecting these control systems to the Internet ex-poses them to existing cyber attacks. Traditionally,
This work was supported in part by Australian Research Coun-cil Linkage Grant LP120200246.
Copyright c2014, Australian Computer Society, Inc. This paper appeared at the Australasian Information Security Conference(ACSW-AISC 2014), Auckland, New Zealand, Jan-uary 2014. Conferences in Research and Practice in Informa-tion Technology (CRPIT), Vol. 149, Udaya Parampalli and Ian Welch, Ed. Reproduction for academic, not-for-profit purposes permitted provided this text is included.
control system devices and protocols have not been designed to withstand malicious attacks. It is impor-tant to determine how vulnerable these systems are and how to detect if an attack is being conducted on these systems so that appropriate action can be taken before serious damage occurs.
The published work regarding vulnerabilities and attacks on industrial control systems is grow-ing (Huitsgrow-ing et al. 2008, Morris et al. 2013). How-ever, to the best of our knowledge, there is currently no work in the public domain that practically demon-strates such attacks and their detection. This paper concentrates on the common Modicon Communica-tion Bus (Modbus) control protocol that has been adapted to run over TCP/IP. It has not been de-signed to provide any security properties, therefore it is vulnerable to many types of attack. This pa-per focuses on flooding attacks as they are the easiest attack to conduct on a SCADA system. The work also explores different detection techniques that can be used to identify when an attack is being conducted. The contribution of this paper is two-fold. Firstly, we show that it is possible to use flooding attacks to suc-cessfully subvert a control system using Modbus. Sec-ondly, we show that the anomaly-based change detec-tion algorithm and the signature-based Snort thresh-old module are capable of detecting a Modbus flood-ing attack. Additionally, we also provide a set of ex-periments that results in a network traffic dataset of flooding attacks on the Modbus control system proto-col. These datasets can be used to validate a variety of intrusion detection algorithms.
This paper is divided into seven sections. Section 1 introduces the paper and gives a brief description of the existing Modbus over TCP protocol. Section 2 reviews related work on Modbus vulnerabilities and attack detection. Section 3 describes the flooding attack and the software that was developed to suc-cessfully conducted the attack on our experimental system. Section 4 introduces the theory behind the two intrusion detection mechanisms that are used to detect the flooding attacks. Section 5 describes the experimental methodologies used to generate a range of datasets that we present and analyse in Section 6. Section 7 concludes the paper.
1.1 Modbus
Devices connected using the Modbus protocol com-municate with each other using a master-slave or server-client configuration (Modbus Organization Inc. 2006). The master device controls all the activities such as the transmission and monitoring. It initiates the queries while the connected devices or slaves, re-spond to the queries. For this reason, the Modbus protocol is referred to as a single master protocol. The
Figure 1: Modbus/TCP ADU Message Structure
master device can either send a broadcast message to all connected and configured slave devices, or poll a slave device individually (Modbus Organization Inc. 2006).
Modbus packets also have function codes which specify the type of operation requested. Every Modbus device has a register map of functions that are used to monitor, configure and control module in-put/output. There are two main variants of Modbus protocol, Modbus Serial and Modbus/TCP. For this paper, we will focus on Modbus/TCP, and for the remainder of this paper references to Modbus mean Modbus/TCP.
Modbus is a communication protocol designed to allow communication of industrial equipment such as computers, sensors, Programmable Logic Controllers (PLCs) and other physical input/output devices over the IP/Ethernet network. TCP/IP and Ethernet are used in carrying Modbus message structure. Modbus is a protocol embedded inside the TCP/IP frames of Ethernet (Modbus Organization Inc. 2006). Figure 1 depicts the structure of a Modbus IP Message known as Modbus Application Data Unit (ADU).
The message structure of Modbus ADU is shown in Figure 1, and is divided into two parts (Morris et al. 2013). The first, is the Modbus Application Protocol (MBAP) Header, which consists of:
1. Transaction Identifier (2 bytes) - Used for syn-chronisation between server and client messages. 2. Protocol Identifier (2 bytes) - Set to 0 for
Modbus, for potential future use.
3. Length Field (2 bytes) - Used to define the num-ber of remaining bytes in this message structure. 4. Unit Identifier (1 byte) - Slave address of de-vice the message structure is to be sent to. For Modbus, address of slave device is the IP address and therefore the Unit Identifier is set to 0xFF. The second part of a Modbus ADU message is a typ-ical Modbus Protocol Data Unit (PDU) message. It consists of:
1. Function Code (1 Byte) - Modbus supported functions.
2. Function Data (n bytes) - Data accompanying the Function Code as a response or command. 2 Related Work
This section provides an overview of previous work undertaken on Modbus, and Intrusion Detection Sys-tem (IDS) for Modbus protocols. The Modbus pro-tocol provides no security for messages. Messages are passed in the clear providing no confidentiality, or message integrity (Modbus Organization Inc. 2006).
Huitsing et al. (Huitsing et al. 2008) provides a compilation of attack taxonomy on the Modbus pro-tocol, with the analysis focusing on Modbus serial and TCP protocols. According to the research, the corresponding targets include the master, field device slaves, network communication links and messages. Huitsing et al. outlines that Modbus attacks consist
of protocol specification attacks, which are common to all Modbus implementations. A total of 28 at-tacks were identified for Modbus protocols. Some of these attacks include spoofing, Modbus network scan-ning, baseline response replay, and direct slave con-trol. Modbus flooding attack was not included in the list of attacks presented in Huitsing et al.. Further-more, the paper does not discuss any practical analy-sis of the attacks.
Queiroz et al. (Queiroz et al. 2009) conducted a security evaluation on a simulated water treatment SCADA system using a Distributed Denial-of-Service (DDoS) attack. The work demonstrated how mali-cious attackers have the ability to disrupt the con-trol and operation of a SCADA system using Modbus. The main aim of the work by Queiroz et al. was to propose a testbed architecture, and only a DDoS at-tack was discussed with no form of detection mecha-nism discussed.
To detect flooding attacks on the Modbus proto-col, an IDS may be employed. An IDS is a software or hardware mechanism that detects misuse or unautho-rised actions (Mell 2001). An example of a network IDS is Snort. Cheung et al. (Cheung et al. 2007) de-veloped a model based detection approach for moni-toring Modbus networks using Snort. More recently, Morris et al. (Morris et al. 2013) provided a set of 50 signature for Modbus and Modbus over serial links. These rules were developed to detect malicious activ-ities on industrial control systems using the Modbus protocol specifications. However, no practical analy-sis or implementation of these rules were presented by Morris et al..
With Modbus as the de facto industrial commu-nications protocol, and its widespread application in SCADA systems, an analysis and evaluation of Modbus flooding attacks is still considered an open problem. We focus on Modbus, and the use of anomaly-based, and signature-based detection tech-niques, to detect the onset of malicious activity aiming to disrupt normal operational control. We implement and analyse flooding specific rules and attacks on the Modbus protocol.
3 Modbus Flooding Attack
Modbus flooding attack is defined as one where the attacker is able to inject packets into the local net-work connecting the Human Machine Interface (HMI) and the control system and disrupting its normal op-eration. The attacker does not attempt to prevent messages from reaching the control system, it merely sends a larger than normal number of messages with selected function codes. The aim of the attacker is to control the system through this flood of messages and to effectively drown out legitimate commands from the HMI.
The Modbus protocol is particularly susceptible to this type of attack because the messages in the Modbus protocol do not include any authentication mechanisms that will allow the detection and rejec-tion of injected false packets. Modbus messages also do not have any inherent checksum or integrity check-ing mechanisms, so it is much easier for the attacker
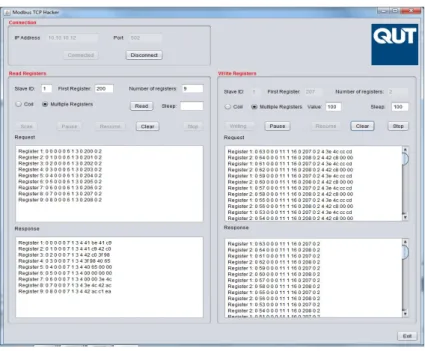
Figure 2: TCP Modbus Hacker Program
to flood the local network with false Modbus messages that the control system will accept.
For our experiments, we have developed software to conduct a flooding attack on a control system. This is described in the following section.
3.1 TCP Modbus Hacker
A simple Java application,TCP Modbus Hacker1, was
written to conduct a flooding attack on a Modbus control network. The Java application has two main functions; reading, and writing registers on the con-trol system. These registers represent system actua-tors such as pumps and flow controls, as well as sors such as water level sensors and temperature sen-sors. The software has the ability to query all the possible system registers to determine the active reg-isters. This initial scan is important, as unfamiliar attackers will not know what registers are used by a particular control system. The software also allows an attacker to write to a single coil or multiple regis-ters. As a result, the attacker can send commands to the control system that will be acted upon. The TCP Modbus Hacker has the ability to alter the speed of the commands sent to the target system by introduc-ing a configurable sleep time in milliseconds between each command sent. The TCP Modbus Hacker also has the ability to pause and resume the attack at any time.
When the TCP Modbus Hacker is run against the target PLC, the PLC receives correct commands from the LabView HMI program at the same time. The TCP Modbus Hacker can generate process commands faster than the LabView HMI, and while the control system still tries to execute all the commands it re-ceives, inevitably the control system only acts on the commands generated by the TCP Modbus Hacker. Figure 2 gives the graphical user interface for the TCP Modbus Hacker program.
1The authors acknowledge Vinh Tung Le and Pedram
Moham-madian for implementing the TCP Modbus Hacker application
4 Modbus Flooding Attack Detection
This section presents the two attack detection tech-niques viz. anomaly-based detection (change de-tection algorithm) and signature-based dede-tection (Snort), used for detecting the proposed Modbus flooding attacks.
4.1 Anomaly–based Detection
The onset of an anomalous activity such as flooding-based Denial-of-Service (DoS) attack, is generally ac-companied by a change in the statistical properties of the parameters indicating the anomaly. Hence, the problem of detecting such anomalous activities can be transformed into a change detection problem with the aim to detect changes in the observed parameters with minimal delay and false detection rate (Tartakovsky et al. 2006a,b).
In order to detect such abrupt changes in the pa-rameters being observed, various change detection techniques have been proposed and applied in differ-ent domains such as finance, network, image process-ing and seismology. Amongst all the different tech-niques that have been proposed, moving average, Cu-mulative Sum (CUSUM) and spectral analysis, are the most commonly used to detect anomalous net-work behaviour such as a flooding attack. The change detection technique used in this paper is a variant of the moving average technique called Exponentially
Weighted Moving Average (EWMA). EWMA was
chosen because of its simplicity, flexibility, robustness and effectiveness, especially in detecting high inten-sity attacks (Siris & Papagalou 2006) such as flooding-based attacks. It also has a lower false positive rate as compared to CUSUM for large dataset samples, or whenever the parameters are estimated (Khoo et al. 2011).
Change Detection Algorithm The change detec-tion algorithm used in this paper, EWMA, exam-ines the value of the observed parameter and deter-mines if it has exceeded a particular threshold value. In comparison to other static threshold-based tech-niques, EWMA makes use of a dynamic (adaptive) threshold. This adaptive threshold is based on the
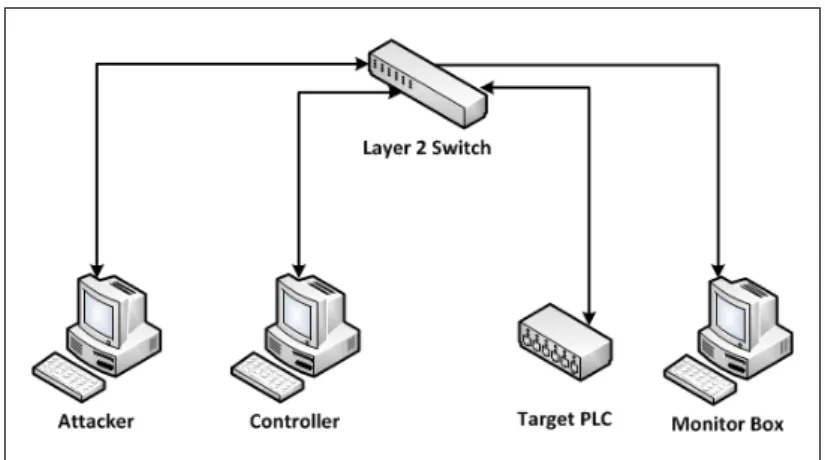
Figure 3: Experimental Set-up
estimated mean of the observed parameter, which in turn is computed from the recent observations. The computed threshold at every sampling interval is then used to make decisions about the changes detected in the parameter of interest, incoming TCP Modbus packets in this case.
Letxtrepresent the number of TCP Modbus pack-ets observed in the time intervalt, andµt−1represents
an average packet rate computed from measurements prior tot. Timetis a cardinal number and indicates a sampling time instance of the time series, rather than an actual time stamp. A significant change in xt is indicated if,
xt≥(1 +η)µt−1 (1)
where η >0 is a parameter indicating the fractional change from the mean (µ) that constitutes a ‘change’ or an indication of the anomalous behaviour ofxti.e. number of incoming Modbus packets. It is to be noted that the change detection condition Equation 1 is used only to flag positive changes in the observed parame-ters.
The mean value µt of the parameter can be estimated, either using a sliding window, or via an EWMA of its previous occurrences until that time interval. The EWMA technique gives a max-imum weight to the most recent observation, and an exponentially decreasing weight to older observa-tions (Roberts 2000). In this paper, EWMA tech-nique is used to calculate the mean value for the pa-rameter of interest at each sampling time interval. Thus, the EWMA µt of the parameter xt, as first studied by Roberts 2000, can be written as:
µt=λxt+ (1−λ)µt−1 (2)
where
• xtis number of packets observed at a time period
t.
• µt is the EWMA value ofxtat a time periodt. • λ is the EWMA factor with a value between 0
and 1.
The value ofxt can either be an individually ob-served value, or an average computed using a given sampling period and technique. The value of λ de-termines the relative weight given to the most recent values of the mean parameter value computed before the current time interval.
Instead of flagging a change in the parameter being observed with every single occurrence of the thresh-old condition (Equation 1), the change detection tech-nique has been slightly modified so that it triggers an
alarm (an actual change) only after a minimum num-ber of consecutive occurrences of threshold condition are detected. This is done to minimise the false alarms that would potentially arise due to erratic fluctuations in the number of packets being observed. Thus, an alarm is triggered when there are kconsecutive time intervals for which the change detection condition oc-curs before flagging an actual change in the observed parameter.
t
X
j=t−(k−1)
1{xj≥(1+η)µj−1}≥k (3)
where k ≥ 1 is a parameter indicating the number of consecutive time intervals for which the change de-tection condition is violated before flagging an actual change in the observed parameter.
The following section presents alternate signature-based attack detection technique using Snort. 4.2 Signature–based Detection
Snort (Roesch 1999) is an open source signature-based network IDS. Due to its wide deployment, Snort has become the de facto standard for intrusion detection. Snort captures network traffic utilising libpcap or win-pcap libraries (depending on the platform it is de-ployed on) and decodes it. The purpose of the decode is to identify the type of network traffic. The de-coded buffer is then made accessible to one or more Snort preprocessors. Preprocessors operate on the de-coded buffer to perform appropriate transformations to the buffer. In the work presented in this paper, the Modbus preprocessor (Peterson 2009) is used. The transformed buffer is subsequently passed to the Snort detection engine, which detects traffic matching a sig-nature or rule to generate alerts. Snortalertsmay be generated by preprocessors or the detection engine, and specific detection rules can be specified to suit deployment.
Thus, similar to the change detection threshold discussed in Section 4.1, Snort rule thresholds can be applied as part of a Snort rule or as a stand-alone rule. Thresholds are applied to Snort rules to detect any changes in parameters which result from anoma-lous traffic such as a flooding-based DoS traffic.
The typical format of the Snort threshold2 rule is as follows threshold: type threshold, track <by src|by dst>, count <c>, seconds <s>;. The 2The threshold rule has been deprecated and will not be
available in future. However additional event processing filter (event filter) is available to implement threshold checking.
threshold rate may be tracked by the traffic source address (by src) or destination (by dst) address, for a count (c), which specifies the number of alerts within the time specified as time in seconds (s).
To prevent thefalse-positive paradox, the thresh-old values employed in the Snort rule need to be based on some statistical mean of normal traffic. Alterna-tively, the threshold values may be derived experi-mentally, to ensure that no false positive alerts are generated as a result of the threshold rules.
Since the attacks described in Section 3.1, floods TCP port 502 to write to a single coil (Modbus func-tion code 0x05), the Snort rules may be refined fur-ther to alert on specific Modbus traffic. As Snort provides a Modbus preprocessor, specific rules can be written to examine the contents of the Modbus pay-load. Modbus TCP packets contain a MBAP Header and PDU as illustrated in Figure 1, and patterns in these may be matched using the content keyword.
The typical content option is in the format
(content:[!]‘‘<content string>’’;). Addi-tionally modifiers such as offset, depth and
byte testare used to specify the offset into the pay-load, how far from the offset to search, and how many bytes to convert to find the function code. Content specific rules can be applied together with threshold rules to get higher accuracy detection of the attacks 5 Experimental Set-up and Methodology This section describes the experimental set-up and methodology used for generating the attack and be-nign traffic used in this paper.
5.1 Experimental Set-up
A typical SCADA architecture comprises a human op-erator, a HMI, a Master Telemetry Unit (MTU), a data communications network and Remote Teleme-try Units (RTUs). The human operator monitors the SCADA system and performs supervisory control function via the HMI, which presents data and allows for control inputs. The MTU transmits the control in-formation and collates the data for presentation to the HMI. The RTU receives control information via the data communications network from the MTU and ma-nipulates the field devices under its control. The RTU is also responsible for acquiring data from field devices and transmitting them to the MTU. The communi-cation between the MTU and RTU is implemented using a SCADA protocol.
In the case of the experimental set-up, as illus-trated in Figure 3, the LabView application on the Controller provides both the HMI and MTU func-tionality. A conventional Ethernet network is utilised as the data communications network. The Target PLC using a National Instruments Compact RIO pro-vides RTU functionality, and Modbus is utilised as the SCADA protocol.
The experimental set-up used for generating the required normal and attack traffic, consists of three machines, a PLC and a layer 2 network switch con-necting all the devices. Figure 3 gives an overview of the experimental set-up. The three machines used in the testbed are standard PCs with 3.0 GHz In-tel Core2 processors, 4 GB of memory, and a main 1 Gb Network Interface Card (NIC). Of these three machines, one is used as an Attacker and runs an in-stance of the TCP Modbus Hacker program previous described (see Section 3.1 for details). The two re-mainder machines are used to act like a Controller
(running LabView HMI) and Monitor Box (running
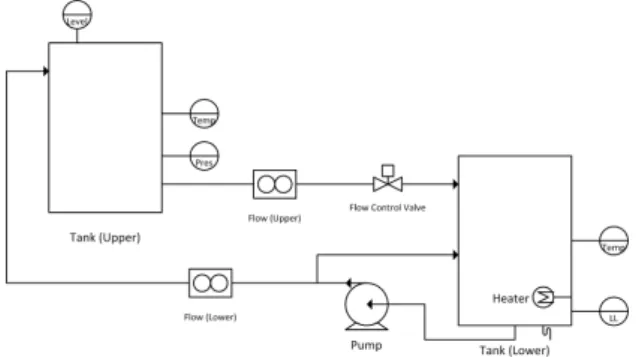
tcpdump) respectively. TheTarget PLCis a National Instruments Compact RIO 9074, with a Universal Analog Input Card (NI9219), a 20mA Analog Input Card (NI9203), a 10V Analog Output Card (NI9263), and a High Speed 24V Digital Output Card (NI9474). This PLC controls the process setup show in Fig-ure 5. The process setup is of two tanks, a lower reservoir tank and an upper holding tank. A pump cycles water into the upper tank, which then drains back into the lower tank. Various instrumentation measure the temperature, pressure and level of each tank, with flow indicators measuring the flow of wa-ter in both pipelines. The flow control valve controls the flowback of water into the lower reservoir. For this paper, we launch a packet flooding attack on the pump in an attempt to control the pump. The HMI, for this process setup is shown in Figure 4. Built in LabView, it shows the controllers view of the process.
Figure 5: Process and Instrumentation Diagram
5.2 Methodology
The experiment was conducted with two parties, the Controller and Attacker over a period of 180 seconds, using the set-up shown in Figure 3. The Controller attempted to control the pump, shown in Figure 5, with it being on (state 1) for the first 30 seconds, and being turned off (state 0) for the next 30 seconds, combining into a 60 second periodic cycle that was repeated three times as shown in Figure 6a. The At-tacker attempted to disrupt control of the pump by launching a flooding attack using the TCP Modbus Hacker program previously discussed (Section 3.1).
As shown in Figure 6b, the Attacker lays dormant in the time period of 0-60 seconds. In the time period of 61-90 seconds, the Attacker floods the PLC with state 0 packets, opposite to the Controller state in the same time period. When the Controller state switches to state 0 at 91 seconds, the Attacker state changes to 1 and begins to flood the PLC with state 1 pack-ets. At 120 seconds, the Attacker returns to dormant state, and ceases the attack. This experiment was re-peated for different values ofSleep time, a parameter within the TCP Modbus Hacker program, which al-lows to set the inter-packet delay, in millisecond (ms), between outgoing packets. For this paper, three sets of experiments were conducted using 0ms, 50ms and 100ms as the sleep time value. These values were cho-sen to simulate the Attacker’s attempt to avoid detec-tion, whilst still successfully flooding the Target PLC. All the generated traffic for the three variants of the flooding attack were captured on the Monitor Box. The captured traffic was then analysed in an off-line
manner using two detection techniques viz. change detection algorithm and signature-based attack de-tection via Snort. The following section presents the obtained results and analysis.
Figure 4: LabView HMI 0 1 2 0 30 60 90 120 150 180 Controller State Time (Seconds)
(a) Controller States over Time.
0 1 2 0 30 60 90 120 150 180 Attacker State Time (Seconds)
(b) Attacker States over Time.
Figure 6: Traffic Generation Scenario
6 Experimental Results and Analysis
The flooding attack launched on the Target PLC as described in Section 5.2 was successful in overwhelm-ing the PLC for the three variations in sleep time. In the attack time period of 61 to 90 seconds of the experiment, the pump was successfully turned off as the Attacker was flooding the Target PLC with state 0 commands. The HMI on the Controller was still showing the pump as running (state 1). In the time
period of 91 to 120 seconds, the Controller turned the pump off by changing the pump state to 0. However, the Attacker reversed the flooding attack state to 1, and was successful in turning on the pump, whilst the Controller HMI depicted the pump as turned off. The 0ms sleep time was the most responsive in changing the running status of the pump and occurred within 1 to 2 seconds of launching the attack. The attacks using a sleep time of 50ms and 100ms were also suc-cessful in changing the running status of the pump.
0 250 500 750 1000 1250 0 30 60 90 120 150 180 0 1 2
Number of Packets Decision Function
Sampling Interval (5 seconds) Number of Packets Decision Function
(a) Modbus flooding attack with 0ms sleep.
0 100 200 300 400 500 0 30 60 90 120 150 180 0 1 2
Number of Packets Decision Function
Sampling Interval (5 seconds)
(b) Modbus flooding attack with 50ms sleep.
0 100 200 300 400 500 0 30 60 90 120 150 180 0 1 2
Number of Packets Decision Function
Sampling Interval (5 seconds)
(c) Modbus flooding attack with 100ms sleep.
Figure 7: Modbus flooding attack detection using change detection algorithm
However, the Target PLC was relatively slower to re-spond to these attacks.
This section presents the experimental results ob-tained by running the anomaly-based change de-tection algorithm and a signature-based dede-tection (Snort) against the attacks. It also presents a compar-ative analysis on the two attack detection techniques. 6.1 Anomaly–based Detection
In this section, the change detection algorithm de-scribed previously in Section 4.1 is used to detect the flooding attacks. Different values for the four config-urable parameters – η, λ, k, T – were initially based on the previous work done in change detection us-ing EWMA (Montgomery 2007, Paul 2006, Khoo et al. 2011, Siris & Papagalou 2006). These values were then experimentally optimised to improve the
detec-tion accuracy. Once optimised, the values were kept constant for all three attack datasets. Unless stated otherwise, the values considered for these parameters areη= 0.25,λ= 0.98,k= 2, T = 5.
The experimental results obtained by running the EWMA-based change detection algorithm on the number of incoming packets to the target PLC are shown in Figure 7. The graph plots number of pack-ets on the left y-axis against time (sampled every 5 seconds). The output of the decision function is shown on the right y-axis, with 0 indicating no-change (nor-mal traffic) and 1 representing the change (attack) detected in the number of incoming packets to the PLC over a period of 180 seconds.
The change detection is able to successfully detect all the three attacks with the decision function indi-cating 1 for the attack period, as shown in Figures 7a, 7b and 7c. A small lag between the start of the attack
0 1 2 3 4 5 0 30 60 90 120 150 180 Number of Alerts Time (seconds) 0ms 50ms 100ms
Figure 8: Modbus flooding attack detection using Snort
at the 61stsecond and the output of the decision func-tion is due to the selected value of k, 2 in this case, which flags a change only after 2 consecutive viola-tions of the change detection condition (Equation 3). Setting a lower value ofksuch as 1 would remove this lag, however, would also result in flagging small fluc-tuations in the observed traffic, thereby increasing the number of false alarms.
A small dip is observed around the 95th second, especially in Figures 7a and 7b. This is mainly due to a switch in the attackers activity i.e. from trying to turn-off the pump (flooding with packets with 0s) to turn it on (flooding with packets with 1s), opposite to the controllers activity. This switching of activity from the attacker is accompanied by a delay in re-sponse from the Target PLC and hence a drop in the number of incoming packets. This drop in the num-ber of incoming packets affects the adaptive thresh-old value in the attack with 50ms delay, Figure 7b, which thereby causes the decision function momentar-ily drop around the 100th second mark, before going back to 1 and detecting the remainder of the attack. 6.2 Signature–based Detection
An alternative to the anomaly-based detection using the change detection algorithm, a signature-based de-tection technique using Snort was also used. This was primarily done to test if Snort, being the indus-trial de-facto for intrusion detection, can be used to detect the proposed flooding attack. The preliminary results obtained using Snort with customised rules are discussed below.
To enable Snort to detect the proposed Modbus flooding attacks, the following rule was utilised:
alert tcp any any -> 10.10.10.12 502 (msg:"Modbus threshold violation"; sid:1000001; rev:1; priority:1;
threshold:type threshold, track by dst, count 50, seconds 1;).
This rule utilised the Modbus preprocessor for Snort together with the threshold directive as de-scribed in Section 4.2. The initial normal (non-attack) network traffic, i.e. traffic between 0 s and 60 s (see Figure 6) from the Controller to the TCP port 502 on the Target PLC was observed to be, on average, 42 packets per second. This value was adjusted ex-perimentally to obtain the value of 50 packets per second. Employing this value ensured that there were
no false alerts generated in the initial non-attack pe-riod. Thus, the Snort rule threshold value employed a count of 50 packets for 1 second period. These val-ues are specific to the scenario, and will need to be changed to suit the specific environment that Snort is deployed in.
Figure 8 plots the number of alerts generated against time in seconds. Using Snort with the afore-mentioned rule, the Snort IDS was able to success-fully detect the onset of anomalous activities in all the three variants of the flooding attack. In the case of attack with 0ms sleep, the number of alerts triggered were higher as compared to the attacks with 50ms and 100ms delay. This is speculated to be an artifact of Snort, which uses a sliding-window-based time period to perform the rate calculations and is used to de-termine if there is an rule violation and subsequently trigger an alert. Thus, with the 0ms attack, as there are a large number of packets violating the threshold in comparison to the 50ms and 100ms attacks, there are more of these sliding-windows triggering alerts.
It should also be noted that the number of alerts, while interesting (and indicating a greater likelihood of a flooding attack) should not detract from the fact that any alerts should be investigated. A detailed analysis of the use of a signature-based technique needs further investigation and constitutes the future work of this research.
6.3 Comparative Analysis
The two techniques used in this paper, anomaly-based change detection algorithm and signature-based de-tection via Snort, successfully demonstrate that ab-normal activities started at the 60th second and fin-ished at the 120thsecond. The two techniques, while completely orthogonal, do possess their respective ad-vantages and disadad-vantages. Whereas the signature-based detection requires a predefined threshold which is fixed, the change detection algorithm does not re-quire any pre-defined threshold. Instead, the thresh-old is adaptively calculated and changes continuously with the observation time. In terms of implement-ing the attack detection technique in a real-world scenario, signature-based detection is easier to de-ploy than the anomaly-based change detection algo-rithm, as Snort already provides a preprocessor for Modbus, and thus can be used to detect attacks us-ing this protocol. However, in either of the two de-tection techniques, values of the configurable param-eters/threshold used are scenario dependent and thus require optimisation.
7 Conclusion and Future Work
The work described in this paper has explored the area of cyber attacks in industrial control systems. In particular we have investigated flooding attacks on the commonly used Modbus control systems proto-col. The work in this paper has shown that flood-ing attacks can disrupt the functionality of physical systems. The paper also investigated anomaly-based and signature-based techniques for detecting these at-tacks. Both of the intrusion detection techniques are shown to be successful in detecting the flooding at-tack. However, signature-based systems are depen-dent on threshold values, while the anomaly-based change detection algorithm takes time to react to the attack. Future work includes investigating how vulnerable the Modbus protocol is to other types of attacks such as man in the middle attacks, and to investigate and compare different intrusion detection techniques for these new attacks. Mitigation strate-gies such as integrating checksums and authentication mechanisms need to be developed to improve the secu-rity of the Modbus protocol to make industrial control systems more secure.
References
Cheung, S., Dutertre, B., Fong, M., Lindqvist, U., Skinner, K. & Valdes, A. (2007), Using model-based intrusion detection for scada networks,in ‘Proceed-ings of the SCADA Security Scientific Symposium’, pp. 1–12.
Huitsing, P., Chandia, R., Papa, M. & Shenoi, S. (2008), ‘Attack Taxonomies for the Modbus Proto-cols’, International Journal of Critical Infrastruc-ture Protection1, 37–44.
Khoo, M., Teh, S., Ang, L. & Ng, X. (2011), A Study on the False Alarm Rates of X, EWMA and CUSUM Control Charts when Parameters are Es-timated, in ‘Proceedings of the 2011 International Conference on Circuits, System and Simulation’. Mell, R. (2001), ‘Intrusion detection systems’,
National Institute of Standards and Technology (NIST), Special Publication.
Modbus Organization Inc. (2006), ‘Modbus applica-tion protocol specificaapplica-tion v1. 1b’.
Montgomery, D. (2007), Introduction to Statistical Quality Control, John Wiley & Sons.
Morris, T. H., Jones, B. A., Vaughn, R. B. & Dan-dass, Y. S. (2013), Deterministic Intrusion Detec-tion Rules for MODBUS Protocols,in‘Proceedings of the 46th Hawaii International Conference on Sys-tem Sciences (HICSS), 2013’, IEEE, pp. 1773–1781. Paul, O. (2006), Improving Web Servers Focused DoS Attacks Detection, in ‘Proceedings of the IEEE/IST Workshop on Monitoring, Attack De-tection and Mitigation (MonAM 2006), Tuebingen, Germany’.
Peterson, D. (2009), Quickdraw: Generating Secu-rity Log Events for Legacy SCADA and Control System Devices, in ‘Proceedings of Conference for Homeland Security on Cybersecurity Applications and Technology’, IEEE, pp. 227–229.
Queiroz, C., Mahmood, A., Hu, J., Tari, Z. & Yu, X. (2009), Building a scada security testbed,in ‘Pro-ceedings of Third International Conference on Net-work and System Security, 2009. NSS’09.’, IEEE, pp. 357–364.
Roberts, S. (2000), ‘Control Chart Tests Based on Geometric Moving Averages’, Technometrics
42(1), 97–101.
Roesch, M. (1999), Snort - Lightweight Intrusion De-tection for Networks, in ‘Proceedings of the 13th USENIX Conference on System Administration’, LISA ’99, USENIX Association, Berkeley, CA, USA, pp. 229–238.
Siris, V. & Papagalou, F. (2006), ‘Application of Anomaly Detection Algorithms for Detecting SYN Flooding Attacks’, Computer Communica-tions29(9), 1433–1442.
Tartakovsky, A., Rozovskii, B., Blaˇzek, R. & Kim, H. (2006a), ‘A Novel Approach to Detection of Intru-sions in Computer Networks via Adaptive Sequen-tial and Batch-sequenSequen-tial Change-point Detection Methods’,Signal Processing, IEEE Transactions on
54(9), 3372–3382.
Tartakovsky, A., Rozovskii, B., Blaˇzek, R. & Kim, H. (2006b), ‘Detection of Intrusions in Informa-tion Systems by Sequential Change-point Methods’,