04 August 2020
POLITECNICO DI TORINO
Repository ISTITUZIONALE
Development and application in clinical practice of Computer-aided Diagnosis systems for the early detection of lung cancer / Traverso, Alberto. - (2017).
Original
Development and application in clinical practice of Computer-aided Diagnosis systems for the early detection of lung cancer
Publisher:
Published
DOI:10.6092/polito/porto/2686725 Terms of use:
Altro tipo di accesso
Publisher copyright
(Article begins on next page)
This article is made available under terms and conditions as specified in the corresponding bibliographic description in the repository
Availability:
This version is available at: 11583/2686725 since: 2017-10-18T20:07:20Z Politecnico di Torino
Development and application in
clinical practice of Computer-aided
Diagnosis systems for the early
detection of lung cancer
By
Alberto Traverso
******Supervisor(s):
Prof. Michelangelo Agnello Dott. Piergiorgio Cerello
Doctoral Examination Committee:
Politecnico di Torino 2017
Declaration
I hereby declare that, the contents and organization of this dissertation constitute my own original work and does not compromise in any way the rights of third parties, including those relating to the security of personal data.
Alberto Traverso 2017
* This dissertation is presented in partial fulfillment of the requirements forPh.D. degreein the Graduate School of Politecnico di Torino (ScuDo).
Lung cancer is the main cause of cancer-related deaths both in Europe and United States, because often it is diagnosed at late stages of the disease, when the survival rate is very low if compared to first asymptomatic stage. Lung cancer screening using annual low-dose Computed Tomography (CT) reduces lung cancer 5-year mortality by about 20% in comparison to annual screening with chest radiography. However, the detection of pulmonary nodules in low-dose chest CT scans is a very difficult task for radiologists, because of the large number (300/500) of slices to be analyzed. In order to support radiologists, researchers have developed Computer-aided Detection (CAD) algorithms for the automated detection of pulmonary nodules in chest CT scans. Despite proved benefits of those systems on the radiologists detection sensitivity, the usage of CADs in clinical practice has not spread yet. The main objective of this thesis is to investigate and tackle the issues underlying this inconsistency. In particular, in Chapter 2 we introduce M5L, a fully automated Web-and Cloud-based CAD for the automated detection of pulmonary nodules in chest CT scans. This system introduces a new paradigm in clinical practice, by making available CAD systems without requiring to radiologists any additional software and hardware installation. The proposed solution provides an innovative cost-effective approach for clinical structures. In Chapter 3 we present our international challenge aiming at a large-scale validation of state-of-the-art CAD systems. We also investi-gate and prove how the combination of different CAD systems reaches performances much higher than any best stand-alone system developed so far. Our results open the possibility to introduce in clinical practice very high-performing CAD systems which miss a tiny fraction of clinically relevant nodules. Finally, we tested the performance of M5L on clinical data-sets. In chapter 4 we present the results of its clinical validation, which prove the positive impact of CAD as second reader in the diagnosis of pulmonary metastases on oncological patients with extra-thoracic cancers. The proposed approaches have the potential to exploit at best the features of
iv
different algorithms, developed independently, for any possible clinical application, setting a collaborative environment for algorithm comparison, combination, clinical validation and, if all of the above were successful, clinical practice.
List of Figures vii
List of Tables xi
1 Introduction 1
1.0.1 Motivation . . . 1
1.0.2 Medical Imaging of the lungs . . . 2
1.0.3 Computer-Aided Detection systems . . . 7
1.0.4 Introduction of CAD in clinical practice . . . 9
1.0.5 Contribution of this work . . . 9
2 M5L: a Web- and Cloud-based on-demand CAD 10 2.0.1 Motivation . . . 10
2.0.2 CAD systems: state-of-art and challenges . . . 11
2.0.3 The algorithms . . . 13
2.0.4 The WEB front-end . . . 15
2.0.5 The Cloud back-end . . . 22
2.0.6 Conclusion and Discussion . . . 27
3 Combining and Comparing CAD systems on large-scale datasets: the LUNA16 challenge 29 3.0.1 Motivation . . . 29
vi Contents
3.0.2 Data . . . 30
3.0.3 LUNA16 challenge framework . . . 32
3.0.4 Conclusion and Discussion . . . 49
4 Clinical validation of the M5L on-demand CAD 52 4.1 Motivation . . . 52
4.2 Material and Methods . . . 54
4.2.1 CT Protocol . . . 54
4.2.2 Image Interpretation . . . 58
4.2.3 Double reading with CAD . . . 60
4.2.4 Reading Time . . . 60
4.2.5 Reference Standard . . . 61
4.2.6 Statistical Analysis . . . 61
4.2.7 Sample Size Estimation . . . 62
4.3 Results . . . 62
4.3.1 Study Population . . . 62
4.3.2 Stand-Alone CAD performance . . . 63
4.3.3 False positive, True positive and False negative analysis . . 65
4.4 Conclusion and Discussion . . . 65
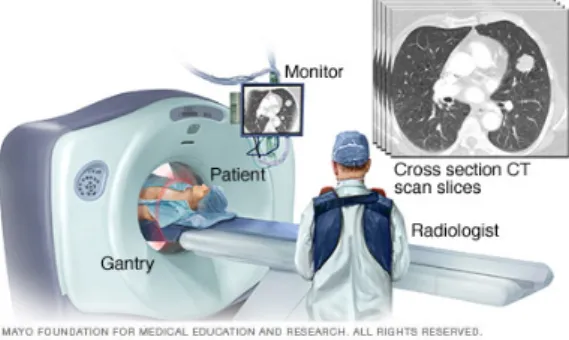
1.1 Pictorial view of a CT scanner. The patient is introduced into the CT scanner, while images are acquired and reconstructed directly on the
computer in the control room. . . 2
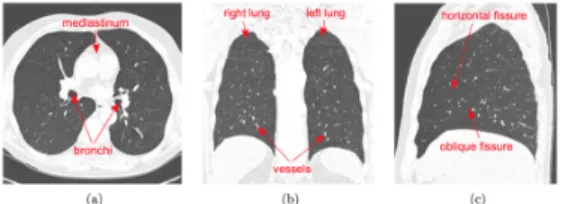
1.2 An example of a CT scan of the lungs with some anatomical
struc-tures underlined. Three views are usually shown; a) Axial view b) Sagittal view and c) Coronal view of the right lung. The setting of the HU correspond to the typical lung window: white is set to values
50 HU or higher and black is -1450 HU or lower. . . 3
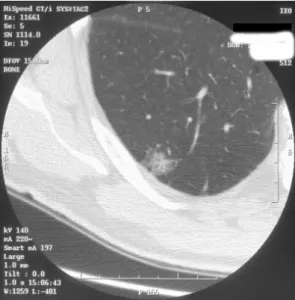
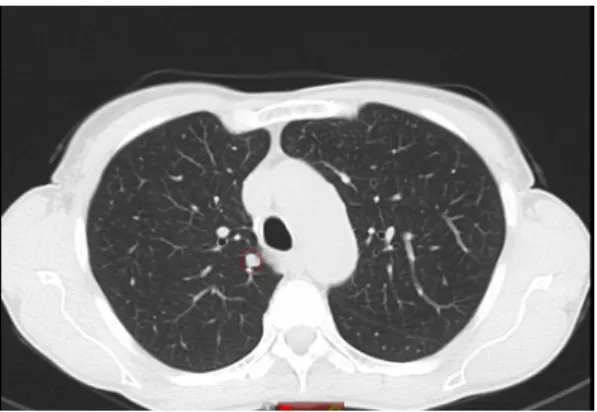
1.3 A solid nodule in the upper left lobe (right side) with irregular
margins. This is a stage I adenocarcinoma of the lung. . . 5
1.4 A part solid nodule in the lower right lobe. This is a non-small-cell
lung cancer. . . 5
1.5 A ground-glass opacity nodule in the lower right lobe. This is an
adenocarcinoma with a bronchioloalveolar component. . . 6
1.6 Typical setup of a classical CAD system. The input is represented
by a CT scan which pre-elaborated during the pre-processing stage. The input image is segmented in order to extract the binary mask of the lungs. Following stages are: candidate detection and false positive reduction. This last step can be considered as formed by two sub sequential steps: feature extraction and classification. The final output of a CAD system is a list of CAD marks which is sent to the radiologist for review. . . 7
viii List of Figures
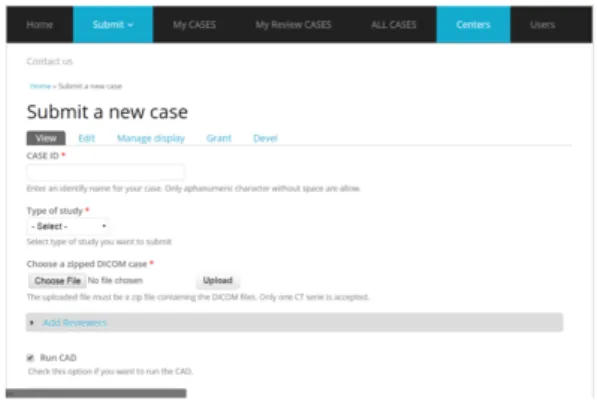
2.1 Screenshot of the M5L submission form as seen by a submitter
logging in with proper credentials. . . 17
2.2 Overview of the annotation module with an example of selected
ROI. Screenshot on the left is the global axial view of the slice corresponding to the finding, while the screenshot on the right is the cropped zoomed view of the finding. Additional information about
properties of the ROIs can be displayed clicking on the ROI name. . 18
2.3 Screenshot of the review module. Connecting with proper
creden-tials, the radiologist has marked CAD findings as True Positive, False Positives, or Irrelevant. . . 21
2.4 Screenshot of the Osirix plugin with underlined a CAD mark in
the circle. The radiologist can scroll through the slices and reject or accept the CAD mark. In this last case the mark is added on radiologist’s annotation. . . 21
2.5 Pictorial view of the M5L on-demand system. CT are submitted
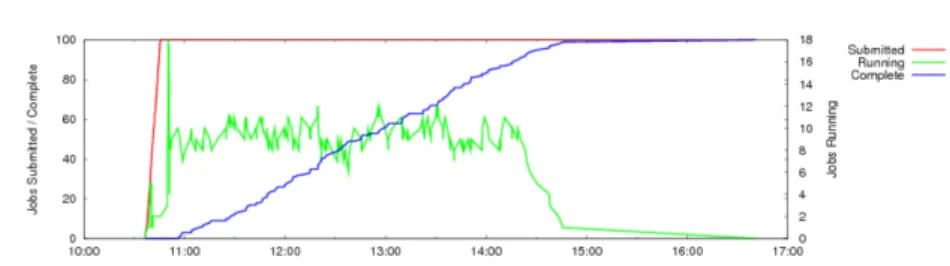
directly as soon as acquired from the WEB front-end. While the user is submitting other CTs or inserting medical annotations, previous scans are copied to the Cloud back-end and analyzed by the CAD. When the computations are completed, CAD results are copied back in the front-end and users are alerted with an e-mail containing the links to retrieve CAD results. . . 24 2.6 Distribution of jobs and their completion time during the first phase
of stress test: 100 exams submitted in one bunch. . . 26
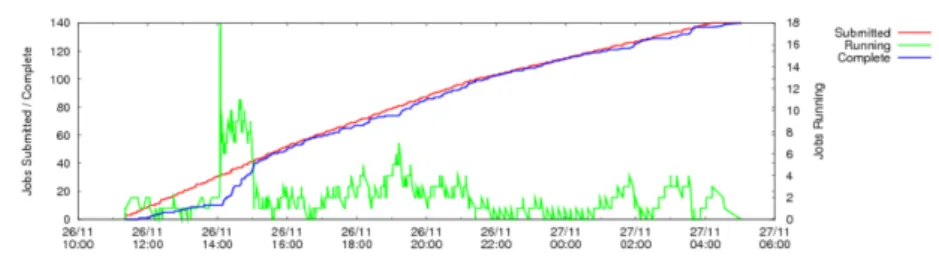
2.7 Distribution of jobs and their completion time during the second
phase of stress test: 140 exams with a slow and steady submission rate. 27
3.1 Distribution of manufacturers and scanner models of the scans used
in our study. . . 31
3.2 Distribution of section thicknesses of the scans used in our study. . . 32
3.3 Distribution of the reconstruction kernels of the scans used in our
3.4 Screenshots of some example of nodules available in the reference standard. A very wide range of type of nodules is intentionally included. . . 33
3.5 Distribution of the frequency of the nodules divided according to
their size (defined as the average size of the measurements of the
radiologists). Minimum size: 3 mm, maximum size 33 mm. . . 34
3.6 View of the candidate detection procedure of the ZNET system: (a)
raw output from the UNET CNN, b) image after thresholding and erosion. The red circle indicates the coordinates of each candidate,
corresponding to the center of mass of each connected component. 38
3.7 Summarized views of the architectures of the CUMEDVIS CNN. . . 41
3.8 Summarized view of the architecture of the DIAGCONVNET system. 41
3.9 FROC curves of the systems in (a) nodule detection track and (b)
false positive reduction track. Dashed curves show the 95%
confi-dence interval estimated using bootstrapping . . . 44
3.10 Examples of true positives, false positives, and false negatives from the combined system. Each lesion is located at the center of the
50×50 mm patch in axial, coronal, and sagittal views. . . 46
3.11 Examples of true positives detected by the combined system. Each
lesion is located at the center of the 50×50 mm patch in axial view. 48
3.12 Examples of false positives detected by the combined system. Each
lesion is located at the center of the 50×50 mm patch in axial view. 48
3.13 Examples of nodules missed by the combined system. Each lesion
is located at the center of the 50×50 mm patch in axial view. . . . 49
4.1 View of the two different coordinate systems: patient coordinates
(x,y) and CT coordinates (x′,y′) . . . 56
4.2 Pictorial view of the Radon transform. . . 57
4.3 Schematic view of the steps composing the algorithm of filtered back
x List of Figures
4.4 Axial view of a chest CT scan after applying MIP. Denser structures
appear as static when scrolling through slices. . . 59
4.5 ROC curves divided per malignancy score for each reader for both
3.1 Results of all the candidate detectors standalone and the best 15 com-binations from the five systems sorted by the sensitivity. The filled and open squares indicate which systems have and have not been included in the combination. Total number of detected candidates is shown in the third column. The forth column lists the sensitivity, while the fifth column is the best score of any single system included in the combination. The difference between the sensitivity of the combination and the best score of a single system in the combination is given in the sixth column. The seventh columns is the average
number of candidates per scan. . . 43
3.2 Results of all the false positive reduction systems and all the possible combinations of the four systems. The filled and open squares in the first column indicate which systems have and have not been included in the combination. Columns from 3 to 9 indicate the value of sensitivity for different working points. The average sensitivity (CPM score) is indicated in the tenth row. The eleventh row is the best CPM score of any single system included in the combination. The difference between the CPM score of the combination and the
xii List of Tables
3.3 Overview of the observer study on 888 false positives at 1 FP/scan.
The table shows the number of false positives that are accepted by the radiologists as nodules≥3 mm at different agreement levels. The
number of false positives that are not accepted as nodules≥3 mm,
but are accepted as nodules<3 mm, are also included. The number of accepted CAD marks at different range of FPs/scan is shown,
wherenis the FPs/scan rate. . . 45
3.4 Performance summary of published CAD systems evaluated using
LIDC-IDRI data set. Different subsets of scans from LIDC-IDRI data set were used by different research groups over-time. For completeness, number of scans, reference standard criteria, and resulting number of nodules used for evaluation are included in the table. The reported performance at one or two operating points is
provided. . . 50
4.1 Summary of the main parameters corresponding to the acquisition
protocols used in our study. Thorax-basal uses only one value for the electric potential applied across the x-ray tube. CE-CT is a Dual Energy CT (DECT) making use of two different values of the tube
potential in order to acquire a combine different X-ray spectra. . . . 56
4.2 Per-lesion sensitivity results for all the readers and the average of all
the readers for the unassisted reading. . . 63
4.3 Per-lesion sensitivity results for all the readers and the average of all the readers for the double reading reading. * Delta = (average sensitivities of all readers with Double reading - average sensitivities
of all readers unassisted Reading ) for each category in the table. . . 64
Introduction
1.0.1
Motivation
Lung cancer, also known as bronchogenic carcinoma, is one of the main public health issues in developed countries and still represents the main cause of cancer-related deaths both in Europe and United States, accounting for about 20% and 27% deaths in Europe [1] and United States respectively [2]. Also, the average 5-year survival rate is very low, around 10-17% [2]. Most of lung cancers are diagnosed in the late-stage of the disease (usually referred as Stage IV) when the survival rate is very low if compared to the diagnosis in the preliminary stage (referred as Stage I) where the 5-year survival rate is about between 45-50%. In late stages, the progression of the disease can spread to other parts of the body generating the so-called metastases. Stage I corresponds to the asymptomatic phase of the disease, making the early diagnosis a real clinical challenge. Conversely, in late stages the most common symptoms are chronic cough, blood in the saliva, spread pains in the chest, usually shortness of breath and recurring bronchitis [3]. When lung cancer is detected in the early stage, treatment is very successful leading in most of the cases to the complete healing. The research aiming at optimizing the early diagnosis of lung cancer is a very challenging field which brings together very vast disciplines: clinicians and technicians cooperates in order to improve patient care. In fact, computer scientists, medical physicists and radiologists started working both on hardware and software developments in order to support clinicians by providing them with advanced automated tools that could improve the detection process.
2 Introduction
1.0.2
Medical Imaging of the lungs
Relevant technological and clinical developments have been achieved in the last decades in order to improve the early diagnosis: among them, the improvement of scanners for the acquisition of images of the chest. Computed Tomography (CT) for the imaging of the body has been available since 1975 [4]. The physical principle underlying this imaging technique is using X-rays to generate density maps (slices) of the anatomy. A CT scan combines a series of X-ray images taken from
Fig. 1.1 Pictorial view of a CT scanner. The patient is introduced into the CT scanner, while images are acquired and reconstructed directly on the computer in the control room.
different angles and uses computer processing to create cross-sectional images, or slices, of the bones, blood vessels and soft tissues inside the body, as pictorially described in Figure 1. 3D images are formed by combining different information from a big series of 2D X-ray scans from different angles. A CT scan can then be
considered as composed by a 3D matrix formed by cuboids calledvoxels. Eachvoxel
expresses a particular gray value which represents the density (absorption coefficient) of the corresponding tissue. The standard measurement unit for voxel values is the Hounsfield Unit (HU). It is defined as:
HU =1000 µ−µwater
µwater−µair
where µwater andµairare the linear absorption coefficients of water and air respec-tively. Sometimes CT scans are performed using a contrast agent injected just before the examination in the blood of the patient. In this case the examination is usually referred as Contrast-Enhanced Computed Tomography (CECT). The role of the agent is usually to increase the density and thus also the HU of the blood. Figure 2 shows a typical example of a CT scan of the lungs from 3 different views: axial, coronal and sagittal. After the acquisition of all the projections, the images
Fig. 1.2 An example of a CT scan of the lungs with some anatomical structures underlined. Three views are usually shown; a) Axial view b) Sagittal view and c) Coronal view of the right lung. The setting of the HU correspond to the typical lung window: white is set to values 50 HU or higher and black is -1450 HU or lower.
are reconstructed using dedicated algorithms, which can be divided into two big families: direct and iterative algorithms. The most famous and still most spread algorithm of the first family is Filtered Back Projection (FBP) [5]. The second family is further divided into algebraic and iterative [6]. This last category includes the most recent algorithms, even though they are still not spread in clinical practice [7]. Improvements on the axial resolution gave to possibility to use in clinical routine High Resolution Computed Tomography (HRCT) scans. Performing scans with axial reconstructed slices of 1 mm thickness allows to investigate anatomical details of the lungs on the same scale of the ones available from pathological specimens [8]. The big revolution in CT imaging was the introduction of multi-detector-row scanners able to acquire up to 64 1-mm slices per rotation at the same time. Furthermore, each rotation can be performed in less than a second. These achievements reduced the acquisition time and consequently motion and breathing artifacts. In parallel to technological developments, software improvements on reconstruction algorithms made the quality of acquired images much better, sensitively decreasing the dose to the patient. On the other side, all previous remarkable improvements brought into clinical practice a major challenge: dealing with an enormous increase in the number and size of digital images. This high-demanding challenge has been called
data explosionby Rubin [9]. One of the clinical interested challenges was screening potential lung cancer high-risk subjects (such as heavy smokers or former smokers above a certain age) using X-rays or CT scans. The National Lung Screening Trial (NLST), a randomized control trial in the U.S. including more than 50,000 high-risk subjects, showed that lung cancer screening using annual low-dose CT reduces lung cancer mortality by 20% in comparison to annual screening with chest radiography [10]. In 2013, the U.S. Preventive Services Task Force (USPSTF) has given low-dose CT screening a grade B recommendation for high-risk individuals [11] and in early
4 Introduction
2015, the U.S. Centers for Medicare and Medicaid Services (CMS) has approved CT lung cancer screening for Medicare recipients. As a result of these developments, lung cancer screening programs using low-dose CT are being implemented in the United States and other countries are expected to follow soon. During a screening campaign, millions of slices need to be analyzed as fast as possible. This situation represents a real burden for radiologists. In fact, the identification of pathological Regions Of Interest (ROIs) in low-dose high resolution CT scans is a difficult and time consuming task for radiologists, mainly due to the high number of slices (on average 200/300 per patient) to be read. Furthermore, it has been proved [12] that radiologist’s concentration decreases during the day with a substantial impact on the overall detection sensitivity. Pulmonary nodules are the early manifestation of lung cancer: they show up on CT as a small round or oval-shaped growth in the lung.
They may also be calledspots on the lungor acoin lesion. Pulmonary nodules are
smaller than three centimeters in diameter. If the growth is larger than that previous dimension, they are called pulmonary mass and they are more likely to represent a cancer. Pulmonary nodules can be distinguished according to the tissue forming them as follows:
• solid pulmonary nodules: a solid nodule completely obscures the surrounding parenchyma; it has homogeneous soft-tissue attenuation and well-defined margins with normal parenchyma. An example of solid pulmonary nodule is shown in Figure 1.3;
• ground glass opacity (GGO or non-solid nodule): it manifests as an area of hazy increased attenuation that does not obliterate the bronchial and vascular margins. They can be due to inflammatory changes, benign lesions, or carci-noma (often bronchioloalveolar). Due to their structure, they are more difficult to be detected by the radiologist, but they usually are more likely to be found malignant [13]. An example of GGO is shown in Figure 1.5;
• semi-solid nodule: it consists of both ground-glass and solid soft-tissue at-tenuation components. It partially obscures the surrounding parenchyma. An example of semi-solid nodule is shown in Figure 1.4.
Furthermore, pulmonary nodules can be distinguished between malignant and be-nign. Using only the visual assessment of the nodule there is no certainty about the malignancy of a nodule. Additional investigations such as Positron Emission
Fig. 1.3 A solid nodule in the upper left lobe (right side) with irregular margins. This is a stage I adenocarcinoma of the lung.
Fig. 1.4 A part solid nodule in the lower right lobe. This is a non-small-cell lung cancer.
Tomography (PET) [14] or biopsy (pathological examination of part of the cells constituting the nodule at the microscope) is required in order to determine the origin of the nodule. In case of malignant nodule, it can be associated to two types of lung cancer: small cell lung cancer (SCLC) and non-small cell lung cancer (NSCLC). The classification is made according to the appearance of the tumor cells at the microscope. SCLC is the most aggressive type of cancer, usually related to cigarette smoking and comprises about 10-15% of lung cancers [15]. Conversely, NSCLC is the most common lung cancer, accounting for about 85% of them. [15]. According to the type of cells found in the tumor it is further divided into: adenocarcinomas, squamous cell carcinomas and large cell carcinomas. As mentioned before, the
6 Introduction
Fig. 1.5 A ground-glass opacity nodule in the lower right lobe. This is an adenocarcinoma with a bronchioloalveolar component.
visual assessment of a pulmonary nodule is not enough to discriminate between malignant and benign lesions. Conversely, the visual assessment of the properties of a pulmonary nodule is fundamental in order to determine the correct monitoring action for the detected lesion. In fact, the main objective of lung screening is not just to detect nodules, but to determine whether or not immediate follow-up action or monitoring is required. Different strategies and guidelines for the management of pulmonary nodules have been proposed in literature [16] [17]. Most of them are based on some properties of the nodule, such as type of nodules or size. Depending on these features and their combination with other factors such as smoking history, the therapy is determined. It can include both additional follow-up CT surveillance up to 1 year if the nodule is not likely to be malignant or immediate therapy (surgery, chemotherapy, radiotherapy). From the point of view of the radiologist, it is im-portant to detect all the nodules, including small nodules, in order to analyze and monitor their growing rate, which it is a good indicator of malignancy [18]. As already stressed, the detection of pulmonary nodules in chest CT scans is far from being a trivial task for radiologists. In addition, most measurements (such as the quantification of the volume of a nodule) are performed manually by the radiolo-gist, by delimiting the contour of the nodule slice by slice. This represents a very time-consuming task. It is becoming clear that the possibility to provide clinicians with tools for the automated detection and quantification of properties of pulmonary nodules not only can improve the early diagnosis of lung cancer, but also would optimize the cost-effectiveness of screening campaigns. In addition, quantitative
measurements of the properties of nodules are more reliable and can be used as risk predictor factors or discriminant features between malignant or benign lesions. The approach of introducing quantitative automated measurements can be referred to as the field ofquantitative imaging analysis.
1.0.3
Computer-Aided Detection systems
Computer vision and medical imaging techniques can play a fundamental role in this optic and are fundamental in order to facilitate CT interpretation. In fact, the rapid developments in the imaging acquisition techniques have been accompanied by research on imaging analysis techniques. The algorithms for the automated detection of pathological ROIs are called Computer-Aided Detection or diagnosis (CAD) systems. The usual structure of a CAD system is: 1) pre-processing, 2) candidate detection, and 3) false positive reduction. A pictorial view of the typical setup of a CAD system is shown in Figure 6. The pre-processing stage is used to restrict the
Fig. 1.6 Typical setup of a classical CAD system. The input is represented by a CT scan which pre-elaborated during the pre-processing stage. The input image is segmented in order to extract the binary mask of the lungs. Following stages are: candidate detection and false positive reduction. This last step can be considered as formed by two sub sequential steps: feature extraction and classification. The final output of a CAD system is a list of CAD marks which is sent to the radiologist for review.
search space to the lungs and to limit noise and image artifacts. One of the most important parts of the pre-processing step is the so-called segmentation. In particular, great importance is dedicated to the segmentation of the lungs. Since the manual delineation of the contour of the lungs slice by slice is a very time consuming task, the aim of the segmentation is to perform this task automatically. It has been proved [19] that an accurate segmentation is a key point in the pre-processing stage: as study
8 Introduction
[19] shows that a fraction between 5%-17% of lung nodules were missed because of a wrong pre-processing lung segmentation. Most of the segmentation algorithms rely on the fact that the lungs can be considered as a bag full of air, so that they appear as a uniform dark region in the CT scan. Most of the algorithms performing the segmentation task are based on gray-level thresholding and connected component analysis [20] [21]. These methods still suffer from one issue: they are optimized to work on lungs without any pathological or anatomical deformity, while they can fail or produce wrong results when applied on lungs presenting anatomical deformities. The obtained final segmentation of the lungs is usually saved as a binary mask and represents the input for the following step of a CAD system: the candidate detection. The aim of this step is to detect nodule candidates, inside the lung mask. The nodule detection algorithms must provide a very high detection sensitivity, but a very low specificity, which comes with a high number of false positives. Candidate detection algorithms can be based on the widest range of classical medical imaging analysis techniques. One of the most spread and common is the usage of multiple gray-level thresholding techniques [22] [23] [24]: trying to find connected components which present comparable gray level intensities and remove attached anatomical structures such as vessels. Other techniques [25] [26] make use of mathematical morphological operations and additional dedicated filters. The list of candidates, which as mentioned usually includes a very large number of false positives, represents the input for the next step: false positive reduction. The false positive reduction procedure can be seen as a classical binary class machine learning problem: separating non-nodules (negative class) from true nodules (positive class). The classical approaches to solve this problem define a list of features associated to each candidate. The most commonly used features are: gray-level, shape, spatial features and morphological or texture properties. The list of features represents then the input for the classifier. In order to reduce the computational time of the classification stage, some false positives are already discarded using some filtering based on spatial properties. The available CAD algorithms explore a vast range of classifiers: neural networks [27] [28][29], linear classifiers [30] [31], Markov random fields [32] and Bayesian classifiers [33]. The classification step generates the final list of CAD marks which is then given to the radiologist for review. Some classification algorithms also perform a characterization of pulmonary nodules, classifying them according to their type or providing a malignancy score.
1.0.4
Introduction of CAD in clinical practice
CAD systems can be introduced into clinical practice in three different ways: as first reader, as concurrent reader and as second reader. In the first reading mode, all the scans are submitted to the analysis of the CAD before being read by the radiologist. Only slices with CAD marks are then presented to the radiologist. This method can have the appeal to sensibly reduce the reading time, but it requires a system with both high sensitivity and specificity in order not to miss any clinically relevant nodule. In the third reading mode, CAD marks are available to the radiologist only after he/she has finished the first unassisted reading. She / He can then access CAD ROIs and mark them as irrelevant findings (e.g. other pulmonary lesions or not nodules), false positives or true positives originally missed during the un-assisted reading. This solution can have the potential issue to increase the average reading time of a CT scan. The second reading mode is a compromise solution in which CAD marks are shown simultaneously to the radiologists while he/she is inspecting the slices. It is difficult so far to assess which solution should be adopted in clinical practice due to the scarce availability in literature of studies comparing these modalities.
1.0.5
Contribution of this work
The main contribution of this work is aimed at the development and application in clinical practice of CAD systems for the early detection of lung cancer. The first part of the work has been focused on the investigation of available state-of-art CAD systems and their application in clinical practice. This analysis has raised some issues which have been tackled as developments during the research project. In particular, main attention has been focused on:
• developing a complete CAD system which can be accessed and used without requiring any Software or Hardware installation to the clinical facility; • investigating the impact of combining different CAD systems on the overall
detection sensitivity and largely validating new up-to-date candidate detection and false positive algorithms;
Chapter 2
M5L: a Web- and Cloud-based
on-demand CAD
2.0.1
Motivation
With the starting of lung cancer CT screening programs, the development of CAD systems has growing rapidly. Considering, for example, the years between 1998 and 2004, the academic production of articles presenting automated nodule detection algorithms has almost doubled each year [34]. In these works, big attention has been devoted to propose new techniques for the detection of pathological ROIs. Other works had the aim to improve exiting CAD systems adding additional improvements or features to existing algorithms. However, scarce effort has been put to analyze the requirements which need to be fulfilled by a system in order to be used daily in clinical practice. This evidence led to a discrepancy between the level of devel-opments reached in the academic research and the level of dissemination of CADs in clinical facilities. It is rare to find hospitals which use those systems as decision support in the diagnosis, but is more rare to find CADs used asindependent reader. A detailed analysis of issues related to state-of-art CAD systems together with an analysis of clinical requirements for the introduction of a CAD in hospital facilities represents the first step to develop CADs potentially applicable in clinical routine. In addition, the emerging of new technologies (e.g distribute computing) could offer possible solutions to introduce a new paradigm of CAD systems for daily usage in the diagnostic process. A recent study [35] investigates the new informatics tools and developments which can help radiologists to improve the diagnostic process. In
this work a chapter is totally dedicated to the usage of new technologies such as the WEB or Cloud Computing as instruments for daily clinical practice.
2.0.2
CAD systems: state-of-art and challenges
There are several reasons for the inconsistency mentioned in Section 2.0.1: a CAD system needs to be fast and easy to use since radiologists are not used to operate with this tool and it needs to be reliable. It is possible to highlight at least three different kinds of issues which are currently limiting the spreading of CAD systems into clinical practice: software-related, hardware-related and protocol-related.
Software-related issues
The standard approach to make CAD algorithms available in clinical routine of health facilities is the deployment of stand-alone workstations. These workstations are usually equipped with a vendor-dependent Graphic User Interface (GUI) and usually offered by the manufacturer of the scanner with a closed source operating system. Since the algorithms are protected by copyrights, it is not possible to access their internal properties or features. Furthermore, usually there are no scientific publications validating their real performances (including, for example, the validation of the algorithms on external data-sets using an objective and common evaluation metric). In addition, the software usually has very high license costs. Due to its standalone operating systems, additional costs can be charged for the integration of the workstation with software already present in the hospital facility, such as for example the PACS (Picture Archiving Communication System) which manages the storage and transfer of medical scans after their acquisition. Additional impacts on costs are due to the upgrade of the software because of its rapid obsolescence. In fact, considering the rapid developments in the field, more performing CAD systems could be available on the market. Having an up-to-date CAD system is fundamental to benefit from its additional features which could improve its overall detection sensitivity. If these costs can be partially absorbed or accepted by big clinical centers, they can represent a real problem for small clinical facilities.
12 M5L: a Web- and Cloud-based on-demand CAD
Hardware-related issues
The computational power required by an algorithm usually increases with the algo-rithm complexity. This means that high performing algoalgo-rithms require dedicated powerful hardware, usually sold by the manufacturer. Sometimes running several CAD algorithms in parallel and combining their results can require computational power which is not precisely predictable. In addition, if the CAD tool needs to be used during a massive screening campaign, where hundreds of scans have to be analyzed as fast as possible, a flexibility in the allocation of computing resources becomes fundamental. Considering that screening campaigns can be concentrated in a given period and that the number of CTs which need to be analyzed is much larger than the average number of CTs analyzed during clinical routine, buying a new more powerful hardware only for screening would not be a cost-effective choice. The high computational power will be then only used for screening campaigns, but only a small part of it will be needed for clinical practice. This reason has motivated researchers to optimize the solution for the computation of CAD algorithms. In the past, prototypes for handling the analysis of medical images using a distributed environment were proposed. These solutions were based on the usage of GRID infrastructure, which has been deeply used for high-energy physics projects [36] [37]. Unfortunately, the GRID-approach is not suitable for the majority of Medical Physics applications due to the rigidity and complexity of the infrastructure. In addition, the management of a GRID infrastructure requires dedicated man-power to monitor and maintain the service, which is usually not available (and not cost-effective) in a clinical structure.
Protocol-related issues
Guaranteeing the possibility to share CAD results and medical annotations between radiologists can improve the effectiveness of the diagnosis. The definition of refer-ence standard, and more generally oftrue nodulecan vary a lot between radiologists of difference experience. A study [38] analyzed the variability of thetruthdefined by different combinations of experienced radiologists. In addition, the performances of the radiologists were analyzed with respect to different definition of reference stan-dards. The study highlights the importance of forming a panel of different reviewers when annotating a study, to investigate different approaches used by radiologists
in the diagnostic process. A more detailed study [39] showed how review panels composed of 8 or 10 experts achieved a sensitivity greater than that of the most experienced radiologist in the panel. These studies stressed the importance of sharing and combining annotations by different radiologists of different level of expertise to increase the diagnostic sensitivity. Unfortunately, the choice of using stand-alone workstations makes almost impossible to share medical annotations and CAD results between clinicians from different institutions. Developing and providing a CAD system which can be accessed by radiologists all over the world seems to be a manda-tory challenge to be faced to improve the diagnosis and detection of pathological ROIs between radiologists. In addition, small clinical facilities sometimes do not have a daily pool of resident experienced radiologists. Giving to these facilities the possibility to ask immediately for a remotely consultation by an experienced radiologist from other structures could be fundamental to improve the diagnosis and reduce costs.
2.0.3
The algorithms
M5L is the combination of two independent CAD systems running in parallel: the Channeler Ant Model (lungCAM) and the Voxel-Based Neural Approach (VBNA). The common step for all the algorithms is the segmentation of the lungs, which is performed using a 3D region growing [40] which includes also the elimination of the trachea. The lung mask is then used as input for the next steps of the algorithms.
lungCAM
This algorithm is based on the simulation of the life-cycle of colonies of virtual ants [41]. They can be released within a seed point inside the lungs and they move inside the volume of the lungs. During their motion they release pheromone according to some predefined rules. Voxels visited by ants are removed and the new ant colony is deposed in the unvisited voxels. The key point of this algorithm is to interpret the CT voxel intensity as the amount of food available, which is progressively reduced during the ant feeding. With this approach, brighter structures, more likely to be nodules, are more likely to be visited by the ants. The probabilityPi j that a destination is
14 M5L: a Web- and Cloud-based on-demand CAD
visited is defined as:
Pi j(νi→νj) =
W(σj)
∑n=1,26W(σn)
whereW(σj)depends on the amount of pheromone in the voxelνj. The candidate
detection algorithm ends when all the ants in colonies die. The output is a list of segmented 3D objects. False positive reduction is performed using a classifier based on 13 features including spatial, intensity and morphological features. The relative small number of features wants to keep the classifier more general as possible avoiding the possibility of over-training. The classifier is a feed-forward artificial neural network (FFNN) with the following architecture: 13 input neurons, 1 hidden layer with 25 neurons and 1 neuron as output layer (giving the probability of the finding to be a real nodule).
VBNA
This algorithm makes use of two different procedures to detect nodules inside the lung parenchyma [42] [43] and attached to the pleura [44]. Nodules candidates inside the parenchyma are found using a dot-enhancement filter plus a multi-scale approach [42] in order to keep into consideration the variability of nodule sizes. The candidates are extracted as the local maxima of the image after the application of the filter. Nodule candidates attached to the pleura are found building normals to the lung wall. The number of normals passing through the voxels are then summed to define a score and the candidates are extracted as the local maxima of the scores. False positive reduction is performed using a Support Vector Machine (SVM) using raw voxels as feature vectors. [43] [44]. The output of the classifier is a list of findings with an associated probability to represent a real nodule.
Combination and Validation
The outputs from the two previous algorithms are then combined. First, a spatial matching between the findings is performed: if the Euclidean distance between two findings is less than 1.5 times their mean diameters, they are merged and considered as a single finding. Since the two classifiers give different probabilities, the average probability is associated to the weighted for different performances of the two algorithms [45]. The M5L CAD has been largely validated in terms of FROC (Free
Response Receiver Operating) curves as described in [46]. The overall sensitivity reaches the value of 80% at 4 False Positive findings per scan. This is a remarkable result considering the size (more than 1000 scans) and the heterogeneity (including both screening and clinical scans with different kind of resolutions) of the validation data-set.
2.0.4
The WEB front-end
The first issue we decided to tackle was to make the M5L results available to radiologists without requiring any software installation in their clinical facilities. One of the desired requirements was to permit to the radiologists not only to access and visualize CAD results, but also to insert their medical annotations of the submitted cases. In addition, the system had to allow the possibility to operate with the CAD in the reading approaches presented in the previous chapter. We followed these requirements when designing and implementing the WEB-based interface, which is accessible at (http://m5l.to.infn.it). The M5L service is available as WEB tool and can then be accessed with any browser using desktop, tablets and mobile devices. The core of the interface infrastructure has been built using the open source tool DRUPAL [47]. DRUPAL has the advantage to present a modular core with a system of hooks and callbacks that can be accessed using Application Programming Interface (API) [48]. This solution allows to use DRUPAL’s standard features (e.g users and contents
management)out-of-the-box. Conversely, it also provides a customizable platform
with the possibility to build third-party contributed modules without changing its core code. The development of modules can be easily performed using PHP. The main advantages of DRUPAL can be summarized as follows:
• highly scalable: it can manage high-traffic conditions;
• mobile scalable: all the contents of DRUPAL can be visualized also on mobile devices. The optimization of the design and the visualization is automatically performed according to the device accessing the site;
• security: it has a very detailed system of managing the security of the contents. The site admin can define different sets of users with different kinds of grants and then control the access to protected contents;
16 M5L: a Web- and Cloud-based on-demand CAD
• content as a service: it has structured data models allowing to display content with multiple views according to the requests of the users.
For our project, four dedicated custom modules have been developed: • DICOM information retrieval;
• submission; • annotation; • review.
In order to operate with the features of previous modules, three different user profiles were created:
• submitter: associated to a technician who uploads the study case and selects the radiologist reviewing the study;
• reviewer: associated to a radiologist who can review the study cases and access CAD results;
• administrator: the manager of the WEB site with full grants.
DICOM Information Retrieval Module
This module is a dedicated PHP class which allows to retrieve information about the submitted case based on the DICOM properties of the image itself. DICOM (Digital Imaging and Communication in Medicine) is the international standard for medical images and related information (ISO 12052) [49]. It is used to define the formats of medical images which can be exchanged and the quality of clinical data. DICOM is implemented in almost every radiology, cardiology imaging, and radiotherapy device. When a medical image is stored as a data, not only it contains the image data, but also the meta data belonging to the patient (e.g. age, sex, name) and to the examination (e.g. date of acquisition, modality). The developed class reads some of the most important DICOM tags (e.g. properties of the image) of the submitted study and stores them. This class also has a dedicated method which can check the conformity of a DICOM study, such as for example the quality of the images (e.g.
Fig. 2.1 Screenshot of the M5L submission form as seen by a submitter logging in with proper credentials.
minimum number of slices). In addition, the tool checks if the study is anonymized and if not, provides a full anonimization of the case, removing any data which can be associated to sensitive information of the patients.
Submission Module
This module has been conceived to be used by a technician. Its main goal is to submit study cases for CAD computations and select one or more radiologists for the review of the submitted case. A screenshot of the module is shown in Figure 2.1. The user, who has the grants to act as a submitter, connects with proper credentials to the WEB service. The available fields of the submission form are here explained:
• CASE ID: this is a unique identifier (alphanumeric characters without space) which is associated to the case. If the chosen ID is already present in the server, an error message is displayed and a new ID is asked, in order to avoid data corruption and duplication;
• Type of study: the user can choose between Screening study or Clinical study. It can be expanded with additional developments including the possibility to relate the submitted study to previous exams of the same patient;
• Upload browser: the uploaded file must be a compressed zip file containing only one valid DICOM study. In case of wrong format upload, a warning is returned to the user. In case of uploaded file with more than one DICOM study, only the first DICOM study will be processed, while the others will be skipped;
18 M5L: a Web- and Cloud-based on-demand CAD
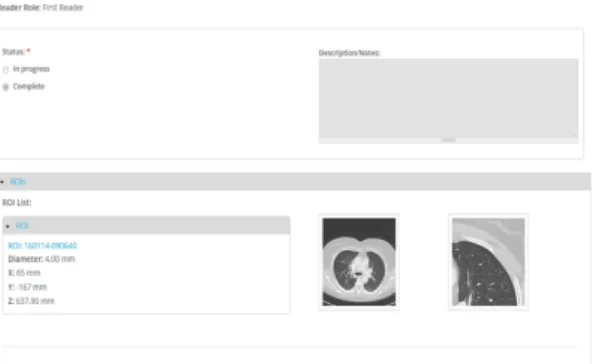
Fig. 2.2 Overview of the annotation module with an example of selected ROI. Screenshot on the left is the global axial view of the slice corresponding to the finding, while the screenshot on the right is the cropped zoomed view of the finding. Additional information about properties of the ROIs can be displayed clicking on the ROI name.
• Reviewers panel: the reviewer can choose, from the list of registered users, one or more radiologists who will review the case.
Reviewers can be chosen not necessarily belonging to the same institution, allowing the possibility to have multicentre annotations. In addition, the submitter has to chose the reading role of the reviewer: first reader or second reader (as explained in previous chapter). After the case have been submitted and the checks on anonymization and quality of the images are fulfilled, the study case will be analyzed by the CAD in a dedicated back-end which will be presented in Section 2.0.5. An e-mail will alert the submitter when the cases will have been processed. Consequentially all the selected reviewers receive an e-mail with the link to insert the medical annotations of the associated cases. With this asynchronous procedure the submitter can upload bunches of cases without waiting for CAD processing completion, while reviewers are finishing their medical reports.
Annotation Module
This module has been conceived to be used by a radiologist. Its main goal is to allow medical annotations of submitted cases by the radiologists through a dedicated WEB form. The radiologist, connecting with proper credentials, can access the list of associated cases and insert his / her annotation. A screen shot of the module is shown in Figure 2.2. The WEB form was built in order to give the possibility to include a detailed annotation, with details about morphological properties of the pathological ROIs. This level of details is a bit simpler than the usual protocol of
annotations followed in clinical practice with the annotation provided as a free-text description. In our approach we followed the guidelines listed by the Lung Image Database Consortium (LIDC) [50], a big initiative aiming at collecting a large-scale of annotated clinical data. The main reasons supporting our choice were:
• definition of a common protocol for the annotations: since there are no strict guidelines available for medical annotations of CT scans, we decided to propose to radiologists a common structured quantitative panel for annotations with the aim of homogenizing the medical report;
• facilitating data retrieval and queries: retrieving data from a free text box can really represents a difficult and time consuming task. The usage of quan-titative scores and numbers for the properties of the findings facilitates the possibility to perform queries and statistics. In addition, it makes clinicians and researchers able to use these raw data for additional analyses (including for example the feeding of risk predictor algorithms);
• collecting a data-set of annotated clinical data: precious information that allows to train and validate the classifiers. The scarce availability of annotated anonymized clinical data still represents an issue. Collecting and sharing those data can improve the developments in the field.
A description of the fields available for annotation is then provided:
• Diameter: this is the nodule diameter (in mm) measured by the radiologist. If the finding does not have a perfect spherical structure (e.g. it is an ellipsoid), the diameter is taken as the length of the major axis;
• Position: 3D spatial positions (x,y,z) of the finding in mm;
• Subtlety: it is a measure of how difficult the nodule was to be detected ac-cording to the experience of the radiologist. Its score goes from 1 (Extremely Subtle) to 5 (Obvious);
• Internal Structure: it is used to classify the internal properties of the nodule: it goes from 1 (Soft tissue) to 4 (Air);
• Sphericity: it is used to classify if the shape of the nodules deviates from a symmetric spherical shape: it goes from 1 (Linear) to 5 (Round);
20 M5L: a Web- and Cloud-based on-demand CAD
• Lobulation: it is used to rank the degree of lobulation, defined as an appearance resembling lobules: it goes from 1 (None) to 5 (Marked);
• Texture: it is used to classify the type of nodule: it goes from 1 (Non solid / GGO) to 5 (Solid);
• Calcification: it is used to highlight if the nodule presents a calcification pattern: it goes from 1 (Pop-corn) to 6 (Absent). Calcified pulmonary nodules are less likely to be malignant;
• Margin: it is a description of how well the margin of the nodule is defined: it goes from 1 (Poorly) to 5 (Sharp);
• Spiculation: it is used to quantify the edges of the nodule: it goes from 1 (None) to 5 (Marked). Typically, benign nodules have well-defined borders while malignant nodules are irregular or elongated;
• Malignancy: it is defined as the subjective assessment of the likelihood of malignancy, assuming the scan originated from a 60-year-old male smoker: it goes from 0 (Highly Unlikely to be cancer) to 4 (Higly Suspicious to be cancer). It is worth to notice that this is a qualitative assessment of the malignancy of the finding based on its visual properties. Only additional investigations can provide a proof of malignancy. Conversely, it is interesting to see how visual properties of the nodule influence the radiologist in the perception of malignancy.
Review Module
This module has been conceived to be used by a radiologist. Its main goal is to allow the review of CAD marks by the radiologist. The radiologist, connecting with proper credentials, can access the list of CAD marks of associated cases in two ways. If he / she was selected as first-reader, CAD marks will be automatically made available only when the first unassisted reading will be declared complete. If he / she was selected as second-reader, CAD marks are directly available during the annotation. A preliminary check is performed in order to compare CAD marks to annotated finding. If a CAD mark is spatially matched with any finding in the list, it is automatically marked as True Positive and it is assigned the same malignancy of the corresponding annotated finding. The remaining findings need to be marked by the radiologist
Fig. 2.3 Screenshot of the review module. Connecting with proper credentials, the radiologist has marked CAD findings as True Positive, False Positives, or Irrelevant.
Fig. 2.4 Screenshot of the Osirix plugin with underlined a CAD mark in the circle. The radiologist can scroll through the slices and reject or accept the CAD mark. In this last case the mark is added on radiologist’s annotation.
as: False Positive, Irrelevant (according to definition provided in [45]) and True Positive. In this last case, the radiologist is asked to specify the malignancy score. True Positives represent the nodules originally missed by the radiologist in the first unassisted reading and when the reviewing process is completed, they are added to the final annotation.
A screen shot of the the reviewing module with some examples is shown in Figure 2.3. CAD results can be downloaded in several formats (PDF report, XML and DICOM Structured Report) or visualized with a dedicated plugin for Osirix viewer [51]. Osirix is a DICOM viewer for iOS systems which is quite spread in clinical facilities. The plugin allows, after having downloaded the CAD results in XML format, to visualize and scroll CAD marks directly on the images. It allows the possibility to pre-load the list of findings from the radiologist and the list of CAD marks. A screenshot of the plugin is shown in Figure 2.4.
22 M5L: a Web- and Cloud-based on-demand CAD
2.0.5
The Cloud back-end
As mentioned at the beginning of this Section, previous attempts to introduce parallel computing solutions to process CAD algorithms mainly failed due to the high rigidity and complexity of the infrastructure. The advent of Cloud Computing seems to solve previous issues. Cloud Computing is a model for enabling ubiquitous, convenient, on-demand network access to a shared pool of configurable computing resources (e.g., networks, servers, storage, applications, and services) that can be rapidly provisioned and released with minimal management effort or service provider interaction [52]. The main characteristics of Cloud Computing are:
• on-demand capabilities: the customer has access to the service maintained by the provider without having to take care of the infrastructure. In addition, the user can access the services directly on-line with an internet connection and can have the capability to change directly on-line the level of the service, or ask the provider to take care of the changes. This is typically referred as
pay-for-what-you-usescenario, in which there can be a monthly subscription to have full access to the services or an on-demand option only when services are needed;
• broad network access: the services can be accessed everywhere since there is full compatibility with smartphones, laptops and tablets. This features become fundamental to allow users to work remotely on their projects from every location;
• resource pooling: it is possible to access (and monitor) computing resources from everywhere, having at disposal a flexible computational power adapting automatically to the required workload;
• rapid elasticity: it is possible not only to have available elastic computing re-sources, but also a real-time management of software features, users according to real-time business needs;
• storage and backup: it is possible to have a dedicated multi-site protected storage in which there is no risk of loosing data.
• Infrastructure as a Service (IaaS): the provider offers to the consumer pro-cessing, storage and computational resources. The user deploys and runs the
software making use of these resources. The customer is totallyblindabout
the underlying Cloud infrastructure, whose control is managed by the provider. Conversely, the user has the control of the application running within this infrastructure;
• Software as a Service (SaaS): the provider gives the user its applications running on the Cloud infrastructure. The applications can be accessed by the user, usually through a WEB browser. The user does not have control on both applications and Cloud infrastructure, excluding some customization on some user-specific configuration settings;
• Platform as a Service (PaaS): the provider has the infrastructure, but it acquires applications developed by the customer. The customer does not have control on the infrastructure, but has total control on the applications. This solution is mainly used by developers.
Cloud Computing has entered with great force our daily life in recent years. An example of IasS is represented for example by Microsoft Azure [53]. Computational resources are provided to the users with different kinds of services, including for example storage. An example of SaaS is represented by Amazon, which offers to the users e-marketing services running on their private Cloud. An example of PaaS is represented by App Engine [54] launched by Google with the intent to offer a platform for app developers to run, test and share their code on a dedicated Cloud infrastructure. When looking at medical physics projects, Cloud Computing seems to be the best solution to tackle and solve mentioned issues with parallel computing. In particular, one of the key points of Cloud Computing is the elasticity of computational resources when allocated. The resources can automatically scale up or down in case of an increase or a decrease of the workload. This feature fits perfectly in the situation of a hospital facility, where resources can be adapted to the number of the submitted cases for CAD computations. Considering for example a scenario during a screening campaign: due to the high number of acquired CT scans we will face a peak in the demand of the computational resources. Conversely, there will be a decreasing during clinical routine, where the number of submitted CTs is much lower than during screening campaigns. Adopting a IaaS solution allows to free the users from buying static hardware to run CAD algorithms. Conversely,
24 M5L: a Web- and Cloud-based on-demand CAD
Fig. 2.5 Pictorial view of the M5L on-demand system. CT are submitted directly as soon as acquired from the WEB front-end. While the user is submitting other CTs or inserting medical annotations, previous scans are copied to the Cloud back-end and analyzed by the CAD. When the computations are completed, CAD results are copied back in the front-end and users are alerted with an e-mail containing the links to retrieve CAD results.
adopting a SaaS solution allows to free the users from buying additional software
to access CAD results. Our proposed solution was calledCAD on-demand, since it
combines both the IaaS and the SaaS approaches. The SaaS approach is represented by the WEB front-end and the M5L CAD, while the IaaS approach is represented by the dedicated Cloud back-end where the CAD algorithms run. A pictorial view of the M5L on-demand system is shown in Figure 2.5. The user submits study cases and selects reviewers through the WEB front-end. As soon as submitted, cases are processed by our CAD in the dedicated Cloud back-end. While the cases are being processed, the user can submit other cases or the reviewers can insert their medical annotations. A mail-based system will notify the users at the end of the processing. When the cases have been processed the results are copied back from the Cloud to the WEB server and the computational resources in the Cloud are free again to accept additional cases. The M5L CAD on-demand is hosted by the INFN Torino Computing Center. This center has a long story of computing applications, since it is a Tier-2 of the Large Hadron Collider (LHC) Computing Grid [55]. The main motivations for setting up a Cloud facility were to support a large number of applications (not necessarily of particle and nuclear physics) and to reduce the man-power required to manage a Tier-2 infrastructure. To reach this goal a Cloud infrastructure was deployed [56]. We decided to use all open sources tool to manage and control the facility. The main tool is Open Nebula [57], which is a free and open-source Cloud Management Platform. Its basic features are the possibility to manage hardware and infrastructure, but also the capability to manage virtual machine life-cycle. The basic idea of Open Nebula is to orchestrate storage, virtualization, monitoring and security in order to deploy computing facilities as
virtual machines on distributed infrastructures. The M5L version can be considered as formed by:
• one physical host used as WEB server;
• different virtual machines (VMs) representing the computational power. We deploy the VMs using a specific sandbox (as prescribed by the IaaS approach) within a private network with a router with a public address which allows external access and connection with the WEB server. Presently, we can deploy up to 18 VMs and a total number 48 of cores (processing units). The storage is a 100 GB persistent ISCSI (Internet Small Computer System Interface) which is exported within the different VMs using NFS (Network File System). The disk is used for temporary storage of CT scans and CAD results, which are then copied back to the WEB server. In order to have the possibility to scale resources, an elastic cluster was created based on CERNVM Online system [58]. This system gives the possibility to create clusters formed by a head node (where the monitoring tools are installed) and many workers based on micro-CERNVM OS [59]. Two additional tools are used: HTCondor and Elastiq. HTCondor [60] can be considered as a batch system for managing compute-intensive jobs: taking as input a serie of parallel jobs, it is responsible for the correct management of job queuing, progress monitoring and notifying the user after the completion. Elastiq is a dedicated daemon written in Python which makes possible for resources in a cluster to scale up and down automatically. The basic idea underlying all our infrastructure is to limit the waste of computing resources. If some submitted CTs are waiting in the queue of HTCondor more than a predefined time (which can be tuned by the user), Elastiq deploys new workers so that they can be analyzed. Conversely, if some workers remain idle for a certain time, they are released and made available to other users of the Cloud. This is in line with the model of the Cloud calledmulti-tenant model, where resources are shared between different projects. There is no risk that users from different projects can access or create damages outside their projects, since an automatic systems of grants and securities manages the privileges of the users. Considering that M5L is the combination of two independent sub-systems, we set up two different jobs in HTCondor, so that the algorithms can run in parallel. HTCondor was configured to run a maximum of two jobs per worker at the same time. This configuration is needed in order to keep some cores free allowing multi-threading (i.e. splitting an algorithm into several processes on different processing units) and speed up the analysis.
26 M5L: a Web- and Cloud-based on-demand CAD
Fig. 2.6 Distribution of jobs and their completion time during the first phase of stress test: 100 exams submitted in one bunch.
Stress Test Configuration and Results
We decided to test the performances and the robustness of the system doing a stress-test. This stress-test was also motivated by the aim of simulating workloads comparable to daily clinical practice. We prepared a dedicated script written in Python which can submit cases to M5L in two phases: a peak submission and then progressively submission from different centers. The first scenario was used to simulate the case where a center sends all the studies in one bunch (it can be thought as for example due to a night batch routine process). 100 exams have been submitted in one bunch to M5L in less than 10 minutes, filling all the available slots of virtual machines. In the second scenario, we simulated three different medical centers with different parameters:
• large center: submission of an exam every 10 minutes. Total number of exams submitted: 100;
• medium center: submission of an exam every 20 minutes. Total number of exams submitted: 30;
• small center: submission of an exam every 30 minutes. Total number of exams submitted: 10.
We defined the size and the submission rates after investigating the activities of radiology departments in Italian hospitals. A total of 240 exams were successfully analyzed by M5L. The average number of slices per exam was 280. In average, each exam was processed in 19 minutes. This corresponds to the computational time of the slower algorithm (lungCAM) plus the time for the combination of results which can be considered as negligible (less than 5 seconds). Figure 2.6 and Figure 2.7 show the number of submitted, running and completed jobs during the first scenario
Fig. 2.7 Distribution of jobs and their completion time during the second phase of stress test: 140 exams with a slow and steady submission rate.
and the second scenario respectively. As we can notice from the first Figure, all the 100 cases were processed in approximately 4 hours. Conversely, in the second Figure the completion rate almost matches the submission rate. In both the Figures it is possible to notice a gap between the start of the submission and the peak in the processed jobs. We can explain this referring as the waiting time due to the re-allocation of computational resources which were currently being used by other applications. Since, as mentioned, the infrastructure is shared with several other projects, it is possible that there is a certain waiting time till the resources are released. The results are satisfactory, the system reacted as expected to the workloads and there were no cases which failed. Furthermore, the computational time is acceptable for an application in clinical practice, although it could be optimized
2.0.6
Conclusion and Discussion
After having developed and validated a complete CAD system for the automatic detection of pulmonary nodules, we have faced the problem of wide-spreading the usage of CAD among the biggest community of clinicians and of simplifying the access to the M5L CAD (or any other CAD system). We have developed a dedicated infrastructure based on a WEB front-end and a Cloud back-end. This infrastructure introduces a new paradigm of CAD in clinical practice: the CAD on-demand. The solution frees the users from buying additional software or hardware to access CAD results. This can have potential impact on reducing costs in hospital facilities, while introducing the benefit of supporting the radiologists with CAD systems in the detection process. The stress tests showed how this research prototype could be ready to expand its network of users potentially for a large scale service. In addition, the system allows multi-centre annotations, making possible also to small clinical facilities (which sometimes do not have a resident experienced pool
28 M5L: a Web- and Cloud-based on-demand CAD
of radiologists) to benefit from the expertise of other structures. The Saas approach allows to combine several CADs, which have been demonstrated to have benefits on the overall performance [45] (the topic of combining CAD systems will be treated in detail in Chapter 3) with limited effort. The work remains open for additional developments both on the front-end and the back-end side. The front-end WEB could include a detailed viewer Java based (so that accessible from laptops and mobiles) providing a detailed and robust on-line diagnosis workstation to be applied for example in remote health projects. The parameters on the Cloud have not been tuned, but they can include for example the possibility to assign a priority code to the submitted cases, so that urgent and difficult cases can be processed as soon as possible. Only a daily usage of the system in clinical facilities will provide clinical requirements for additional developments. In addition, further features of the M5L CAD could be improved. One of the most desired features would be the possibility to compare different exams of the same patients taken sequentially along time (i.e, longitudinally). The goal of this development is to provide to radiologists the possibility to automatic follow and compare the evolution with time of the detected
pathological ROIs (usually referred asLongitudinal Analysis). These developments
on the algorithms should then be followed by parallel developments on the front-end infrastructure in order to provide to clinicians a real on-demand decision support platform for the diagnosis.
Combining and Comparing CAD
systems on large-scale datasets: the
LUNA16 challenge
3.0.1
Motivation
A large number of CAD algorithms for the automated detection of pulmonary nodules have been discussed in the literature. In addition, the number of available commercial CAD systems has rapidly increased. However, comparing these systems in terms of performances is far from being a trivial task. In fact, it is not possible to compare directly the sensitivities of the systems, since they can vary tremendously. The main reason underlying this inconsistency, is that the evaluation can strongly depend on the different datasets used for training and evaluation. It would not be fair and objective to compare CAD systems evaluated on a different datasets, since this operation cannot exclude possible biases. A detailed large-scale evaluation and comparison of state-of-art developed CAD systems has not been published in literature yet. A step toward an objective evaluation of CAD systems was the ANODE09 study [45]. 7 different CAD systems were evaluated on a common data-set of 50 scans using an objective metric. A really important improvement of this work is to significantly increase the evaluation dataset up to 1 order of magnitude together with including recent state-of-the-art algorithms. This last point becomes even more important when considering recent techniques, for example, for classification and false positive reduction such as Convolutional Neural Networks (CNNs) [61]. These techniques
30
Combining and Comparing CAD systems on large-scale datasets: the LUNA16 challenge have been deeply used in the field of imaging recognition, but only recently have been applied by machine learning researchers to the field of medical imaging. Another interesting study introduced in [45] investigated how combining different CAD systems influences the overall performance. Results showed how the combinat