2008 AP P LI E D AN DN ATURAL SCIENCE FO U N D A TIO N ANSF
JANS
Journal of Applied and Natural Science 7 (2) : 927 - 934 (2015)
Combining ability and gene interaction study for yield, its attributing traits
and quality in common wheat
Anil Kumar, Harshwardhan, Amarjeet Kumar and Birendra Prasad
Department of Genetics and Plant Breeding, College of Agriculture, G. B. Pant University of Agriculture and Technology, Pantnagar,Udham Singh Nagar- 263145 (Uttarakhand), INDIA
*Corresponding author. E-mail: [email protected]
Received: February 17, 2015; Revised received: October 3, 2015; Accepted: November 15, 2015
Abstract: Combining ability and nature of gene interactions that contribute to yield and its attributing traits were in-vestigated using 21 wheat hybrids developed by crossing 7 varieties in a half diallel mating design. Estimate of GCA effects exhibited that the parents UP2672, UP2526 and WH542 were identified as good general combiners revealing
their ability in transmitting additive genes in desirable direction to their progenies. Hybrid viz., PBW 621 × UP 2425
(15.125) found to be the best specific crosses for grain yield plant-1, whether, WH 542 × HD 2967 (22.587) and UP
2526 × UP 2425 (14.490) had the highest SCA for biological yield plant-1 and harvest index, respectively. However,
the best specific cross combinations for other characters were found for WH 542 × QLD 40 (-3.694) for days to ma-turity, PBW 621 × UP 2526 (-3.819) for plant height, HD 2967 × UP 2526 (7.527) for 1000 grain weight and WH 542 × UP 2672 (2.077) for sedimentation value. While crosses PBW 621 × UP 2425, UP 2526 × UP 2425 and QLD 40 ×
UP 2425 were found to be the best specific combiner for the characters number of productive tillers plant-1, grain
yield plant-1, spike length, grain weight spike-1, harvest index, days to 75 % heading and protein content.
Keywords: Combining ability, Common wheat, Diallel cross, Gene interaction, Quality, Yield
INTRODUCTION
India is one of the wheat producing countries of the world. It produced 94.88 million tonnes wheat on an area of 29.90 million hectare (3173.24 kg/ha) (Anonymous, 2013) but geometrical increase in India’s population has been a challenge for agricultural scien-tists. Global demand for wheat is growing at approxi-mately 2% per year, twice the current rate of gain in genetic yield potential (Skovmand and Reynolds, 2000). Advancement in the yield of wheat requires certain information regarding the nature of combining ability of parents available for use in the hybridization program, and also the nature of gene action involved in expression of quantitative and qualitative traits of eco-nomic importance (Hassan et al., 2007). For the devel-opment of genetically superior high yielding varieties, identification of superior parents is an important pre-requisite (Prasad, 2014).
The combining ability analysis provides useful infor-mation regarding the selection of better parents for hybridization programme. A speedy improvement can be brought about by assembling the desirable genes, locating the best combiners and exploiting the hetero-sis (Prasad et al., 2005). Combining ability analysis (Sprague and Tatum, 1942) is one of the powerful tools available which gives the estimates of combining ability effects and aids in selecting desirable parents and crosses for further exploitation. The combining
ISSN : 0974-9411 (Print), 2231-5209 (Online) All Rights Reserved © Applied and Natural Science Foundation www.ansfoundation.org
ability analysis developed by Griffing (1956)provides useful information regarding the selection of parents in terms of the performance of their hybrids. This analy-sis further elucidates the nature and magnitude of vari-ous types of gene actions involved in the expression of quantitative characters which help in choosing the par-ents for hybridization programme (Prasad et al., 2012). Since the development of new cultivars through hy-bridization is a continuous process, information on combining ability of new cultivars remains important. The choice of parents is a very important task in a breeding program.
Combining ability studies are used by plant breeders to select parents with maximum potential of transmitting desirable genes to the progenies. The estimates of general combining ability (GCA) are very useful be-cause the variance due to general combining ability is attributable to additive gene action and A x A inter-action which can be fixed in further generations, while the variance due to specific combining ability is attrib-utable to non-additive gene action. Breeders should concentrate on development of productive wheat varie-ties by crossing good general combining lines for grain yield and selecting transgressive segregants from the resulting hybrids. Diallel mating design has been ex-tensively used to analyze the combining ability effects of wheat genotypes and also to provide information regarding genetic mechanisms controlling grain yield and other traits (Rajesh et al., 2012). Among the
qual-928 928 928 928 928
ity parameter in wheat, protein content and sedimenta-tion values are most important desirable characters preferred for nutrition and chapatti quality (Kumar et al., 2015a).The significance of present study was de-signed to find out the good general combining geno-types for sound breeding program and to select high yielding combiners for the development of productive wheat varieties and good specific combiners for selec-tion of transgressive segregants.
MATERIALS AND METHODS
The present investigation was carried out at Norman. Ernest. Borlaug. Crop Research Centre of Govind Bal-labh Pant University of Agriculture and Technology, Pantnagar, India. The material for the present study was developed during Rabi 2012-13 and the progenies were evaluated in the next Rabi season of 2013-14.Seven genetical diverse wheat varieties i.e. WH 542, HD 2967, PBW 621, UP 2526, QLD 40, UP 2672 and UP 2425 was crossed in diallel mating design ex-cluding reciprocals. The parents and F1 seeds of 21 crosses along with 2 checks i.e. DPW 621-50, UP 2526 were planted in a randomized complete block design with 3 replications. Parents and F1 were grown in two rows plot of 1 metre length in each replication during
Rabi 2013-14. The plant to plant distance was
main-tained at 10 cm and row to row as 20 cm. The material was planted in mid-November, 2013-14 under high fertility timely sown conditions. Wheat varieties were crossed with each other in a half-diallel mating design, resulting in 21 hybrid combinations, equal to p (p - 1)/2, where p is the number of parents used. The par-ents, F1 hybrids and checks were grown in a random-ized block design in three replications. Each plot in a replication comprised of parents and F1’s having dou-ble row of 1m length. The rows were spaced in 20 cm apart and plant-to-plant distance was maintained at 10 cm by dibbling. Observations were recorded on the whole plot basis for days to 75% heading and days to maturity, whereas the character like plant height, num-ber of effective tillers per plant, spike length, numnum-ber of spikelet per spike, number of grains per spike, grain weight per spike, 1000 grain weight, grain yield per plant, biological yield and harvest index were taken over five randomly selected competitive plants from each plot. Harvest index was calculated in percentage by the proportion of total grain yield in comparison to biological yield. For estimation of quality parameter in terms of protein content and sedimentation value sam-ples were analyzed with the help of Near Infrared Transmission based Whole Grain Analyzer (Infratech 1241 Grain Analyzer). Combining ability analysis was carried out according to Griffing’s (1956) method 2 of model 1.
RESULTS AND DISCUSSION
Analysis of variance revealed highly significant differ-ences among the parents and their F1 hybrids for all
the characters days to 75% heading, days to maturity, plant height, number of effective tillers per plant, spike length, number of spikelet per spike, number of grains per spike, grain weight per spike, 1000 grain weight, grain yield per plant, biological yield and harvest index (Table 1). Significant genotypic variation for all the characters was further partitioned into variation due to general combining ability (GCA) and specific bining ability (SCA) The analysis of variance for com-bining ability was performed for yield, its contributing traits and quality traits. Mean squares due to general combining ability (GCA) and specific combining abil-ity (SCA) were significant for all characters except for number of grains per spike and number of spikelets per spike. It showed that both additive as well as non-additive genetic variances were important for the ex-pression of the characters studied. The estimates of general combining ability (GCA) and specific combin-ing ability (SCA) effects for different characters are described character wise here under
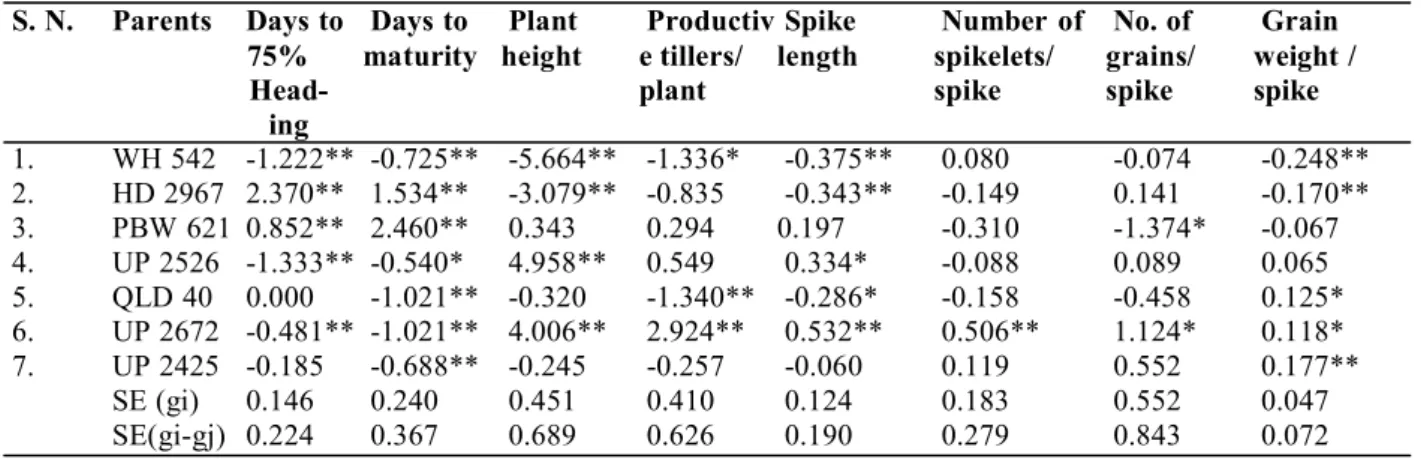
Days to 75% heading: Among the parental lines WH
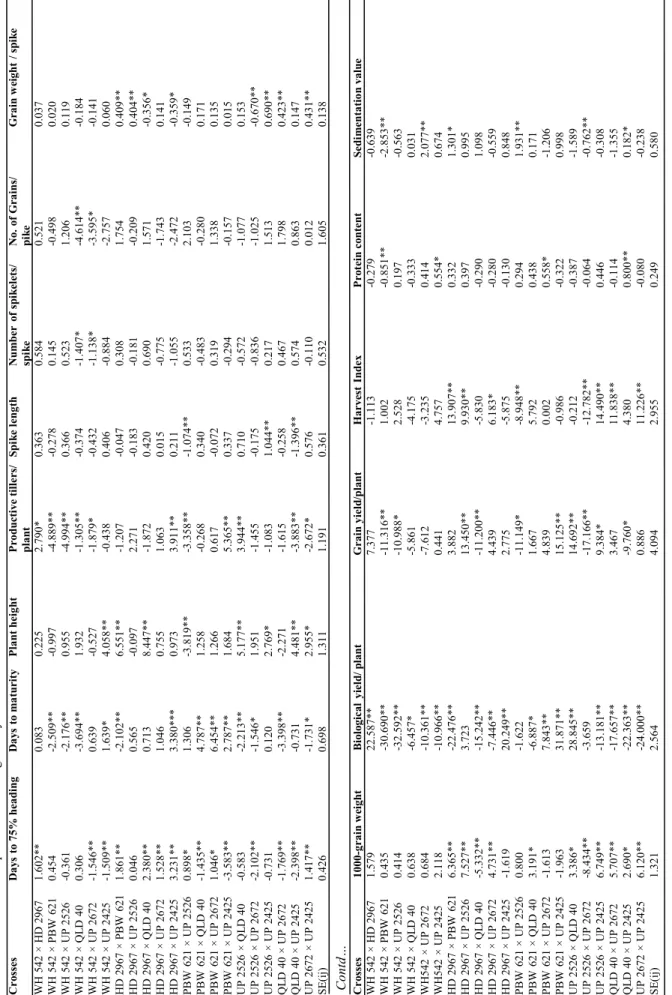
542 (-1.222), UP 2526 (-1.333) and UP 2672 (-0.481) were having significant negative GCA effects while HD 2967 (2.370) and PBW 621 (0.852) had significant positive GCA effects. Parent UP 2526 and HD 2967 were found as the best and poorest general combiners, respectively. Fifteen crosses showed significant SCA effects out of which seven exhibited effects in negative direction while eight in positive direction. The crosses viz. WH 542 × UP 2672 (-1.546), WH 542 × UP 2425 (-1.509), PBW 621 × QLD 40 (-1.435), PBW 621 × UP 2425 (-3.583), UP 2526 × UP 2672 (-2.102), QLD 40 × UP 2672 1.769) and QLD 40 × UP2425 (-2.398) exhibited significant values of SCA effects in negative direction. PBW 621 × UP 2425 found as the best cross combination for earliness. Earliness is a de-sirable feature for any variety so, negative GCA effects regarding this trait are desirable. Parent UP 2526 was identified as superior general combiner for early head-ing. While cross PBW 621 × UP 2425 has identified as best cross combination for this trait. Potentiality in general combining ability and specific combining abil-ity had been reflected from low to high magnitude for various parents to days to 75% heading. Similar sig-nificant results for GCA and SCA effects have been reported by Hasan et al. (2010) exhibited combining ability in the F1 generations of diallel cross for yield
and yield components in Wheat and Inamullah et al. (2010) also reported combining ability analysis for important traits in bread wheat.
Days to maturity: For days to maturity five parents
namely, WH 542 (-0.725), UP 2526 (-0.540), QLD 40 (-1.021), UP 2672 (-1.021) and UP 2425 (-0.688) showed negative GCA effects while HD 2967 (1.534) and PBW 621 (2.460) showed positive GCA effects. Parent QLD 40 and UP 2672 were found as the best and PBW 621as poorest general combiner for earli-ness. Differential in general combining ability had
929 929 929 929 929
been depicted by different parents for days to maturity. Significant differences due to GCA for days to matur-ity have also been reported by Mavi et al. (2007) for yield and its components in bread wheat (Triticum
aestivum L.) in two nitrogen regimes and Siddique et
al. (2011) noticed combining ability estimates for yield and yield components in spring wheat. Out of twenty
one crosses, thirteen crosses exhibited significant SCA effects for days to maturity. Crosses WH 542 × PBW 621 (-2.509), WH 542 × UP 2425 (-2.176), WH 542 × QLD 40 (-3.694), HD 2967 × PBW 621 (-2.102), UP 2526 × QLD 40 2.213), UP 2526 × UP 2672 (-1.546), QLD 40 × UP2672 (-3.398), QLD 40 × UP2425(-0.731), UP 2672 × UP 2425 (-1.731)
Anil Kumar et al. / J. Appl. & Nat. Sci. 7 (2) : 927 - 934 (2015)
S.
N. Source of
varia-tion
d.f. Mean sum of squares of different characters
Days to 75% heading Days to maturity Plant height Productive tillers/ plant Spike length Number of spikelets/ spike No.of grains/ spike 1. GCA 6 44.469** 53.023** 371.158** 59.784** 3.499** 1.929 16.652 2. SCA 21 14.299** 28.598** 71.030** 33.996** 1.048* 1.783 15.545 3. Error 40 0.675 1.814 6.402 5.285 0.485 1.053 9.589
Table 1. Analysis of variance for general combining ability and specific combining ability for different characters in wheat.
Contd… S. N. Source of variation d.f. Grain weight / spike 1000-grain weight Biological yield/ plant Grain yield/ plant Harvest Index Protein content Sedimenta-tion value 1. GCA 6 0.719** 232.96** 2,781.363** 963.396** 481.707** 0.700* 8.508** 2. SCA 21 0.367** 80.471** 1,451.021** 324.066** 230.693** 0.616** 5.057** 3. Error 40 0.071 6.497 24.489 62.410 32.520 0.232 1.732
*, ** = Significant at 5% and 1% probability level, respectively,; GCA- General combining ability, SCA- Specific combining ability
Table 2. Estimates of general combining ability effects of parents for various characters in wheat.
*, ** = Significant at 5% and 1% probability level, respectively.
S. N. Parents Days to 75% Head-ing Days to maturity Plant height Productiv e tillers/ plant Spike length Number of spikelets/ spike No. of grains/ spike Grain weight / spike 1. WH 542 -1.222** -0.725** -5.664** -1.336* -0.375** 0.080 -0.074 -0.248** 2. HD 2967 2.370** 1.534** -3.079** -0.835 -0.343** -0.149 0.141 -0.170** 3. PBW 621 0.852** 2.460** 0.343 0.294 0.197 -0.310 -1.374* -0.067 4. UP 2526 -1.333** -0.540* 4.958** 0.549 0.334* -0.088 0.089 0.065 5. QLD 40 0.000 -1.021** -0.320 -1.340** -0.286* -0.158 -0.458 0.125* 6. UP 2672 -0.481** -1.021** 4.006** 2.924** 0.532** 0.506** 1.124* 0.118* 7. UP 2425 -0.185 -0.688** -0.245 -0.257 -0.060 0.119 0.552 0.177** SE (gi) 0.146 0.240 0.451 0.410 0.124 0.183 0.552 0.047 SE(gi-gj) 0.224 0.367 0.689 0.626 0.190 0.279 0.843 0.072 S. N. Parents 1000-grain weight Biological yield/ plant Grain yield/ plant
Harvest index Protein
Content Sedimentation value 1. WH 542 -3.935** -6.197** -8.349** -5.092** -0.074 -0.708** 2. HD 2967 -3.964** 1.755 -4.954** -5.387** -0.080 0.155 3. PBW 621 -0.088 -0.30 -0.574 -0.649 0.002 -0.324 4. UP 2526 1.500** 7.368** 2.888 -0.755 0.197* -0.435 5. QLD 40 2.010** -14.701** -1.292* 5.165** -0.186* -0.135 6. UP 2672 0.780 16.836** 10.269** 2.395* 0.244** 0.662* 7. UP 2425 3.697** -4.758** 2.013 4.323** -0.103 0.785** SE (gi) 0.454 0.882 1.408 1.016 0.086 0.234 SE(gi-gj) 0.694 1.347 2.150 1.552 0.131 0.358
*, ** = Significant at 5% and 1% probability level, respectively. Contd….
930 930 930 930
930 Anil Kumar et al. / J. Appl. & Nat. Sci. 7 (2) : 927 - 934 (2015)
T ab le 3 . E st im at es of s pec if ic c om bi ni ng a bil it y ef fe ct s of c ro ss es f or d if fe re nt c ha ra ct er s in w he at. C ro ss es D ay s to 75 % h ea d in g D ay s to m atu ri ty Pla n t h eig h t P ro du ct iv e till er s/ p la n t Sp ik e le n gt h N u mb er o f sp ik el et s/ sp ik e No. of G rai n s/ p ik e G ra in w eig h t / s pi ke W H 5 42 × HD 2 96 7 1. 60 2* * 0. 08 3 0. 22 5 2. 79 0* 0. 36 3 0. 58 4 0. 52 1 0. 03 7 W H 5 42 × P B W 621 0. 45 4 -2 .5 09 ** -0 .9 97 -4 .8 89 ** -0 .2 78 0. 14 5 -0 .4 98 0. 02 0 W H 5 42 × UP 2 52 6 -0 .3 61 -2 .1 76 ** 0. 95 5 -4 .9 94 ** 0. 36 6 0. 52 3 1. 20 6 0. 11 9 W H 5 42 × Q L D 40 0. 30 6 -3 .6 94 ** 1. 93 2 -1 .3 05 ** -0 .3 74 -1 .4 07 * -4 .6 14 ** -0 .1 84 W H 5 42 × UP 2 67 2 -1 .5 46 ** 0. 63 9 -0 .5 27 -1 .8 79 * -0 .4 32 -1 .1 38 * -3 .5 95 * -0 .1 41 W H 5 42 × UP 2 42 5 -1 .5 09 ** 1. 63 9* 4. 05 8* * -0 .4 38 0. 40 6 -0 .8 84 -2 .7 57 0. 06 0 HD 2 96 7 × P B W 6 21 1. 86 1* * -2 .1 02 ** 6. 55 1* * -1 .2 07 -0 .0 47 0. 30 8 1. 75 4 0. 40 9* * HD 2 96 7 × U P 2526 0. 04 6 0. 56 5 -0 .0 97 2. 27 1 -0 .1 83 -0 .1 81 -0 .2 09 0. 40 4* * HD 2 96 7 × Q L D 40 2. 38 0* * 0. 71 3 8. 44 7* * -1 .8 72 0. 42 0 0. 69 0 1. 57 1 -0 .3 56 * HD 2 96 7 × U P 2672 1. 52 8* * 1. 04 6 0. 75 5 1. 06 3 0. 01 5 -0 .7 75 -1 .7 43 0. 14 1 HD 2 96 7 × U P 2425 3. 23 1* * 3. 38 0* ** 0. 97 3 3. 91 1* * 0. 21 1 -1 .0 55 -2 .4 72 -0 .3 59 * P B W 621 × UP 2 52 6 0. 89 8* 1. 30 6 -3 .8 19 ** -3 .3 58 ** -1 .0 74 ** 0. 53 3 2. 10 3 -0 .1 49 P B W 621 × Q L D 40 -1 .4 35 ** 4. 78 7* * 1. 25 8 -0 .2 68 0. 34 0 -0 .4 83 -0 .2 80 0. 17 1 P B W 621 × UP 2 67 2 1. 04 6* 6. 45 4* * 1. 26 6 0. 61 7 -0 .0 72 0. 31 9 1. 33 8 0. 13 5 P B W 621 × UP 2 42 5 -3 .5 83 ** 2. 78 7* * 1. 68 4 5. 36 5* * 0. 33 7 -0 .2 94 -0 .1 57 0. 01 5 UP 2 52 6 × Q L D 40 -0 .5 83 -2 .2 13 ** 5. 17 7* * 3. 94 4* * 0. 71 0 -0 .5 72 -1 .0 77 0. 15 3 UP 2 52 6 × U P 2672 -2 .1 02 ** -1 .5 46 * 1. 95 1 -1 .4 55 -0 .1 75 -0 .8 36 -1 .0 25 -0 .6 70 ** UP 2 52 6 × U P 2425 -0 .7 31 0. 12 0 2. 76 9* -1 .0 83 1. 04 4* * 0. 21 7 1. 51 3 0. 69 0* * Q L D 40 × U P 26 72 -1 .7 69 ** -3 .3 98 ** -2 .2 71 -1 .6 15 -0 .2 58 0. 46 7 1. 79 8 0. 42 3* * Q L D 40 × U P 24 25 -2 .3 98 ** -0 .7 31 4. 48 1* * -3 .8 83 ** -1 .3 96 ** 0. 57 4 0. 86 3 0. 14 7 UP 2 67 2 × U P 2425 1. 41 7* * -1 .7 31 * 2. 95 5* -2 .6 72 * 0. 57 6 -0 .1 10 0. 01 2 0. 43 1* * S E (i j) 0. 42 6 0. 69 8 1. 31 1 1. 19 1 0. 36 1 0. 53 2 1. 60 5 0. 13 8 C ro ss es 1000 -g ra in w eig h t B io lo gi cal y ie ld / pla n t G ra in yi el d/ p la n t Ha rv est I nd ex P ro te in co nt en t S ed im ent at io n va lu e W H 5 42 × HD 2 96 7 1. 57 9 22 .5 87 ** 7. 37 7 -1 .1 13 -0 .2 79 -0 .6 39 W H 5 42 × P B W 621 0. 43 5 -3 0. 69 0* * -1 1. 31 6* * 1. 00 2 -0 .8 51 ** -2 .8 53 ** W H 5 42 × UP 2 52 6 0. 41 4 -3 2. 59 2* * -1 0. 98 8* 2. 52 8 0. 19 7 -0 .5 63 W H 5 42 × Q L D 40 0. 63 8 -6 .4 57 * -5 .8 61 -4 .1 75 -0 .3 33 0. 03 1 W H 54 2 × UP 2 67 2 0. 68 4 -1 0. 36 1* * -7 .6 12 -3 .2 35 0. 41 4 2. 07 7* * W H 54 2 × UP 2 42 5 2. 11 8 -1 0. 96 6* * 0. 44 1 4. 75 7 0. 55 4* 0. 67 4 HD 2 96 7 × P B W 6 21 6. 36 5* * -2 2. 47 6* * 3. 88 2 13 .9 07 ** 0. 33 2 1. 30 1* HD 2 96 7 × U P 2526 7. 52 7* * 3. 72 3 13 .4 50 ** 9. 93 0* * 0. 39 7 0. 99 5 HD 2 96 7 × Q L D 40 -5 .3 32 ** -1 5. 24 2* * -1 1. 20 0* * -5 .8 30 -0 .2 90 1. 09 8 HD 2 96 7 × U P 2672 4. 73 1* * -7 .4 46 ** 4. 43 9 6. 18 3* -0 .2 80 -0 .5 59 HD 2 96 7 × U P 2425 -1 .6 19 20 .2 49 ** 2. 77 5 -5 .8 75 -0 .1 30 0. 84 8 P B W 621 × UP 2 52 6 0. 80 0 -1 .6 22 -1 1. 14 9* -8 .9 48 ** 0. 29 4 1. 93 1* * P B W 621 × Q L D 40 3. 19 1* -6 .8 87 * 1. 66 7 5. 79 2 0. 43 8 0. 17 1 P B W 621 × UP 2 67 2 -1 .6 13 7. 84 3* * 4. 83 9 0. 00 2 0. 55 8* -1 .2 06 P B W 621 × UP 2 42 5 -1 .9 63 31 .8 71 ** 15 .1 25 ** -0 .9 86 -0 .3 22 0. 99 8 UP 2 52 6 × Q L D 40 3. 38 6* 28 .8 45 ** 14 .6 92 ** -0 .2 12 -0 .3 87 -1 .5 89 UP 2 52 6 × U P 2672 -8 .4 34 ** -3 .6 59 -1 7. 16 6* * -1 2. 78 2* * -0 .0 64 -0 .7 62 ** UP 2 52 6 × U P 2425 6. 74 9* * -1 3. 18 1* * 9. 38 4* 14 .4 90 ** 0. 44 6 -0 .3 08 Q L D 40 × U P 26 72 5. 70 7* * -1 7. 65 7* * 3. 46 7 11 .8 38 ** -0 .1 14 -1 .3 55 Q L D 40 × U P 24 25 2. 69 0* -2 2. 36 3* * -9 .7 60 * 4. 38 0 0. 80 0* * 0. 18 2* UP 2 67 2 × U P 2425 6. 12 0* * -2 4. 00 0* * 0. 88 6 11 .2 26 ** -0 .0 80 -0 .2 38 S E (i j) 1. 32 1 2. 56 4 4. 09 4 2. 95 5 0. 24 9 0. 58 0 *, ** = S ig ni fi ca nt a t 5% a nd 1% p rob ab ili ty l ev el , re sp ec ti ve ly . Co nt d…
931 931 931 931 931 showed significant SCA effects in negative direction
while WH 542 × UP 2425 (1.639), HD 2967 × UP 2425 (3.380), PBW 621 × QLD 40 (4.787), PBW 621 × UP 2672 (6.454), PBW 621 × UP 2425 (2.787) ap-peared with significant SCA effects in positive direc-tion. WH 542 × QLD 40 (-3.694) identified as best specific combination for earliness. Earliness in view of maturity is essentially a mandate in breeding pro-gramme of wheat crop. QLD 40 and UP 2672 emerged as good general combiners for earliness with signifi-cant negative GCA effects.
Plant height: Among the parental lines UP 2526
(4.958) and UP 2672 (4.006) showed significant posi-tive GCA effects while HD 2967 (-3.079) and WH 542 (-5.664) showed significant negative GCA effects. WH 542 and UP 2526 were found as best and poor general combiners respectively. Potentiality in general combin-ing ability had been depicted low to high by different parents for plant height.Such type of similar findings of combining ability for grain yield and its components in wheat has been suggested by Rajesh et al. (2002) and Dugustu (2008) also reported combining ability analysis in relation to heterosis for grain yield per spike and agronomic traits in bread wheat (Triticum
aestivum L.). Eight crosses were found with significant
SCA effects, one of them namely, PBW 621 × UP 2526 (-3.819) showed significant negative SCA ef-fects. PBW 621 × UP 2526 was found as best specific cross combination. Differential in specific combining ability had been exhibited by different parents for plant height. Results were also close confirmation with the findings of Shoran et al. (2003) for winter and spring wheat noticed combining ability. Tall plants are pre-ferred for straw purpose, whereas, dwarfs are more lodging resistant thus depending upon the objective, preference should be given. HD 2967 showed highest significant negative effects and thus can be considered as good general combiner for dwarfness while UP 2526 emerged as good general combiner for tallness with significant positive GCA effects. HD 2967 × QLD 40 (8.447) was identified as the best cross for plant height on the basis of highest significant SCA in positive direction while PBW 621 × UP 2526 (-3.819) was the best cross combination for reduced plant height with highest SCA value in negative direction.
Productive tillers per plant: Among the parental
lines WH 542 (-1.336)) and QLD 40 (-1.340) showed negative significant GCA effects while UP 2672 (2.924) showed positive significant GCA effects. UP 2672 and QLD 40 (-1.340) were found as best and poor general combiners, respectively. Potentiality in general combining ability had been shown to different level of magnitude by different parents for productive tillers per plant. Results were close confined with the earlier findings of Siddique et al. (2004) who reported combining ability for harvest index and its components in bread wheat. Inamullah et al. (2010) also depicted combining ability analysis for important traits in bread
wheat for GCA, however, eleven crosses were found significant for productive tillers per plant. With respect to SCA, four crosses i.e. WH 542 × HD 2967 (2.790), HD 2967 × UP 2425 (3.911), PBW 621× UP 2425 (5.365) and UP 2526 × QLD 40 (3.944) showed posi-tive significant SCA effects while seven crosses WH 542 × PBW 621(-4.889), WH 542 × UP 2526 (-4.994), WH 542 ×QLD 40 1.305), WH 542 × UP 2672 (-1.879), PBW 621× UP 2526 (-3.358), and UP 2672 × UP 2425 (-2.672) showed negative significant SCA effects. PBW 621 × UP 2425 (5.365) was found to be the best specific combiner for productive tillers per plant. Difference in specific combining ability had been found for different parents with respect to pro-ductive tillers per plant. Similar significant results for SCA have been reported by Asif et al. (2001) for com-bining ability analysis in intraspecific crosses of spring wheat and Hasan et al. (2012) also found the close findings for combining ability in bread wheat
(Triticum aestivum L.) under salinity and normal
con-ditions. UP 2672 showed highest significant positive GCA effects and thus can be considered as good gen-eral combiner for increasing number of productive tillers per plant. PBW 621 × UP 2425 was identified as the best specific cross combination with highest posi-tive SCA value.
Spike length: For spike length, WH 542 (-0.375), HD
2967 (-0.343) and QLD 40 (-0.286) showed negatively significant GCA effects while UP 2526 (0.334) and UP 2672 (0.532) showed positively significant GCA ef-fects. UP 2672 and WH 542 were found to be the best and poor general combiners, respectively. Two crosses PBW 621× UP 2526 (-1.074) and QLD 40 × UP 2425 (-1.396) showed negative and significant SCA effects. UP 2526 × UP 2425 (1.044) was found to be the best specific cross for spike length. Potentiality in general combining ability and specific combining ability had been reflected from low to high magnitude for various parents to spike length. Observations were confined with the results of the same character for GCA and SCA have also been reported by Dugustu (2008) also reported combining ability analysis in relation to het-erosis for grain yield per spike and other agronomic traits in bread wheat (Triticum aestivum L.)
Number of spikelets per spike: With regard to
num-ber of spikelets per spike only one parent UP 2672 (0.506) was found with positive and rest of the parents showed negative GCA effects. UP 2672 and PBW 621 found to be the best and poor general combiners, re-spectively. However, two crosses WH 542 × QLD 40 (-1.407) and WH 542 ×UP 2672 (-1.138) exhibited negative significant SCA values and rest crosses were found to be non- significant. Difference in general combining ability and specific combining ability had been reflected from low to high magnitude for various parents tonumber of spikelets per spike. Significantly negative and positive results for number of spikelets per spike for GCA and SCA were also reported by
932 932 932 932 932
Rajesh et al. (2012) exhibited combining ability for grain yield and its components in wheat. Spikelets per spike are a yield contributing trait. Selection for good general combiners for spikelets per spike will include parents with high positive GCA effects. Thus no parent was identified as good general combiners for the trait. And no cross appeared as the best specific cross for spikelets/spike on the basis of SCA effects.
Number of grains per spike: Among the parental
lines UP 2672 (1.124) showed positively significant GCA effects while parent WH 542 (-1.374) showed highest negatively significant GCA effects. Out of 21, two crosses namely WH 542 × QLD 40 (-4.614) and WH 542 × UP 2672 (-3.595) were found to have sig-nificant negative SCA effects. No cross was having significant positive SCA effects for this trait. Positive SCA effects are desirable for the above trait. No paren-tal line was identified as good general combiners for increasing number of grains per spike. Variation in general combining ability and specific combining abil-ity had been shown from low to high magnitude for various parents to number of number of grains per spike. Such type of significant results for SCA and GCA has been also reported by Rajesh et al. (2008) for combining ability and gene action in inter varietal crosses in bread wheat.
Grain weight per spike: For grain weight per spike,
two parents WH 542 (-0.248) and HD 2967 (-0.170) showed negatively significant GCA effects while QLD 40 (0.125), UP 2672 (0.118) and UP 2425 (0.177) showed positively significant GCA effects. UP 2425 and WH 542 were found to be the best and poor gen-eral combiners respectively. Among 21, five crosses namely HD 2967 × PBW 621 (0.409), HD 2967 × UP 2526 (0.404), UP 2526× UP 2425 (0.690), QLD 40 × UP 2672 (0.423) and UP 2672 × UP 2425 (0.431) were having positively significant SCA effects while three crosses HD 2967 × QLD 40 (-0.356), HD 2967 × UP 2425 (-0.359) and UP 2526× UP 2672 (-0.670) showed negatively significant SCA effects. UP 2526 × UP 2425 (0.690) cross was found to be the best specific cross for this trait. Differential in general combining ability and specific combining ability had been shown from low to high magnitude for various parents to number of grain weight per spike. Similar significant results for GCA and SCA have also been depicted by Tahmasebi et al. (2011) by estimating of genetic pa-rameters for grain yield and related traits in wheat us-ing diallel analysis under optimum and moisture stress conditions
1000-grain weight: Among the parents WH 542
(-3.935) and HD 2967 (-3.964) showed negatively sig-nificant GCA effects while UP 2526 (1.500), QLD 40 (2.010) and UP 2425 (3.697) showed positively sig-nificant GCA effects for 1000-grain weight. Parents UP 2425 (3.697) and HD 2967 (-3.964) were identified as best and poor general combiners, respectively. Po-tentiality in general combining ability had been shown
to different level of magnitude by different parents for1000-grain weight. Rajesh et al. (2012) depicted combining ability for grain yield and its components in wheat and Inamullah et al. (2010) also reported com-bining ability analysis for important traits in bread wheat for GCA in this character. Eleven crosses showed significant SCA effects out of which HD 2967 × QLD 40 (-5.332) and UP 2526 × UP 2672 (-8.434) exhibited negatively significant SCA effects while nine crosses exhibited positively significant SCA effects. HD 2967 × UP 2526 (7.527) was found to be the best specific cross for this trait. Difference in specific com-bining ability had been found for different parents with respect to productive tillers per plant. Similar signifi-cant results for SCA have been reported by Hasan et al. (2007) noticed combining ability for spike charac-teristics in wheat (Triticum aestivum L.)and Shoran et al. (2003) also exhibited in winter and spring wheat for combining ability.
Biological yield per plant: Result revealed that
par-ents UP 2526 (7.368) and UP 2672 (16.836) exhibited significant positively GCA effects while WH 542 (-6.197), UP 2425 (-4.758) and QLD 40 (-14.701) showed negatively significant GCA effects. UP 2672 and QLD 40 were found to be the best and worst gen-eral combiner respectively. Out of 21 crosses 18 were found to have significant SCA effect. Five crosses namely, WH 542 × HD 2967 (22.587), HD 2967 × UP 2425 (20.249), PBW 621× UP 2672 (7.843), PBW 621 × UP 2425 (31.87) and UP 2526 × QLD 40 (28.845) showed positively significant SCA effects while fifteen crosses showed significant negative SCA effects. PBW 621 × UP 2425 was found to be the best specific cross. Variation in specific combining ability had been found for different parents with respect to biological yield per plant. Similar significant results for SCA have been reported by Shoran et al. (2003) exhibited in winter and spring wheat for combining ability. Positive SCA effects are desirable for biological yield, UP 2672 and UP 2526 emerged as good general combiners in the present investigationwhile, PBW 621× UP 2425 acted as super cross combination for this trait.
Grain yield per plant: Data explained for grain yield
per plant, WH 542 (-8.349), HD 2967 (-4.954), and QLD 40 (- 1.292) exhibited negatively significant GCA effects while UP 2672 (10.269) showed posi-tively significant GCA effects. Out of 21 crosses 10 were found to have significant SCA effects. Six crosses showed positively significant SCA effects while HD 2967 × UP 2526 (13.450), PBW 621 × UP 2425 (15.125), UP 2526 × QLD 40 (14.692) and UP 2526 × UP 2425 (9.384) showed positively significant SCA effect. PBW 621 × UP 2425 (15.125) was found to be the best specific cross combination. Differential in general combining ability and specific combining ability had been shown from low to high magnitude for various parents to number of grain yield per plant. Similar results for GCA and SCA have been reported
933 933 933 933 933
Anil Kumar et al. / J. Appl. & Nat. Sci. 7 (2) : 927 - 934 (2015)
by Kumar et al.(2015b) and Kamaluddin et al. (2009) depicted combining ability analysis for grain filling duration and yield traits in spring wheat (Triticum
aes-tivum L. em.Thell.) and Hasan et al. (2010) also
re-ported combining ability in the F1 generations of
dial-lel cross for yield and yield components in Wheat. The yield is a complex and highly variable trait and is a result of cumulative effect of its component characters and therefore, direct selection of yield per se may not be effective (Kumar et al.,2015c)
Harvest index: Out of seven parents, the GCA effects
for harvest index was found significantly negative for WH542 (-5.092) and HD 2967 (-5.387) and QLD 40 (5.165), UP 2672 (2.395) and UP 2425 (4.323) re-flected positive. QLD 40 was found to be the best combiner for this trait. However, out of 21 crosses, PBW 621 × UP 2526 (-8.948) and UP 2526 × UP 2672 (- 12.782) were found negatively significant SCA ef-fects while HD 2967 × PBW 621 (13.907), HD 2967 × UP 2526 (9.930), HD 2967 × UP 2672 (6.138), UP 2526 × UP 2425 (14.490), QLD 40 × UP 2672 (11.838) and UP 2672 × UP 2425 (11.221) showed positively significant SCA effects. UP 2526 × UP 2425 was found to be the best specific cross. Variation in specific combining ability had been found for different parents with respect to harvest index. The work has also been justified by the similar result of Rajesh et al. (2012) exhibited combining ability for grain yield and its components in wheat.
Protein content: With regard to quality parameter as a
protein content in common wheat variety QLD 40 had significantly negative (-0.186) GCA effects while, UP 2672 (0.244) exhibited statistically positive and act as a best combiner. Difference in general combining abil-ity had been reflected from low to high magnitude for various parents toprotein content. Similar results have been reported by Ghimiray et al. (2000) noticed com-bining ability of wheat ( Triticum aestivum L.) geno-types for quality parameters in tarai soil, Esmail (2007) detected genetic components through triple test cross and line x tester analysis in bread wheat and Esra and Kokasal (2010) reported combining ability in the F1 generations of diallel cross for yield and yield compo-nents in Wheat. However, for SCA out of 21 crosses WH 542 × PBW 621 (-0.851) was found negatively significant SCA effects while WH 542 × UP 2425 (0.554), PBW 621× UP 2672 (0.558), QLD 40 × UP 2425 (0.800) reflected positively significant SCA ef-fects. QLD 40 × UP 2425 was found to be the best specific cross. Variation in specific combining ability had been reflected from low to high magnitude for various parents tonumber of spikelets per spike palve
et al. (1987) noticed similar results for combining
abi-lity in wheat from line x tester analysis and Rajesh et al. (2008) exhibited combining ability and gene action in inter varietal crosses in bread wheat reported the similar findings for this trait. Protein content is an im-portant selection criterion for yield. Significant
positi-ve value of GCA for UP 2672 exposed its good general combining ability for the trait. QLD 40 × UP 2425 was identified as the most superior combination on the ba-sis of high SCA values.
Sedimentation value: Another important quality
pa-rameter of wheat grain i.e. sedimentation value WH 542 showed negatively significant GCA(-0.708) and UP 2425 had greatest value(0.785) for GCA and was found to be the best combiner for this trait followed by UP 2672 (0.244).However, out of 21 crosses, WH 542 × PBW 621(-2.853) and UP 2526 × UP 2672 (- 0.762) were found to be negatively significant SCA while, WH 542 × UP 2672 (2.077), HD 2967 × PBW 621 (1.301), PBW 621 × UP 2526 (1.931) and QLD 40 × UP 2425 (0.182) had positively significant SCA ef-fects. Due to performed greater SCA, QLD 40 × UP 2425 was identified as the most superior combination for this trait. Difference in general combining ability and specific combining ability had been reflected from low to high magnitude for various parents to sedimen-tation value. Esra and Kokasal (2010)alsoreported the positive and negative GCA and SCA values for the different quality traits in wheat for combining ability in F1 generations of diallel cross for yield and yield components in wheat.
Conclusion
Present findings concluded that Parent UP 2526 was a good general combiner followed by UP2425 and UP2672 for most of the characters studied. However, the performance of crosses PBW 621 × UP 2425, UP 2526 × UP 2425 and QLD 40 × UP 2425 were found to be the best specific combiner for the characters number of productive tillers plant-1, grain yield plant-1,
spike length, grain weight spike-1, harvest index, days
to 75 % heading and protein content.
REFERENCES
Anonymous (2013). Annual report (Directorate of Wheat Research) 2012-13.
Asif, A., Muhammad, F. and Anwar, M. (2001). Combining ability analysis in intraspecific crosses of spring wheat. Sarhad J. Agri., 21(1):112-120.
Dugustu, N. (2008). Combining ability analysis in relation to heterosis for grain yield per spike and agronomic traits in bread wheat (Triticum aestivum L.). Turkish J. Field Crops,13(2): 49-61.
Esmail, R.M. (2007). Detection of genetic components through triple test cross and line x tester analysis in bread wheat. World Journal of Agricultural Sciences, 3 (2):184-190.
Esra, F.S. and Kokasal, L.S. (2010). Combining ability in the F1 generations of diallel cross for yield and yield com-ponents in Wheat. Sarhad J. Agric. 23(4): 937-942. Ghimiray, T.S. and Sarkar, K.K. (2000).Combining ability of
wheat ( Triticum aestivum L.) genotypes for quality
parameters in terai soil. Journal of Interacademicia, 4
(3): 366-369.
Griffing, B. (1956).Concept of general and specific combin-ing ability in relation to diallel crosscombin-ing system. Aust, J.
934 934 934 934 934 Biol., 51: 551-554.
Hasan, G., Jain, S.K. and Sastry, E.V.D. (2007). Analysis of combining ability for spike characteristics in wheat
(Triticum aestivum L.). International J. Agril. Biol., 8
(5): 684-687.
Hasan, G., Swati, M.S., Khan, M.A. and Hassan, G. (2012). Combining ability in bread wheat (Triticum aestivum
L.) under salinity and normal conditions. Indian J.
Genet., 63(1): 69-70.
Hassan, G., Mohammad, F., Afridi, S.S. and Khalil, I. (2010). Combining ability in the f1 generations of dial-lel cross for yield and yield components in Wheat. Sarhad J. Agric., 23(4): 937-942.
Inamullah., Mohammad, F., Siraj-Ud-Din., Hussain, G. and Ali, S. (2010). Combining ability analysis for important traits in bread wheat. Sarhad J. Agril., 22(1): 45-50. Kamaluddin., Singh, R.M., Prasad, L.C., Abdin, M.Z. and
Joshi A.K. (2009).Combining ability analysis for grain filling duration and yield traits in spring wheat (Triticum aestivum L. em.Thell.).Genetics and Molecu-lar Biology, 30(2):411-416.
Kumar ,A., Harshwardhan, Kumar, A. and Prasad, B.
(2015a). Heterotic performance of diallel F1 crosses
over parents for yield and its contributing traits in bread
wheat (Triticum aestivum L.). Journal of Hill
Agricul-ture, 6(1):58-61.
Kumar ,A., Prasad, B. and Kumar,A. (2015b). Study of vari-ance components of combining ability for yield, its
attributing traits in common bread wheat. Elixir
Agri-culture; 81: 31425-31426.
Kumar ,A., Harshwardhan, Kumar,A. and Prasad, B..
(2015c). Estimation of correlation coefficient for yield and quality parameters of bread wheat under tarai
re-gion of pantnagar. Annals of Plant and Soil Research,
17(special issue): 224-228.
Mavi, G.S., Nanda, G.S., Sohu, V.S., Sharma, S. and Kaur, S. (2007). Combining ability analysis for yield and its
components in bread wheat (Triticum aestivum L.) in
two nitrogen regimes. Kaur Crop Improve., 30 (1) :
50-57.
Palve, S.M., Thete, R.Y. and Dumbre, A.D. (1987). Combin-ing ability in wheat from line x tester analysis. Journal of Maharashtra Agricultural Universities, 12(2): 244-245. Prasad, B. (2014). Heterotic vigour studies in forage
sor-ghum hybrid by multiple criteria Journal of Hill
Agri-culture, 5 (2): 182-185.
Prasad, B., Bahuguna, A. and Shukla, D.K. (2012). Geno-typic variation studies of Perilla (Perilla frutescens L.) germplasm under North-West Himalayan agri-silvi system. Environment and Ecology, 30 (4): 1235-1237. Prasad, B., Shukla, P.S. and Singh, R. (2005). Effect of
staggered planting of male parent on seed yield and quality of forage sorghum hybrid, PCH-106 .Seed Res., 33 (2): 213-214.
Rajesh, S., Bhawsar, R.C., Holkar, A.S. and Prasad, S.V.S. (2012).Combining ability for grain yield and its compo-nents in wheat. Agric. Sci. Dig., 28(4): 173-180. Rajesh, S., Bhawsar, R.C., Holkar, A.S., Verma, G.P.,
Pati-dar, G.L. and Prasad, S.V.S. (2002).Combining ability for grain yield and its components in wheat. Agric. Sci. Dig., 22(4): 273-275.
Rajesh, S., Dobariya, K.L. and Jivani, L.L. (2008). Combin-ing ability and gene action in intervarietal crosses in bread wheat.Crop Res., 18 (2): 126-135.
Shoran, J., Lakshmi Kant and Singh, R.P. (2003).Winter and
spring wheat: an analysis of combining ability. Cereal
Research Communications, 31 (3/4): 347-354.
Siddique, M., Ali, S., Malik, M.F.A. and Awan, S.I. (2011). Combining ability estimates for yield and yield compo-nents in spring wheat. Sarhad J. Agri., 20 (4): 485-487. Siddique, M., Shafiq., Wani, A. and Zargar, G.H. (2004).
Combining ability for harvest index and its components in bread wheat . Crop Research.,4 (2): 268 –271. Skovmand, B. and Reynolds, M.P. (2000). Increasing yield
potential for marginal areas by exploring genetic re-sources collections. The Eleventh Regional Wheat Workshop for Eastern, Central and Southern Africa, Addis Ababa, Ethiopia, 18-22 September: 67-77. Sprague, G.F. and Tatum, L.A. (1942).General vs. specific
combining ability in single crosses of corn. J. Amer.
Soc. Agron., 34: 923-932.
Thakre, J.M., Vitkare, D.G., Godbole, A.K., Atale, S.B. (1996). Line × tester analysis in wheat for yield and its traits. Annals of Plant Physiology, 10(1): 99-102. Tahmasebi, S., Khodambashi, M. and Rezai, A. (2011.)
Esti-mation of genetic parameters for grain yield and related traits in wheat using diallel analysis under optimum and
moisture stress conditions. J. Sci. Tech. Agril. Nat.
Reso., 11 (1):229-241.