Process Operator Skill Exploration
by a Data Analysis Software
⋆
Janne Pietilä∗ Antti Remes∗∗ Olli Haavisto∗∗∗
∗Aalto University School of Electrical Engineering, Department of
Automation and Systems Technology, Espoo, Finland (Tel: +358 9 4702 5221; e-mail: [email protected]).
∗∗e-mail: [email protected]
∗∗∗e-mail: [email protected]
Abstract:Experienced process operators have a key role in ensuring a smooth and high quality operation of process plants in many fields of industry. Consequently, there is a need to identify the skills and knowhow of the operators which leads to high performance, and educate new operators of this knowledge. To this end, an analysis software for comparing the performance of operators in a mineral processing plant has been developed for the plant management. The software implements methods that have been developed earlier for data-based analysis of the performance, and automatizes and streamlines the analysis procedure. The software, which is installed at the process plant for generating the analyses, enables the plant management to monitor the performance of the operator groups at the plant. The analysis results can serve as a starting point for identifying the most efficient operating principles. In addition, an efficient manner for sharing the operating knowhow between the operators is provided. An example case study of using the software is also given.
Keywords: Human supervisory control; performance analysis; software tools; training; human factors.
1. INTRODUCTION
In process industry the human operator often has a key role in ensuring good overall performance of the plant, de-spite the increased level of automation and advanced con-trol systems. Especially the more complex process plants require an experienced operator to run the plant optimally. To improve the overall performance of the process plant and to educate new process operators, the knowledge of the experienced operators should be extracted and docu-mented. However, transferring the knowledge that experi-enced operators have is difficult due to its tacit nature. The modeling and evaluation of human operators has been actively studied (Sheridan [2002]). However, the research has mainly concentrated on the control tasks of machines and mechanical systems instead of industrial processes. For example, in human adaptive mechatronics (HAM, Suzuki et al. [2005], Harashima and Suzuki [2006]) the human-machine interaction is analyzed in order to create mechanical systems that adapt to the operator’s skill level and eventually improve the operator’s capability to perform the desired task. Also the evaluation of forest machine and harbor crane operators’ skills has recently been investigated to improve the productivity of these human-machine systems (Tervo et al. [2010], Aulanko and Tervo [2009]). In process control the operator evaluation has been performed for example for improving operator ⋆ This research has been supported by the Finnish Funding Agency
for Technology and Innovation (Tekes). The project participants are Inmet Mining Co. and Outotec Oyj.
allocation (Şen and Çinar [2010]) or operational safety (Sebzali and Wang [2002]).
A data-based method for evaluating the performance of operators in a mineral processing plant has been recently developed (Pietilä and Haavisto [2010]) and generalized (Haavisto and Remes [2010]) by the authors. This paper details the development of a software tool which brings the developed analysis and evaluation methods available to the plant management. The software allows streamlining the relatively complex analysis process and automatizes many phases of the analysis. The objective is to enable the plant management personnel to easily apply the developed analysis methods to online data gathered from the pro-cess automation system. Thus the management have new opportunities to investigate the optimal ways to operate the process and can, together with the process operators, develop the operating strategies further.
The example process plant is the concentrator process of the Inmet Mining Co. Pyhäsalmi mine in central Finland. The plant is observed during normal operation, and the data for the analysis software are gathered from the pro-cess automation system. The following section describes the process and the role of the operator. The structure and the functionality of the analysis software are then explained and an example case study of using the software is given. Remarks of the implications of this work are presented in conclusion.
2. PROCESS DESCRIPTION
2.1 Copper and zinc concentration processes
Flotation is considered the most important mineral con-centration method due to its widespread use and ver-satility (Wills [2006]). The Pyhäsalmi concentrator uses flotation processes to separate the valuable minerals from the ore feed. The process plant operates continuously in three shifts. The 8 hour shifts are manned by 5 work groups, each consisting of a process operator (monitoring and controlling the concentrator in the control room) and maintenance personnel operating at the plant floor. The flotation process is continuous and consists of separate copper and zinc flotation circuits, each made up of several flotation stages as presented in Fig. 1. The feed is a slurry of comminuted ore mixed with water. The copper minerals are first extracted to the copper concentrate. Then, the tailings from the copper circuit are fed to the zinc circuit, where the zinc minerals are separated to the zinc concentrate. Cleaning Middlings flotation Roughing Scavenging Zn concentrate Cu concentrate Cleaning Middlings flotation Roughing Scavenging Feed Cu tailing Zn tailing Regrinding
Copper Circuit Zinc Circuit
Fig. 1. A schematic view of the copper and zinc circuits at the Pyhäsalmi mine.
The flotation stages are made up of flotation cells. A flotation cell is a tank equipped with a flotation mechanism that mixes the slurry to keep it in suspension and disperses small air bubbles to the slurry. When mineral particles get into contact with the air bubbles, those that are hydrophobic will attach to the bubbles. By introducing suitable reagents and controlling the chemical conditions of the slurry, valuable minerals can be made hydrophobic, while rest of the minerals in the slurry remain hydrophilic. The result is that the valuable minerals are lifted by the air bubbles to the top of the tank. On the slurry surface, loaded bubbles coalesce and form a froth that flows over the edge of the tank to a launder where it is collected as concentrate. The remaining slurry exits from the bottom of the flotation cell as tailings.
The metallurgical properties of the slurry and the condi-tions in the flotation cell are not easily measured directly. As a result, the state of the process can practically never be automatically determined and controlled in the long term. The expertise of the operator is needed to assess the current state of the process as well as the direction the process state is taking, and to determine the appropriate control actions. This expertise is accumulated over years as the operator gains experience in controlling the process, and is not easily transferrable due to its nature as tacit knowledge.
2.2 Control objectives and operator actions
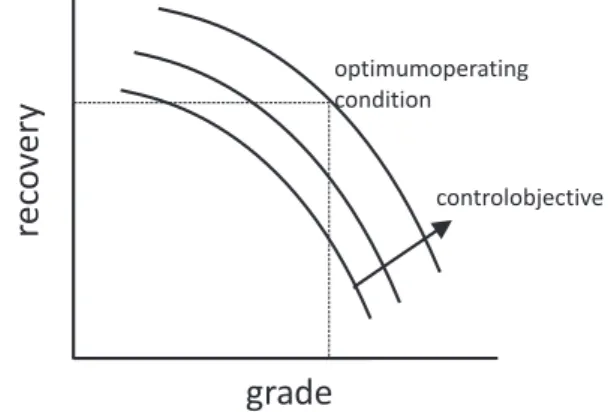
The overall control objectives of the flotation process are to maximize the recovery of valuable minerals and to maintain an acceptable quality of the concentrate. There is a tradeoff involved: high quality can only be obtained at the expense of recovery. A typical form of the relationship between concentrate grade and recovery is presented in Fig. 2.
grade
rec
o
v
er
y
optimum operating condition control objectiveFig. 2. A typical relationship between concentrate grade and recovery (Wills [2006]).
The controlled variables in each flotation cell are the froth thickness via the pulp level, the air feed and the chemical reagent addition. The setpoints for the lower level regu-lating controls are set by the operator or by higher level optimizing controls. The optimal values for the setpoints depend on, among other things, the feed ore grades and the particle size distribution of the ground ore slurry. Typically though, each operator has different preferences for controlling the process, and as a result can decide on different courses of action in similar situations. For example, one operator might prefer to keep the recovery as high as possible, while another might focus more on the concentrate quality.
The process automation system saves data of process vari-ables to its database. Consequently, data-based analysis and modeling of the operators’ actions and performance is an attractive approach, as it can be done during normal operation of the process plant and no additional arrange-ments are necessary.
3. SOFTWARE
3.1 Database
The data source is the SQL database of the Proscon automation system. The analysis software reads frequently sampled data of specified process variables, and saves hourly averages of the data to the software’s own database. The advantage of managing a separate database is that the database structure can be customized to fit the specific needs of the software. The comparison tool typically re-quires long stretches of data from relatively few variables, but due to the preprocessing and data validity testing the original data needs to have a high sampling rate. Saving the original data would, however, have high storage costs, not to mention the computation cost when performing the same preprocessing steps on the same data over and over
again. Therefore, it makes sense to save the preprocessed data using a longer sampling time (here 1 hour), which also enables saving longer stretches of data to a single database file.
When the process data is written to the software’s database, certain key variables are automatically analyzed for quality. Erroneous data points are detected based on hard upper and lower limits set on the variables. Mal-functions of analysis devices are indicated by less frequent updates in the corresponding variable values. The variables that are inspected are mostly related to measurements of the process feed. Data ranges of suspect or incorrect values are marked in the database.
3.2 Performance evaluation methods
The performance evaluation of the operator groups is based on a few high-level index variables, which describe different aspects of the plant operation. These variables are also used by the plant management to evaluate the performance of the concentration process. The index vari-ables used for evaluating the operators’ performance were the overall economic efficiency index, the quality of the concentrate and the portion of valuable mineral that was recovered from the feed. The concentrate quality is deter-mined by comparing the current value (grade of the valu-able mineral) of the concentrate tonne to a nominal-grade concentrate, assuming target recovery is reached. The eco-nomic efficiency index describes the difference between the current and target values of a produced concentrate tonne. The portion of the valuable mineral that is collected in the concentrate is called recovery, and is expressed as a percentage.
The index variables, however, are sensitive not only to operator actions, but also other effects. The feed prop-erties and rate both affect the plant performance and are typically outside the operators’ influence. To ensure fair comparison between the operator groups, the influences outside the scope of the operator performance evaluation are compensated for in the index data by a multivariate linear regression model. The residuals of the regression are then used in the operator performance comparison. The model is required to represent the dependence between the feed quality and the index variables to a reasonable degree of fidelity. A linear model estimated from a data set covering a few weeks of operation has been detected to suffice, though the residuals of a high fidelity process model could be expected to provide even better data for analysis.
Unfortunately, some measurements used in the data com-pensation are not always online or suffer from measure-ment errors. The erroneous data points that are de-tected during the conversion from the process automation database to the software’s own database are excluded from the model estimation, compensation and operator com-parison. The regression coefficients of the compensation model are available for the software user for inspection of the model validity.
A typical workflow for analyzing the operators’ perfor-mance is shown in Fig. 3. After the user has chosen the timespan and the operators to be compared, he (visually)
inspects the performance index time series and the com-pensation model input time series. If the quality of these measurements is not satisfactory, the analysis timespan should be modified accordingly. If the data are good, the compensation model can be estimated and the model parameters inspected. Typically the compensation model is estimated from the same data set as what is used for analysis, but if this is not practical, the model can also be estimated using data from another timespan by applying a precomputed model.
Fig. 3. User actions workflow
The compensation model predicts the values of the perfor-mance indices based on the feed properties. The residuals of the model are therefore uncorrelated with the feed properties and can be used for comparing the operator groups. The comparison of the operators’ performance in the control and supervision task is carried out using a rank-based statistical test called the Kruskal-Wallis test (see e.g. Gibbons [1985]), and pairwise comparisons of index variable values between two operators. For a detailed explanation of the comparison procedure, see Pietilä and Haavisto [2010].
The results of the pairwise comparisons are not easily presented, since the number of combinations easily grows rather large. (With 5 operators, we have 10 different pairings – for each performance index variable.) Second, the rank-based statistics can be challenging to relate to engineering units. The comparison results are therefore not presented as is. Rather, they are used in conjunction with the median, 25 % and 75 % quartiles of the performance index variables for each operator in the chosen analysis period. The median and the quartiles are compatible with the rank statistics, but reflect the reality better since they are expressed in engineering units. The results of the rank comparison are used to highlight the significant differences.
If the data of a single operator group significantly differ from at least two other groups, the corresponding median marker is highlighted. This enables the user to detect the significant differences between the operators, which could otherwise remain hidden. For a general discussion of the applied analysis method and of more advanced visualization methods, see Haavisto and Remes [2010]. Once the statistical significances of the differences be-tween operator groups have been determined, the user has the opportunity to examine the estimated probability density distributions of index variables. Together with the statistical differences, these estimated distributions can point out different operating preferences and control strategies among the operator groups. These distributions are estimated separately for each operator group using uncompensated data and a smoothing technique based on a normal kernel probability distribution function (Bowman and Azzalini [1997]). The data used in the estimation have been cleaned of obvious outliers that fall outside the usual range of variation. The average index variable values for each operator group can also be compared against long-term statistics. For this, the long-long-term distribution of each index variable has been estimated, using a normal distri-bution and a data set covering approximately one year of continuous operation. The observed averages of each operator group are placed on the estimated distribution. Finally, after the differences between the operator groups have been determined and established, the user can de-termine the control actions that the operators have under-taken in the analysis timespan. The model residuals can be examined to determine at which points during the shifts the operators are above or below the mean values of the index variables, and e.g. corresponding chemical dosages can be examined. The mean values of all the variables are also available in tabular format at this stage.
After the analysis has been carried out, a PDF document summarizing the results can be created. The summary contains the main results of the analysis, including the statistically significant differences between the operator groups and the index variable distributions. The analysis summary can then be used as a new starting point when the process development and the operating strategies are discussed among the operating and management personnel of the mineral processing plant.
3.3 Architecture and implementation
The software implementation follows a classic client–server design paradigm. The server is responsible for collecting and preprocessing the data, performing the statistical calculations for comparing the operators’ performance as well as compensating the performance index variables based on feed properties, and responding to requests from the client. The client functions as a user interface, collecting user input such as the analysis time interval and the variables used in the analysis, and presents the analysis results in a clear and concise graphical format. Multiple simultaneous client connections to the server are possible.
The hardware requirements lie mostly in the server part, which needs both processing power and working memory.
The client is light in comparison, as it only needs to present the given data in a user-friendly manner and communicate the user’s requests to the server. This allows installing the client to a large variety of personal computers, including those with lower computation and memory resources. On the other hand, the server can be installed in any computer with the necessary hardware and network capabilities. The communication between the server and client is im-plemented using the TCP/IP network protocol stack and the functions provided by the Java programming language. The network connectivity allows not only multiple client connections but also installing the server and client on different physical machines. Clear separation between the functions of the client and the server is also encouraged, as the communication bandwith between the two should preferably be kept low.
The client is a standalone Windows program. The server resides in a dedicated virtual machine running the Win-dows XP operating system. This allows a flexible basis for installing the system in the process environment, as the virtual machine’s operating system can be freely config-ured to suit the server’s needs, and no separate physical machine is needed. The server virtual machine requires a static IP address and an open port for the network communication with the client.
Currently the server virtual machine resides in the Py-häsalmi Mine’s server machine, where it has online access to the process automation system’s database. The client application has been installed on one personal computer belonging to a member of the plant management.
4. CASE STUDY
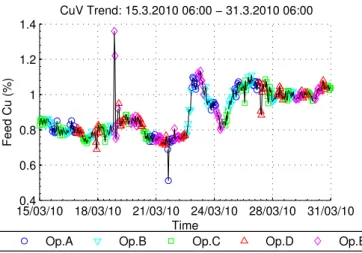
This case study covers a period of two weeks, from the 15th to the 31st of March 2010, consisting of normal process operation data. The data set was grouped into several eight hour shifts operated by the five operator groups, labeled A to E. Figure 4 shows the grouped time trend of the feed ore copper grade (%); a sudden change in the ore type can be noted around the 23th of March 2010. Therefore, even though the time period is relatively short, it still contains sufficient variation in the data in order to reliably estimate the parameters of the compensation model. The peak seen around March 19th corresponds to a feed disturbance in the copper concentration circuit. This peak was not included in the data which was used to estimate the compensation model.
In addition, the estimated model was verified by inspecting the multilinear regression (MLR) parameters, shown in Fig. 5. In this data set the most significant model param-eters were the feed particle size and the copper grade of the ore. The concentrate grade was mostly impacted by the feed particle size distribution, and the recovery was affected by the feed copper grade.
Subsequently, the compensation model was applied to the original data, in order to distinguish the effects of the feed ore variation and the impacts of the process operation. Statistical tests, discovering the differences between the groups of the operators, were then performed for the model compensated data. The results are shown in Fig. 6 (a), (b) and (c), presenting the medians and the 25 % and
15/03/10 18/03/10 21/03/10 24/03/10 28/03/10 31/03/100.4 0.6 0.8 1 1.2 1.4 Time Feed Cu (%) CuV Trend: 15.3.2010 06:00 − 31.3.2010 06:00
Op.A Op.B Op.C Op.D Op.E
Fig. 4. Copper concentration of the feed ore (%) grouped according to the operator shifts.
75 % quartiles for the grade, recovery and economic index, respectively, of each operator group. A 90 % confidence level for the statistical pairwise comparison of the operator groups was chosen. An operator group differing signifi-cantly from at least two other operator groups is indicated by a green median point in the graphs (see Fig. 6). It can be quickly noted from the graphs, that operator A tends to produce lower grade concentrate, while operator C has the highest grade in terms of statistical significance (Fig. 6(a)). Similarly, operator E has the lowest recovery (Fig. 6(b)) and the value of the economic index (Fig. 6(c)), while operator B performs best when measured by the economic index.
In addition, the operator shift analysis tool enables rank-ing of the results based on a long term data, and detailed assessment of mean differences in the key operating vari-ables of the flotation circuit. Finally, all the results can be saved as a report sheet.
5. CONCLUSIONS
An analysis software which implements a data-based method for comparing the performance of process plant
Econ. ind. Cu conc. quality Cu recovery
Feed rate Ore Cu grade Ore Zn grade Ore S grade Feed part. size −20um Feed part. size −74um Feed part. size +149um
Compensated Variables
Input Variables
CuV MLR Model Parameters: 15.3.2010 06:00 − 31.3.2010 06:00
−1.5 −1 −0.5 0 0.5 1 1.5
Fig. 5. The multilinear regression model parameters for the feed compensation model of the copper flotation circuit. Parameters values that do not significantly differ from zero are presented in white.
27.2 27.4 27.6 27.8 28 28.2 28.4 Operator A Operator B Operator C Operator D Operator E Grade (%)
CuV Analysis of Quality: 15.3.2010 06:00 − 31.3.2010 06:00
(a) 95.3 95.4 95.5 95.6 95.7 95.8 95.9 96 96.1 Operator A Operator B Operator C Operator D Operator E Recovery (%)
CuV Analysis of Recovery: 15.3.2010 06:00 − 31.3.2010 06:00
(b) 2 2.2 2.4 2.6 2.8 3 Operator A Operator B Operator C Operator D Operator E Economic Index
CuV Analysis of Economic Index: 15.3.2010 06:00 − 31.3.2010 06:00
(c)
Fig. 6. Statistical differences of the operator groups A...E for (a) Grade (%), (b) Recovery (%) and (c) Economic index of the copper flotation. Dotted vertical line is the median of the whole data set, vertical lines are the 25 % and 75 % quartiles, circles are the locations of the operator medians; statistically significant difference is indicated by the green mark.
operators has been described in this work. The software streamlines and automatizes the analysis method, bringing it accessible to users in the industry.
The results of the analysis can show different levels of performance among the process operators, and identify the strong areas of each operator in terms of the perfor-mance index criteria. The results can also point towards various operating strategies different operators use. These observations may then be used when the process operation is further developed, and efficient operating methods can also be communicated and distributed among the operat-ing personnel at the plant. Knowledge of these operatoperat-ing methods are also useful when new operators are trained.
ACKNOWLEDGEMENTS
The authors would like to thank Pyhäsalmi mine for providing the data used in this study, and for their invaluable cooperation. The cooperation of Outotec Oyj is also gratefully acknowledged.
REFERENCES
Samuel Aulanko and Kalevi Tervo. Modeling and evalu-ation of harbor crane work. In Proceedings of the 2009 IEEE International Conference on Systems, Man, and
Cybernetics, pages 853–858, 2009.
Adrian W. Bowman and Adelchi Azzalini. Applied
Smoothing Techniques for Data Analysis. Oxford
Uni-versity Press, 1997.
Jean Dickinson Gibbons. Nonparametric Statistical Infer-ence. Marcel Dekker, Inc., 2nd edition, 1985.
Olli Haavisto and Antti Remes. Data-based skill evalua-tion of human operators in process industry. In Proceed-ings of the 2010 International Conference on Control,
Automation and Systems (ICCAS), 2010.
Fumio Harashima and Satoshi Suzuki. Human adaptive mechatronics - interaction and intelligence. In Pro-ceedings of the 9th IEEE International Workshop on
Advanced Motion Control, pages 1–8, 2006.
Janne Pietilä and Olli Haavisto. Comparison of operator performance in a mineral processing plant. In Pro-ceedings of the 2010 IEEE International Conference on
Systems, Man, and Cybernetics (SMC), 2010.
Y. M. Sebzali and X. Z. Wang. Joint analysis of process and operator performance in chemical process opera-tional safety. Journal of Loss Prevention in the Process
Industries, 15(6):555–564, 2002.
Ceyda Günör Şen and Gökçe Çinar. Evaluation and pre-allocation of operators with multiple skills: A combined fuzzy AHP and max-min approach.Expert Systems with
Applications, 37(3):2043–2053, 2010.
Thomas B. Sheridan. Humans and Automation: System
Design and Research Issues. Wiley Series in Systems
Engineering and Management. John Wiley, 2002. Satoshi Suzuki, Keiichi Kurihara, Katsuhisa Furuta,
Fu-mio Harashima, and Yaodong Pan. Variable dynamic assist control on haptic system for human adaptive mechatronics. InProceedings of the 44th IEEE
Interna-tional Conference on Decision and Control, pages 4596–
4601, 2005.
Kalevi Tervo, Lauri Palmroth, and Heikki Koivo. Skill evaluation of human operators in partly automated mo-bile working machines. IEEE Transactions on
Automa-tion Science and Engineering, 7(1):133–142, 2010.
Barry A. Wills. Wills’ Mineral Processing Technology. Elsevier, 7th edition, 2006.