Detection of Illicit Behaviours and Mining for Contrast Patterns
A thesis submitted in fulfilment of the requirements for the degree of Doctor of Philosophy
David Savage
Bachelor of Mathematics and Statistical Science, La Trobe University
School of Science
College of Science, Engineering and Health RMIT University
Declaration
I certify that except where due acknowledgement has been made, the work is that of the author alone; the work has not been submitted previously, in whole or in part, to qualify for any other academic award; the content of the thesis is the result of work which has been carried out since the official commencement date of the approved research program; any editorial work, paid or unpaid, carried out by a third party is acknowledged; and, ethics procedures and guidelines have been followed.
I acknowledge the support I have received for my research through the provision of an Australian Government Research Training Program Scholarship.
David Savage 20 July 2017
Contents
Abstract ii
1 Introduction 1
1.1 General overview of example problem domains . . . 2
1.2 Network analysis . . . 8
1.3 Contrast pattern mining . . . 9
1.4 Overall contribution . . . 10
1.5 Thesis structure . . . 11
2 Related work 13 2.1 Money laundering . . . 13
2.2 Opinion spam . . . 16
2.3 Detection of illicit behaviour in networks . . . 18
2.4 Contrast pattern mining . . . 20
3 Supervised learning for detection of suspicious financial communities 23 3.1 Network model . . . 23
3.2 Supervised learning applied to financial communities . . . 31
3.3 Summary . . . 34
4 Detection of opinion spam through anomalous rating deviation 36 4.1 Detection of opinion spammers through consideration of majority opinion . . 37
4.2 Evaluation . . . 42
5 Distributed mining of contrast patterns 52
5.1 Contrast Pattern Preliminaries . . . 53
5.2 Distributed CP-Growth . . . 60
5.3 Experiments with real data . . . 64
5.4 Summary . . . 70
6 Deriving item-based features from networks for analysis using contrast patterns 72 6.1 Patten based clustering of networks . . . 73
6.2 Representation of networks as item-sets . . . 73
6.3 Applications to real data . . . 76
6.4 Summary . . . 84
7 Discussion and conclusions 86 7.1 Summary of research findings . . . 86
A Anomaly detection in online social networks 92 A.1 Introduction . . . 92
A.2 Related Work . . . 94
A.3 Problem domains for the application of anomaly detection in social networks 95 A.4 Definitions . . . 96
A.5 Characterisation of anomalies . . . 98
A.6 Methods for anomaly detection . . . 101
A.7 Discussion . . . 110
Abstract
This thesis describes a set of novel algorithms and models designed to detect illicit behaviour. This includes development of domain specific solutions, focusing on anti-money laundering and detection of opinion spam. In addition, advancements are presented for the mining and application of contrast patterns, which are a useful tool for characterising illicit behaviour.
For anti-money laundering, this thesis presents a novel approach for detection based on analysis of financial networks and supervised learning. This includes the development of a network model, features extracted from this model, and evaluation of classifiers trained using real financial data. Results indicate that this approach successfully identifies suspicious groups whose collaborative behaviour is indicative of money laundering.
For the detection of opinion spam, this thesis presents a model of reviewer behaviour and a method for detection based on statistical anomaly detection. This method considers review ratings, and does not rely on text-based features. Evaluation using real data shows that spammers are successfully identified. Comparison with existing methods shows a small improvement in accuracy, but significant improvements in computational efficiency.
This thesis also considers the application of contrast patterns to network analysis and presents a novel algorithm for mining contrast patterns in a distributed system. Contrast patterns may be used to characterise illicit behaviour by contrasting illicit and non-illicit behaviour and uncovering significant di↵erences. However, existing mining algorithms are limited by serial processing making them unsuitable for large data sets. This thesis advances the current state-of-the-art, describing an algorithm for mining in parallel. This algorithm is evaluated using real data and is shown to achieve a high level of scalability, allowing mining of large, high-dimensional data sets. In addition, this thesis explores methods for mapping network features to an item-space suitable for analysis using contrast patterns. Experiments indicate that contrast patterns may become a valuable tool for network analysis.
Acknowledgements
Thank you to my supervisors, Xiuzhen Zhang, Pauline Chou and Xinghou Yu. During my time at RMIT I have been greatly inspired by your depth of knowledge and your commitment to this project. I would especially like to thank Xiuzhen Zhang for the many interesting conversations and for always supporting me as I tried out new ideas.
Thanks also to Qingmai Wang, who has been an excellent source of knowledge and ca-maraderie.
The research presented in this thesis was undertaken with an industry partner, the Aus-tralian Transaction Report and Analysis Centre. I would like to take this opportunity to thank Claude Colasante for making this project possible and for his ongoing support. I would also like to thank Francesca Jobson, Emma Young, Ajendra Dwivedi, Kimberly Day and Mitko Stoyanov for their friendly advice and assistance.
Finally, I wish to thank my partner, Chantel, whose constant support and encouragement has been invaluable in completing this project.
Publications
Parts of the research described in this thesis have been published as peer-reviewed articles. These publications correspond to thesis chapters as follows.
• Chapter 3: Savage, D., Wang, Q., Chou, P., Zhang, X. and Yu, X. Detection of Money Laundering Groups: Supervised Learning on Small Networks. AAAI - AI and OR for Social Good (2017)
• Chapter 4: Savage, D., Zhang X., Yu, X., Chou P., and Wang, Q. Detection of opinion spam based on anomalous rating deviation. Expert Systems with Applications (2015)
• Chapter 5: Savage, D., Zhang X., Yu, X., Chou P., and Wang, Q. Distributed Mining of Contrast Patterns. Transactions on Parallel and Distributed Computing (2017)
• Appendix A: Savage, D., Zhang X., Yu, X., Chou P., and Wang, Q. Anomaly detection in online social networks. Social Networks (2014)
1.
Introduction
This thesis describes a set of novel data mining algorithms and domain models intended for use in detecting illicit behaviour. Detection of illicit behaviour is a challenging area of research due to the adversarial nature of the relevant problem domains. Entities that exhibit illicit behaviour often attempt to mask their intent, hiding their illicit activities amongst legitimate activity. In many situations, these entities have multiple options for achieving their goals, with each option leading to quite di↵erent types of observable behaviour. Moreover, entities may modify their activities over time, possibly in response to detection systems that target particular behaviours.
Two problem domains are explored in this thesis as motivation for detection of illicit activities; money laundering and opinion spam. Illicit activities associated with these problem domains impose significant financial costs and, particularly in the case of money laundering, significantly impact the wellbeing of society (further described in Sections 1.1.1 and 1.1.2, respectively). Both of these problem domains continue to be active areas of research, with data mining seen as a valuable tool for detection of the relevant behaviour. While these two domains form the major focus of this thesis, the work conducted has lead to more general advancements in data mining capabilities, and these advancements are also presented in this thesis.
In some situations, detection of illicit behaviour may be trivially reduced to detection of individual illicit actions. In these situations, actions may be linked to the entity performing the action, and detection of an illicit action implies that the linked entity exhibits illicit behaviour. For example, individual spam reviews may be identified by considering the text of the review and comparing this to other known spam reviews (e.g. [141]). Obviously, by identifying a spam review, the spam reviewer is also identified and action may be taken against that reviewer. However, illicit behaviour may involve multiple actions that are only
identified as illicit when the full set of actions is considered as a whole. For example, a single cash transaction slightly below the minimum reporting threshold may not be deemed illicit. However, several such transactions by the same entity on the same day provides strong evidence of illicit behaviour (this is referred to as structuring). In this thesis, focus is given to detection of illicit behaviour, rather than illicit actions.
1.1 General overview of example problem domains
In developing solutions for detecting illicit behaviour this thesis considers anti-money laun-dering and detection of opinion spam as example problem domains. Both money launlaun-dering and opinion spam impose significant economic and societal burdens, and detection of illicit behaviour within these domains continues to be an active area of research. A broad overview of the two domains is given in the following sections, while chapter 2 provides an extensive review of previous research directly relevant to this thesis.
1.1.1 Money laundering
Money laundering is the process by which criminal groups attempt to obfuscate the original source of funds derived from illegal activity. Money laundering is a global problem, and has numerous detrimental e↵ects on society. In particular, laundering of funds allows criminal groups to realise a profit from their crimes, providing free capital that may then be used to finance further criminal activity. In addition, money laundering can significantly undermine confidence in financial systems and financial institutions, and damage local economies.
The term money laundering stems from the use of laundrettes as a front business for organised criminal groups operating in the USA during the prohibition era [179]. However, the act of obfuscating the source of funds, or the true owners of these funds, has a far longer history [162].
400 of the Criminal Code. Provisions in the criminal code relate to both the proceeds and instruments of crime, with severity of the crime dictated by the amounts involved and the extent to which implicated parties were aware of the source or purpose of the illicit funds.
In recent years data mining and machine learning techniques have been shown to be highly suited for detection of money laundering, owing to the large volumes of data and the complex nature of transaction relationships (e.g. [90, 42, 100, 89, 188]). This thesis advances the current state-of-the-art by modelling financial data as a transaction network and treating small communities extracted from this network as observations for data mining and machine learning. Since money laundering is inherently a group activity, evidence of money laun-dering will often include multiple transactions and multiple interacting parties (individuals, businesses, etc.). By analysing small communities it is anticipated that suspicious activity may be uncovered that is not apparent when parties are analysed in isolation. This thesis contributes models and novel algorithms for performing this type of analysis.
While money laundering is a global problem, this thesis will at times consider money laundering from an Australian perspective. This reflects the fact that the research described was conducted in collaboration with Australia’s financial intelligence unit, the Australian Transaction Reports and Analysis Centre (AUSTRAC).
1.1.1.1
Scale and impact
Given the clandestine nature of money laundering, it is difficult to estimate the extent of the problem. In 2003, the World Bank estimated that at least US$1 trillion was laundered each year. The US Drug Enforcement Administration (DEA) has estimated that at least US$600 billion was laundered in 2003 (see [180, 21]). However, methods used to obtain these estimates have been criticised [154], and it has been suggested that there is an over-emphasis on estimating the amount of money laundered while more important measures are ignored [105, 154]. One argument is that the various estimates are meaningless since they cannot be compared; changes in estimates from one year to the next are likely to reflect di↵erences
in the estimating process rather than actual changes in amounts laundered [154]. However, the more conservative estimates put forward by these critics still place the total amount laundered at several hundreds of billions (US) each year.
While the extent of money laundering is disputed, it is widely accepted that unchecked money laundering can severely damage economies and impose significant burdens on society [155, 21].
At a local-scale, since successful laundering of illicit funds results in additional crime, money laundering can be said to negatively impact on individuals’ health and wellbeing. In addition, money laundering operations can have significant impacts on legitimate businesses, who may be forced to compete with front businesses with no need to turn a real profit [121]. Furthermore, since devices used for money laundering are often minor variations on devices used by legitimate businesses, money laundering can impact consumer confidence in businesses that use these products, and financial institutions that provide them 1 [17].
At the macro-scale, high levels of money laundering can distort economic data, making it difficult for policy makers and investors to make sound decisions [150, 161, 21]. Moreover, money laundering syndicates may lobby for reduced regulation of certain financial services or the introduction of new products that are suitable for laundering [17]. When combined with high levels of corruption, such lobbying is likely to result in highly vulnerable economies. In addition, increases in crime that follow from successful money laundering may negatively impact consumption [8] and impose significant costs for health services and law enforcement.
1.1.1.2
The money laundering process
Organised criminal groups have shown themselves to be highly inventive in developing money laundering typologies2. Any means by which funds can legitimately change hands can be
1For example, following release of the ‘Panama papers’ significant e↵ort was made to explain that the
individuals or corporations making use of o↵shore tax-havens were not necessarily criminals
2Typologies describe the relationships between various parties involved in a money laundering operation,
the flow of funds between them, and the specific channels and mechanisms used to transfer value. See for example, [11]
corrupted for use by money launderers, leading to a multitude of options for transferring illicit funds [60]. However, despite the diversity of typologies, the process of money laundering is generally considered to follow three main stages; placement, layering and integration [10].
The placement stage of money laundering represents the introduction of funds obtained through criminal activities into the financial system. Typically, this involves deposits that are spread over time and geographical locations. Once the funds have been placed into the financial system, layering is undertaken in order to hide the original source of the funds. This stage includes numerous transactions, and often involves o↵shore accounts and complex investment vehicles. In the final stage, integration, funds (or equivalent value) are transferred to the actual owners, often in the form of investments or tangible goods (e.g. jewellery, high-end cars, etc.).
Traditionally, criminals are considered to be most vulnerable during the placement stage. This is because large volumes of cash can be difficult to move and financial institutions are typically quite sensitive to unusual behaviour relating to cash deposits 3 Moreover, those
parties involved in placement are more likely to be directly involved in predicate crimes, and are therefore more likely to be identified through discovery of these crimes.
Once illegally obtained funds enter the formal banking system, layering and integration can be achieved through the vast range of services that are available for movement of legit-imate funds [10]. Traditionally, anti-money laundering programs have had limited success in detecting money laundering during these later stages. However, it is hoped that further research into the application of data mining techniques will improve detection capabilities in these later stages.
In addition to the three stages of money laundering, AUSTRAC has identified four key behaviours relating to money laundering activity in Australia [10].
3The financial action task force (FATF) recommends that anti-money laundering programs include
manda-tory reporting by remitters of cash deposits above a certain threshold and the submission of reports relating to any suspicious behaviour. This includes behaviour observed by sta↵at the time that the deposit is made. In Australia, financial institutions must alert AUSTRAC to suspicious behaviour within 3 days (24 hours if the matter relates to terrorism financing).
1. Criminal groups intermingle illicit and legitimate activity
2. Criminal groups engage professional expertise (lawyers, accountants, etc.) 3. Criminal groups engage specialist money laundering syndicates
4. Organised crime in Australia has strong links with international organisations
While data mining techniques hold much promise for detection of money laundering, these four behaviours suggest that reliable detection poses a significant challenge. Clearly, criminal groups actively seek to hide their money laundering activities, and the mingling of illicit funds with legitimate funds means that suspicious behaviour will often look extremely similar to non-criminal behaviour unless viewed in a suitable feature space. Moreover, the engagement of finance professionals and money laundering specialists means that the layering and integration stages are likely to involve complex financial instruments and investments within a global market. This supports the notion expressed above, that evidence of money laundering will necessarily include multiple transactions and multiple parties, requiring a network-based approach for detection through data mining.
In this thesis, Chapter 3 describes a system for detecting suspicious behaviour in a finan-cial network. This system provides an example for detection of illicit behaviour that results from the coordinated activities of multiple individuals.
1.1.2 Opinion spam
Online product reviews, reporting others experience with a given product, can be extremely useful for consumers making purchasing decisions. Given the bounty of choice available in online stores, product reviews provide a helpful aid for consumers attempting to gauge product quality and decide between di↵erent brands and di↵erent product models. However, in recent years, opinion spam, consisting of fake reviews published by individuals with vested interests, has become a major problem for consumers [84, 98, 72]. Opinion spam typically
involves the publication of fake product reviews for the explicit purpose of influencing a buyers’ perceptions of quality and utility [84, 98]. By publishing numerous fake reviews, opinion spammers attempt to artificially inflate consumers’ confidence that previous buyers are satisfied with their purchase. Alternatively, spammers may attempt to create an artificial belief that previous buyers of a competitors’ product have come to be dissatisfied with their purchase.
Previous approaches to detecting opinion spam have tended to focus on analysis of re-view text (see Heydari et al. [72] for a comprehensive survey of existing methods). These approaches rely on the identification of duplicated passages of text occurring in multiple reviews (e.g. Jindal and Liu [84], Lau et al. [101], Mukherjee, Liu, and Glance [131], and Mukherjee et al. [132]), or consider multiple text-based features, using manually identified opinion spam to train classifiers (e.g. Ott et al. [141], Li et al. [106], Ramkumar, Rajasekar, and Swamynathan [151], and Fusilier et al. [53]). While these text-based approaches have been used with success, they su↵er three major drawbacks [2]. First, detection of repeated text requires expensive comparisons, and without first narrowing down the selection of can-didates the number of comparisons required may quickly become infeasible. Second, new training data is often required for di↵erent product domains (e.g. hardware products vs restaurant reviews), and third, manual identification of opinion spam for use in training can be an expensive and time-consuming undertaking. Moreover, many rating systems in use today require only a rating (typically expressed as a binary good/bad or as 1 5 stars), with a text-based review optional (e.g. the Apple App Store), or not possible at all (e.g. the Facebook ‘like’ system). Thus, there is a need to develop methods for detecting opinion spam based solely on ratings [2].
Many online shopping services display the mean rating for available products, and this has been shown to be a key piece of information used by consumers in making their purchas-ing decisions [32]. Thus, one way in which opinion spammers attempt to alter consumers’ perception of quality is to manipulate the mean rating for a target product. By generating
multiple reviews that appear to have originated from di↵erent users, spammers are able to significantly distort the mean rating [2, 131]. However, in doing so, spammers are often required to post ratings that are at odds with those of honest reviewers, and consequently opinion spammers can be expected to have an abnormal number of reviews that significantly di↵er from the mean rating.
In this thesis, a novel approach to detection of opinion spam is proposed that focuses on review ratings (e.g number of stars). This approach detects opinion spammers by identifying anomalous patterns of rating behaviour. Consequently, this approach is suitable for use in rating systems where a text review is not provided.
1.2 Network analysis
In chapters 3 and 6 machine learning is applied to information-rich networks. The term information-rich4 refers to networks that include multiple edge and vertex attributes
describ-ing the entities in the network and the relationships between them.
A key challenge in applying machine learning to information-rich networks is the develop-ment of features that capture both structural and non-structural information. In chapter 3, the structure of financial networks is represented through invariants such as diameter, girth, clustering coefficient, etc., while information held in the network attributes is represented through a separate set of features. Separating the structural and non-structural features in this way provides a simple, easily calculated summary of the networks. However, this approach fails to capture the relationships between local structural elements and attribute values within these elements. In Chapter 6, an alternative method for generating network features is explored, which attempts to capture some of the information held in these rela-tionships.
4Alternatively, information network [57], heterogeneous information network [175], complex network [19],
1.3 Contrast pattern mining
Contrast patterns (also known as emerging patterns) are mined in order to identify significant di↵erences between two contrasted sets of data. Contrast patterns are able to capture highly discriminative information, and have previously been shown to be useful for wide range of data analysis tasks, including exploratory analysis, supervised and unsupervised learning and outlier detection [39, 46, 108, 197, 37]. Moreover, contrast patterns are easily interpretable, providing a succinct, easily understandable description of the di↵erences between contrasted sets. This makes contrast patterns particularly useful for mining illicit behaviours such as money laundering, where analysts are expected to further investigate candidate cases. Contrast patterns provide a clear indication of how the particular entity di↵ered from the normal population, providing a starting point for further analysis.
To date, advances in contrast pattern mining have come in the form of highly-optimised data-structures (e.g. [38, 46, 111]), additional constraints for pruning the search-space (e.g. [198, 177]), or extensions to particular types of data (e.g. [94]). For sparse, relatively low dimensional data, the resulting algorithms are extremely efficient; able to identify highly-discriminating contrast patterns in a matter of seconds. However, existing algorithms are designed to run in a sequential manner on a single machine. Consequently, these algorithms do not have the scalability required for mining next-generation databases. With the growing trend towards Big Data and cloud based systems, algorithms for contrast pattern mining must be able to scale with the underlying system and be able to handle high density, high volume and high dimensionality. Since existing algorithms are unable to meet these requirements, there is a substantial need for development of new algorithms to meet ongoing demands.
There are two main challenges to mining contrast patterns in large databases, relating to both the volume and the dimensionality of the database. First, high volume databases are likely to be stored in a distributed fashion, typically optimised for use with distributed analytics platforms based on map-reduce. Existing approaches for mining contrast patterns
do not support these types of systems, relying on a global access to the underlying database. Second, even if the target database sits on a single machine, high-dimensional databases are likely to result in a search-space that is prohibitively large if processed in a sequential manner. In mining for contrast patterns, dimensionality, rather than volume of records, determines the size of the search-space. Small increases in dimensionality lead to large increases in the number of possible patterns, greatly increasing the time required for mining to be completed. In this thesis, both of these issues are addressed, and a novel algorithm is developed that enables mining of contrast patterns to be performed in a distributed manner.
1.4 Overall contribution
The project was undertaken in collaboration with an industry partner, the Australian Trans-action Reports and Analysis Centre (AUSTRAC). As such, the models and algorithms de-veloped are largely intended to address AUSTRAC’s specific capability requirements and some of the outputs from this project are directly applicable within AUSTRAC’s intelligence environment.
The specific contributions of this thesis include:
1. Development of a system for detecting suspicious communities in a financial network. This system models transaction reports submitted to AUSTRAC as a typed, attributed network and extracts communities from this network using a method that incorporates AUSTRAC business knowledge. Supervised learning is then applied to detect com-munities exhibiting suspicious behaviour. Evaluation of this system indicates that the resulting classifier performs well and is able to identify suspicious communities with high precision.
2. Development of a novel method for detecting opinion spam in online product reviews. Previous methods for detecting opinion spam have focused on analysis of review text, however text is not always available, and many review systems consider only numeric
rating (e.g. 5-star rating systems). The developed method considers only ratings, and applies statistical anomaly detection to identify reviewers with unusual rating be-haviour. Evaluation indicates that this method is e↵ective in identifying spam reviews.
3. Design and implementation of a distributed algorithm for mining contrast patterns. Contrast patterns are a valuable tool for knowledge discovery, describing the significant di↵erences between related sets. However, existing methods are designed to run on a single computing device, limiting their application to large data sets. As part of this project, a novel algorithm has been developed which is capable of running on a distributed system. Timing experiments with AUSTRAC data show that this algorithm provides significant improvements over existing solutions and demonstrates a high level of scalability.
4. Consideration of contrast patterns as a tool for network analysis. Contrast patterns provide an extremely flexible tool for analysing sparse data, however previous applica-tions have tended to focus on non-network problem domains. This thesis presents an exploration contrast patterns as a tool for network analysis. This includes mapping of networks to a suitable item-space that captures relationships between network struc-ture and the information held in edge and vertex attributes. Experiments with real data demonstrate the potential for using contrast patterns in this way.
1.5 Thesis structure
The remainder of this thesis is structured as follows.
• Chapter 2 provides a survey of related work. This chapter provides a detailed explo-ration of the current state-of-the-art that serves as a basis, and point of comparison, for the novel data mining algorithms and domain models presented in this thesis.
• Chapter 7 provides an overall summary of the thesis, including suggestions for future work.
• Appendix A presents a survey on anomaly detection in networks. This survey stems from the work presented in Chapter 3, which considers analysis of networks using supervised learning. Anomaly detection can be considered as an alternative approach that is highly applicable to the money laundering problem domain. In order to better understand this alternative approach, a survey of available literature was conducted. Since this survey covers a broad range of issues outside the main topics of this thesis, it is included as a separate appendix.
2.
Related work
This chapter provides a review of current literature related to the detection of money laun-dering and opinion spam, and to contrast pattern mining.
2.1 Money laundering
Existing literature relating to money laundering research can be roughly divided into three categories; (1) quantification, (2) evaluation and (3) methods for detection.
Category 1 consists of a large body of work devoted to quantifying the extent of money laundering and it’s impacts on society (e.g. [183, 184, 160]). Within this category, there is significant debate regarding the methods used and whether or not there is actually any value in attempting to estimate the amounts laundered (e.g. [154, 105]).
Category 2 contains those studies that attempt to evaluate existing anti-money laundering policies and programs (e.g. [112, 134, 34, 36, 119, 182]). Clearly, this work is closely related to that in Category 1, as any evaluation must consider how these programs are reducing the extent and impact of money laundering. This category contains significant criticism of existing approaches (e.g. [112, 155]), suggesting that the cost imposed by anti-money laundering regimes is disproportionate to the level of demonstrated success. In part, this stems from the high diversity of channels available to criminals for laundering illicit funds; attempts to closely monitor one channel may simply result in criminals switching to another [179]. In addition, recent reports have criticised the strong focus on predicate crimes (i.e. the crime that generates funds to be laundered), suggesting that resources may be better allocated by focusing directly on detection of money laundering [34, 119].
Finally, Category 3 deals with the actual detection of money laundering by law-enforcement and intelligence agencies. This includes studies of money laundering typologies (e.g. [11, 78,
69]), emerging threats (e.g. [130, 20, 171]) and the use of computational techniques for au-tomated detection (e.g. [88, 40, 58, 93, 89]). The work presented in this thesis falls within this third category, contributing novel methods and algorithms for detection.
2.1.1 Automated detection
Traditionally, discovery of a predicate crime has often resulted in simultaneous discovery of the mechanisms used for laundering the proceeds of these crimes. However, more recently, these two aspects of organised crime have become increasingly separated (e.g. use of money laundering syndicates [10]). In response, an increased emphasis has been placed on detecting money laundering without knowledge of the predicate crime [48, 34]. Similarly, there is an increased focus on terrorism financing, where the funds in question are an instrument of crime, rather than the proceeds of crime. Consequently, detection of money laundering
per se has become a major goal for intelligence and law enforcement agencies [17]. Given the volumes of data involved, data mining is seen as a necessary component of investigative procedures [88, 89].
One of the earliest reports of an automated system for detecting money laundering applied rule-based evaluation to identify suspicious parties [165]. The rules used by this system were derived from expert knowledge and encoded in an evaluation module that was run each time the target database was updated. Parties matching the provided rules would then be further investigated by analysts using an interactive query interface and a variety of visualisation tools provided by the system. More recently, Wang et al. have described an alternative rules-based system, where rules are encoded using a decision tree [186].
While rule-based systems may be highly accurate, they are dependent on expert knowl-edge, and cannot be used to uncover new typologies (i.e. modes of operation). Given the wide variety of money laundering typologies, and the potential for rapid evolution, this is a major drawback for these types of systems [56]. Later systems have addressed this issue by applying more flexible approach based on a combination of supervised and unsupervised
learning. Many of these systems follow a basic premise, first embraced by Kingdon [93], which centres on the notion of ‘know your customer’ and the use of anomaly detection for identifying money laundering behaviour.
In these later systems, two main contexts have been considered for deriving models of normal, non-suspicious behaviour. The first context is provided by the transaction history for a given party, while the second context is provided by sets of parties exhibiting similar behaviour. In the original system described by Kingdon, grouping of parties into related sets was based on a small number of superficial features such as the use of similar banking prod-ucts, or sets of businesses providing the same service. Later systems have greatly improved on this scheme, applying distance-based clustering across a far broader range of features (e.g. [203, 88, 196, 152]).
In contrast to an anomaly detection approach, a number of systems apply supervised learning to identify suspicious behaviour (e.g. [113, 71]). In general, these systems are expected to provide a higher degree of precision than those based on anomaly detection, since anomalous behaviour does not necessarily translate to money laundering activity. However, unlike those based on anomaly detection, these systems can only identify suspicious behaviour that is similar to that observed in previous investigations.
To date, the majority of systems reported in the literature have focused on individual parties, considering amounts transacted, frequency of transactions, etc. However, more recent studies have begun to adopt a network-based approach, considering features derived from the structure of a transaction network.
For example, the system described in [41] uses role assignment to augment a more tra-ditional approach based on anomaly detection (described in [42]). Using bank statements, a social network is constructed with parties linked by transactions. For each party in the network a number of invariants (betweenness centrality, page rank, etc.) are calculated. A role is then assigned to the party depending on the values of these invariants. Examples of roles include insulators, who act as a bu↵er between a core group of parties and the larger
network, and communicators who act as a conduit for movement of funds between two oth-erwise unconnected parties. Assigned roles are then taken into account when considering the normality of a given parties transactions, with parties having the same role expected to show similarities in their transaction histories.
Taking the structural considerations even further, the systems described in [15, 123] aim to identify subgraphs within a network that closely match known typologies . In these systems, the use of fuzzy matching means that subgraphs may deviate in some way from the given typology, providing greater flexibility than a simple motif search.
2.2 Opinion spam
Previous approaches for detection of opinion spam have typically involved supervised or unsupervised learning based largely on text-based features [72]. While many of these ap-proaches include some non-text-based features, the major focus to date has been on features such as n-gram counts and cosine similarity. Using these types of features, a wide variety of supervised and semi-supervised classifiers have been described [106, 141, 109, 53]. These classifiers are able to successfully identify spam with a high degree of accuracy, however, in order to perform required training, these studies rely on manual labelling of reviews by domain experts, which is a time-consuming and costly endeavour.
To overcome the difficulties associated with manual labelling, an unsupervised approach has been proposed that applies an unsupervised Bayesian framework to detection of opinion spammers [131, 132]. In this framework, the spamicity of each reviewer is modelled as a latent variable in a hierarchical model including both text- and non-text-based features. Experiments with real data sets showed that this approach is able to accurately identify opinion spammers, with posterior analysis suggesting that discrimination between spammers and non-spammers is largely driven by text-based features. However, we note that this posterior analysis also showed that rating deviation was an important aspect of spammer
behaviour, and suggested that rating deviation may be more useful in separating spammers from non-spammers than consideration of early reviews and reviews consisting of extreme ratings.
While the vast majority of previous work has focused on text-based features, one excep-tion is the FraudEagle algorithm [2], which has been shown to successfully detect of opinion spammers using only product ratings. The FraudEagle algorithm uses a graph-based repre-sentation of the product-review system, with reviews represented as edges between reviewers and products. FraudEagle applies an iterative approach to spammer detection, whereby the inter-dependency between perceived product quality and the spamicity of reviewers is re-solved by updating scores for a given vertex, and then propagating this update along edges in the graph, converging when the scores for each vertex becomes consistent with its neigh-bours’ scores. A similar approach is also proposed in Wang et al. [185], however this study deals with reviews of retail stores, which can change in quality over time, requiring the timing of reviews to be taken into account by the detection algorithm.
In detecting opinion spammers, the FraudEagle algorithm relies on a set of parameters describing the di↵erent behaviour of honest reviewers and spammers. These parameters are difficult to estimate a priori, and are consequently set to arbitrary values [2]. In this the-sis, a significantly di↵erent approach is taken to that of FraudEagle, which eliminates the requirement for these parameters, and does not require a graph representation of the system. Instead a binomial model of reviewer behaviour is fit to the target set of product ratings, resulting in a more accurate representation of reviewer behaviour, and at the same time greatly reducing the computational requirements.
In addition to those works focusing on opinion spam, related work is also found across a wide range of problem domains through the shared use of statistical anomaly detection. For example, statistical anomaly detection has previously been employed for detecting unusual movement in crowds [95], network intrusion [45], spam phone calls through VoIP [86], and
threats to operating system security [97]. A comprehensive review of anomaly detection in general is given in Chandola, Banerjee, and Kumar [26], with statistical anomaly detection discussed alongside alternative methods. Similar approaches are also discussed by Markou and Singh [117] in their review of statistical novelty detection.
2.3 Detection of illicit behaviour in networks
In recent years, network analysis has become an extremely active area of research [19],driven in part by the significant increase in available network data. The digitisation of many forms of communication, and advances in chemical and biological sciences, have led to masses of data being generated that capture the various interactions between people, organisations, genes, proteins, machines, etc. The availability of large data sets, and the desire to turn these into useful, or marketable, information has led to the development of highly-detailed models and an ability to identify complex behaviours representative of highly-specific concepts.
Network analysis has previously been applied to a number of problem domains that constitute illicit behaviour. This includes detection spam [169], detection of sexual predators in online social networks [49], anti-money-laundering and terrorism financing [41, 153, 96], and detection of online fraud [142, 28]. Similarly, previous research has considered a broad range of analysis techniques, including anomaly detection (see [6, 158] for current reviews), and pattern / motif matching (e.g. [169, 49, 43, 44]).
2.3.1 Development of network features
In applying network analysis to the detection of illicit behaviour it is assumed that evidence for the illicit behaviour is apparent in the network model (i.e. the manner in which enti-ties are connected is somehow important). For example, evidence may take the form of a distinguishing sub-structure (i.e. a specific subgraph) or a relationship between structural and non-structural elements (i.e. entities with specific attributes are connected in a specific
way). However, traditional data mining algorithms are unable to handle the extremely high dimensionality of network objects. Thus a key challenge in applying network analysis is the development of a mapping between the network and a lower dimensional feature space that maintains a suitable level of detail regarding the network structure [158].
Clearly, the complexity of this mapping will depend on the particular application, and the level of detail required for analysis. For example, a relatively simple mapping may construct a feature space based on a small number of graph invariants (e.g. size, diameter, transitivity, etc. [5, 114]). A more complex mapping may consider features that capture complex relationships between the network structure and relevant attributes of the entities and relationships being modelled (e.g. [41]).
As described in Savage et al. [158] (see Appendix A), the mapping from a network model to a tractable feature space begins with a basic unit of analysis. For example, the work presented in Chapter 3 considers k-step neighbourhoods as the basic unit of analysis. Alternative units include connected components, communities (identified through traditional community detection algorithms), cliques, dyads or triads, etc. Each instance of the basic unit are mapped to the feature space, where they are represented as vectors that are suitable for analysis using traditional methods.
A reasonably simple mapping from networks to a Euclidean feature space can be achieved through the use of graph invariants. For example, Akoglu, McGlohon, and Faloutsos [5] take ego-nets (1-step neighbourhoods) as a basic unit of analysis, and map these to a two-dimensional feature space based on the number of parties and the number of edges. Within this two-dimensional feature space, anomaly detection is applied to identify those ego-nets exhibiting an unusual structure. Other invariants include the weight of ‘heavy edges’ [5], and the ‘fine structure’ of the network captured by leadership, diversity and bonding [114].
A more complex mapping, which captures information relating to local structures, is the use of subgraph features. Using subgraph features, each graph is described in terms of the presence or absence of particular subgraphs. The subgraphs considered are typically identified
through frequent subgraph mining (e.g. [163, 75, 172, 192, 24, 139]). This mining process identifies a set of subgraphs that are likely to provide high discriminatory power within the set of graphs to be analysed. As with graph invariants, subgraph features have previously been used to embed networks as vectors in a Euclidean space, allowing distances between graphs to be measured using a Euclidean metric.
For some forms of data mining, a non-Euclidean distance function may be specified as an alternative to mapping the networks to a Euclidean space. One example of this is clustering of networks based on their structure. Many clustering algorithms can be provided with a custom distance function that, in this case, allows them to operate on higher-dimensional objects. For example [164] develop a self-organising map that relies on edit-distance to update neurons as a means of clustering simple networks. Related ideas are presented in [85, 73], with di↵ering methods used to determine a local median network, which acts as a centroid, and to iteratively shift neighbouring networks towards the closest median as measured by a specified edit-distance. A review of di↵erent approaches to calculating edit-distances between networks is given in [57].
2.4 Contrast pattern mining
Contrast patterns were introduced by Dong and Li in their seminal paper in 1999 [38]. Since then, the utility of contrast patterns has been widely recognised, particularly their use for building high-quality classifiers (e.g. [39, 46, 197]).
Dong and Li originally proposed to mine contrast patterns using set intervals for efficient representation of large numbers of item-sets, and manipulation of interval borders to identify contrast patterns. The main idea behind this approach is that intervals with highly di↵erent borders contain contrast patterns. This approach was later advanced by Bailey et al. [13] who used a tree-based structure to limit the transactions considered by each border-based operation.
A major limitation of border-based approaches is the need to perform two separate runs to identify useful contrast patterns. For two data sets D1 and D2, these algorithms must be run once to discover patterns from D1 to D2 (i.e. frequent in D1 and infrequent in
D2) and then again to discover patterns from D2 to D1. CP-Tree [46] was developed to
overcome this problem, adapting the FP-Tree data structure [66, 67] previously described for efficient mining of frequent patterns in a single data-set (see Section 5.1 for di↵erences between frequent and contrast patterns).
As an alternative to CP-Tree, zero suppressed binary decision diagrams (ZBDDs), have also been proposed for use in mining contrast patterns [111]. The major advantage of ZBDDs is their suitability for mining disjunctive as well as conjunctive contrast patterns. However, mining using ZBBDs su↵er from the same limitation as earlier approaches, requiring two runs to discover patterns fromD1 toD2 and fromD2 toD1. In this thesis, focus is on conjunctive patterns, thus CP-Tree is used as the underlying data structure.
Contrast patterns are closely related to frequent patterns and the respective mining al-gorithms share many similarities. Unlike contrast-patterns however, a number of parallel algorithms for frequent pattern mining have been developed [80, 83, 104, 107, 129, 174, 201, 202]. Of particular interest is the PFP-Growth algorithm [107], which uses a map-reduce framework to parallelise mining operations. Many of the related publications following PFP-Growth represent variations addressing load balancing and the characteristics of particular types of cluster architectures.
The main idea behind PFP-Growth is the fact that a set of transactions with sorted items (forming a sequence of items) may be projected to a smaller subset by conditioning on short suffixes. Each projection may then be independently mined for frequent patterns [107]. Unfortunately, this same approach cannot be applied to mining of contrast patterns due to di↵erences in the mining process.
Frequent pattern mining di↵ers from contrast pattern mining in the order that candi-date patterns are generated and evaluated. Frequent pattern mining first considers patterns
occurring as suffixes, consisting of items that occur infrequently in the database. Longer patterns are generated by adding successively higher frequency items (see Section 5.1 for definitions). Projection of the database using these low-frequency suffixes results in small, largely disjoint, subsets of transactions. However, in mining for contrast patterns, the oppo-site approach is taken, with patterns containing high-frequency items considered first, and extensions to longer patterns made by adding lower frequency items [46]. This is a necessary condition for efficient pruning of the search-space. Consequently, low-frequency suffixes can-not be used for projection because the resulting subsets cancan-not be mined independently. The equivalent approach for contrast pattern mining would be to project using prefixes, however, since prefixes contain high-frequency items, projection onto prefixes would result in large overlapping subsets. In many cases the largest subsets would be only marginally smaller than the full dataset. Consequently, projection in this manner would introduce a high-level of redundancy, and require large amounts of data to be shu✏ed over the network. For this reason an alternative approach to that used by PFP-Growth is required for distributed mining of contrast patterns.
3.
Supervised learning for detection of
suspi-cious financial communities
This chapter describes an automated system for the detection of illicit behaviour indicative of money laundering in financial data. As discussed in Section 1.1.1, money laundering re-quires coordinated activity between multiple parties. Therefore, the system described in this chapter takes a network-based approach, detecting suspicious groups, rather than suspicious individuals or transactions.
The first part of this chapter describes the network model used to represent the AUSTRAC data, and the process used to extract meaningful communities. The second part of this chapter then describes the treatment of these communities as the basic unit of analysis for supervised learning. This includes a description of the features used for learning and an evaluation of a trained classifier.
3.1 Network model
3.1.1 Networks as graphs
Networks describe systems of interacting entities. Networks are typically represented using a graph, which is a pair (V, E) where V is a set of vertices, representing the entities in the system, and E is a set of edges, representing the relationships between these entities. Edges are typically modelled as a pair of vertices, thus E ✓V ⇥V.
A network may take a bipartite structure, in which case the set of vertices may be par-titioned into two subsets, V =V1[V2, V1\V2 =;. Edges in a bipartite network occur only between pairs of vertices where each vertex is in a di↵erent partition,E ✓V1⇥V2.
be be additionally described by some set of attributes (sometimes referred to as labels). In this case the network is represented using a graph (V, E, FV, FE), where FV :V ! A maps a vertex v 2 V to an attribute vector a 2 AV, and FE : E ! AE provides an equivalent mapping from edges to some attribute space AE.
In practice the terms graph and network are used interchangeably, and this convention is followed throughout this thesis.
3.1.2 AUSTRAC reports
AUSTRAC collects transaction reports from entities regulated under the Australian Anti-Money Laundering/Counter Terrorism-Financing (AML/CTF) Act, 2006. This includes fi-nancial institutions, other remittance providers, bullion dealers, and gambling service providers. Three types of reports are considered in this thesis; those relating to deposits above a des-ignated threshold (TTRs), international funds transfer instructions (IFTIs), and suspicious matter reports (SMRs).
Each report (for the purposes of this thesis) includes a set of ordering customers, a set of beneficiary customers, the amount transacted, and the transaction date. Reports also contain information relating to the bank accounts used in the transaction and the details of any identification presented by the ordering or beneficiary customers.
Transaction reports describe four di↵erent relationships between parties.
1. Reports describe the movement of funds between parties. Thus a pair of parties may be linked by a transaction relationship, indicating that funds were transferred from one of the parties to the other.
2. Reports may include multiple customers and multiple beneficiaries. This may occur, for example, when an individual conducts a transaction as part of a businesses operations. In this case, both the individual and the business will be listed as ordering customers. 3. Reports associate parties with supplementary evidence such as bank accounts and
iden-tification (e.g. passports, licences, etc.). Thus a pair of parties may be linked through a supplementary relationship, which indicates a shared use association with the sup-plementary evidence. For example, a report may provide details of a transaction in which party A transfers funds from account X. A second report may indicate that a di↵erent party, B, also transferred funds from account X. In this case A and B are linked through account X. Note that the recipient of these funds is irrelevant for the purposes of defining the relationship between A and B.
4. Reports relating to threshold transactions (TTRs) may include an agent relationship, where the agent party deposits funds on another’s behalf.
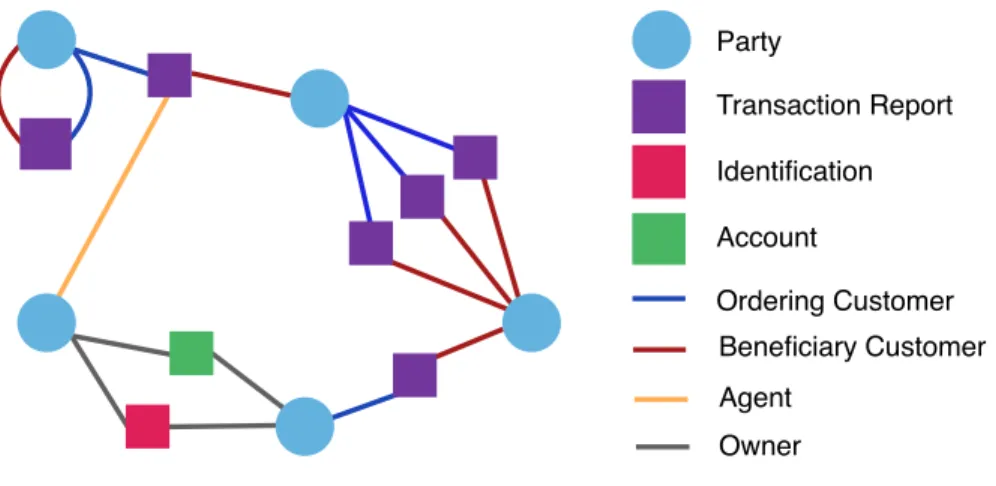
Given the fact that multiple parties may be connected through the same piece of evidence, a bipartite structure is employed for the network model, with parties and evidence forming the respective vertex types. Note that edges connecting parties to evidence are typed to indicate the particular relationship (e.g. an agent relationship between a party and a TTR report). Similarly, evidence vertices include a subtype attribute, indicating whether they represent a report, an account, or identification. An example network is given in Figure 3.1, showing each of the possible edge and vertex types.
3.1.3 Financial communities as near-
k
-step neighbourhoods
Money laundering involves multiple transactions between di↵erent parties. For this reason, there is significant interest in identifying small sets of interacting parties whose collective behaviour is suspicious. Since the system described in this thesis employs supervised learning, small groups of interacting parties must be extracted from the larger network and treated as observations. There are two main-options for this, community detection (top-down) or an ego-centric approach (bottom-up) based on k-step neighbourhoods. For our particular purposes, existing community detection algorithms (see [51] for a comprehensive review) su↵er from a number of issues, leaving the ego-centric approach as the favoured option.
Party Identification Transaction Report Account Ordering Customer Beneficiary Customer Agent Owner
Figure 3.1: Example financial network with bipartite structure. Each circle represents a di↵erent party, and each square represents a transaction, with di↵erent colours showing the di↵erent transaction types. Coloured edges are used to distinguish the various roles for parties involved in transactions.
A major drawback of existing methods is that they often result in excessively large com-munities [102, 99]. In general, meaningful comcom-munities are thought to contain less than 150 individuals [102, 7], and published typologies indicate that investigation of money laundering operations often focuses on a relatively small number of key parties [11]. Using traditional community detection algorithms, smaller communities tend to be found only at the extrem-ities of a network [102, 99]. Typically, these communextrem-ities consist of entextrem-ities that have only recently been added to the network. However, within the core of the network, where the vast majority of interactions take place, many of the detected communities are exceedingly large. For this reason, we take an ego-centric approach, building communities as a bottom-up process.
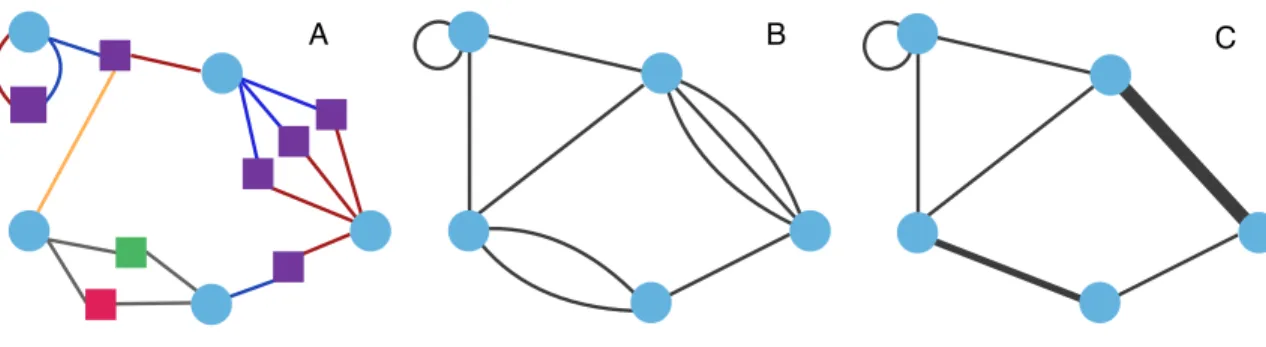
To avoid the large communities resulting from community detection algorithms, com-munities in the presented system are defined using a bottom up approach. As part of this process, the bipartite network described in Section 3.1.2 is projected onto the party vertices.
The resulting graph is then simplified, so that a pair of parties may be connected only by a single weighted edge. Figure 3.2 demonstrates this process for an example network.
Weights for projected edges are calculated based on the following assumptions.
1. Links through transaction reports are more important than links through supplemen-tary evidence
2. Supplementary evidence that is shared by many di↵erent parties is weak evidence
3. Parties that are associated with many pieces of supplementary evidence have weak links to other parties
4. The strength of a link between two parties is decided by the weaker association with the relevant evidence
Edge weights are calculated as a two step process. First the strength of a relationship between two parties p1, p2 through each linking piece of evidence e is calculated. This step corresponds to the projection from the bipartite network to a party to party network, so that
e corresponds to a node in the bipartite network, and to one or more edges in the projected network. Weights for edges resulting from the projection of e are calculated as follows. If e
is a report, then wp1,p2,e = 1, otherwise wp1,p2,e = min(wp1,e, wp2,e) where
wpi,e =
1
d(pi)(d(e) 1)
Here d(pi) is the number of pieces of supplementary evidence that pi is associated with and
d(e) is the number of parties associated with e. The value wpi,e may be interpreted as the
smallest probability that a two-step random walk beginning fromp1 would traverse evidence
e and finish at p2, or begin at p2 traverse through e and finish atp1.
For the second step, projected edges are summarised as a single link for each connected pair of parties. The aggregated weight for this summarised edge is calculated as
A B C
Figure 3.2: Projection and simplification of bipartite financial network. (A) Bipartite network. (B) Projection onto parties. (C) Simplification to weighted edges, representing the strength of the relationship based on the number of transactions, and the number of shared accounts, identification, etc.
wp1,p2 = 1 |E| X e2E wp1,p2,e
where E denotes the set of evidence shared by p1 and p2. The value of wp1,p2 represents the
average strength of the connections between p1 and p2.
If the weightwp1,p2 is smaller than a specified threshold, denotedwmin, the link is removed
from the network. In this case the evidence supporting the link is not considered strong enough, and should not be considered in further analysis.
3.1.3.1
Extraction of financial communities
Using the projected network, communities are extracted as near-k-step neighbourhoods. A
k-step neighbourhood is obtained by selecting a subject partyp0 (also referred to as the seed) and all parties having a distance of k or less from this seed (i.e. there is a path from the subject p0 to the candidate party p containing k or less edges). The subgraph induced by these parties is the k-step neighbourhood. We say near-k-step, as two additional constraints are applied beyond that imposed by the parameter k. These additional constraints further limit the parties and relationships included in the neighbourhood.
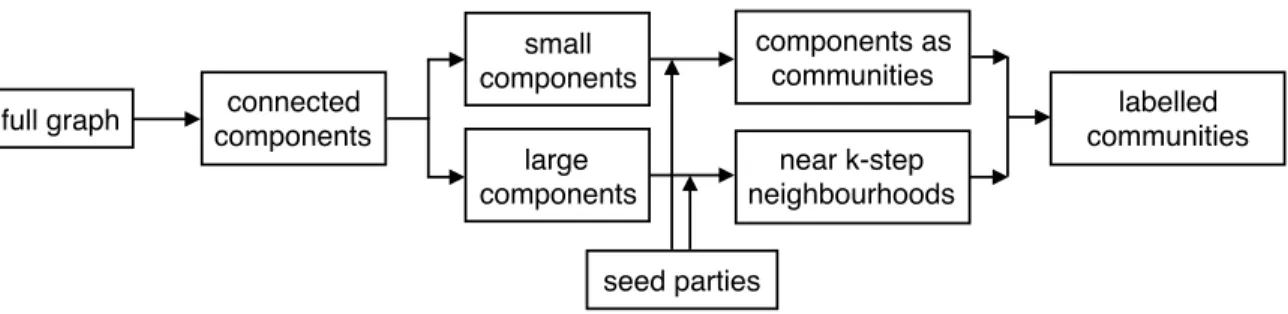
full graph connected components small components large components seed parties components as communities near k-step neighbourhoods labelled communities
Figure 3.3: Overview of community extraction process.
This allows us to remove low quality/confidence transactional links (for the purpose of financial community extraction).
The first constraint is controlled by a parameter,Nmax, which gives the maximum num-ber of transaction neighbours for a party (i.e. the maximum numnum-ber of parties that have conducted at least one transaction with the subject, note that this is not the degree of the corresponding vertex). Parties having a number of neighbours that exceeds this threshold are treated as gates. Unless linked to other parties within the k-step neighbourhood, the transaction neighbours of these parties are not included in the community. This allows low quality report based links to be removed prior to community extraction. For example, where many parties have transacted with a large retailer but are otherwise unrelated. The second constraint parameter, wmin, gives the minimum weight for supplementary edges to be in-cluded in the community. Note that each of these parameters may be specified as a vector of dimension k, so that constraints may vary with distance from the subject party. Figure 3.3 shows a schematic overview of the community detection process.
For the purposes of this thesis parameters were set tok = 3,Nmax = 40, andwmin = 0.01. These values were selected in consultation with domain experts. In particular, reasoning for taking k 3 stems from the fact that vast majority of transactions in the network are international transfers. By considering up to 3 steps, a seed party in the source country is obtained, along with associated parties in the destination country, additional parties in the source country transacting with these same associates, and finally, related parties in the
destination country. In other words, if k = 3 then parties in both the source and destination countries are obtained that are not directly associated, but are linked through a third party. As shown in Figure 3.3, extraction of communities is achieved by first splitting the net-work into discrete connected components. Those components that are below a threshold size (diameter 2k) are treated as communities, with no need to extract the near-k-step neighbourhoods. For those components having size greater than the specified threshold,
near-k-step neighbourhoods are extracted for any subject parties within the component (selection of subject parties is described in Section 3.2.2). This process is implemented using a parallel architecture, allowing millions of communities to be extracted in short period of time.
Treatment of communities as near-k-step neighbourhoods can introduce a significant de-gree of overlap between communities. From an intelligence standpoint, this is a useful char-acteristic of our approach, as it means the classifier is exposed to numerous views of the same underlying signal, placed within a di↵erent context. When assessing a new community, train-ing in this way will mean that the classifier is able to correctly identify suspicious activity even if it is only seeing a small portion of the relevant transactions. One drawback however, is that multiple overlapping communities may be classified as suspicious, and steps must be taken so that analysts are not presented with large numbers of highly similar networks.
For example, suppose that two transactions occur within a short time frame, and that these transactions involve parties whose distance from one another in the network is less than three. For each transaction, a community is extracted using the sending party as the seed. However, since the parties involved are less than three steps from each other, the resulting communities will overlap. If both of these communities are classified as suspicious then without intervention they would both be passed to an analyst (or to two di↵erent analysts) for further investigation. Clearly this situation is undesirable, thus a post-processing step may be employed, which evaluates the degree of overlap between communities deemed to be suspicious. For example, if the overlap is above a certain threshold, then the union of the communities could be taken, and this result could then be passed to an analyst.
category description
Demographic Aggregate features describing parties in the net-work (e.g. mean age)
Network Invariants describing the network structure (e.g. transitivity)
Transaction Aggregations over transactions included in the community (e.g. total cash amount)
Dynamic Features derived from time-series analysis (e.g. num. unusually high amounts)
Table 3.1: Feature categories.
3.2 Supervised learning applied to financial communities
This chapter describes the outcome of machine learning performed on a set of financial communities. The main purpose of this is to assess the viability of a monitoring system based on machine learning and the previously described network model.
3.2.1 Description of features
Machine learning was undertaken using a broad set of features derived from extracted commu-nities. Design of this feature set was guided by expert knowledge (AUSTRAC, unpublished data), and a broad survey of literature related to detection of illicit behaviour and to gen-eral network analysis. This feature set was designed to represent di↵erent aspects of the transaction network, with features divided into four main categories, as shown in Table 3.1. Calculation of dynamic features includes the use of burst analysis, which provides an indication of transaction regularity and is used to identify abnormal behaviour. A wavelet-based algorithm was used for this, which has previously been shown to outperform alternative algorithms in detecting both local and global bursts [187].
3.2.2 Evaluation
Evaluation of the system was performed using a subset of AUSTRAC’s financial transaction reports. Note that this evaluation only considers the performance of the proposed system. Comparisons with other systems designed to identify money laundering activity are not possible, since the details of such systems are not publicly available.
Supervised learning was undertaken using a support vector machine (SVM) and a random forest, as implemented in the R libraries e1071 and randomForest, respectively. For the SVM we considered a linear and polynomial kernel, using default values for the respective parameters. For the random forest we set the number of trees to one hundred and used default values for all other parameters.
Since the total number of communities that could be extracted from the transaction network is extremely large, training and evaluation was undertaken using a sample of the full set. This sampling, and the assignment of labels, was undertaken as follows.
For the labelled true positives, a set of parties was provided by AUSTRAC as examples of suspicious behaviour. The neighbours of these parties were then identified in the transaction network. The provided parties and their neighbours were treated as positive seeds. For the labelled true negatives, a uniform random sample (without replacement) was taken from the remaining parties. Near-k-neighbourhoods were then extracted for each of the positive and negative seeds. Resulting communities were then assigned the same label as their seed. Note that in certain situations, this process can result in duplicate communities, thus a post-processing step was employed to remove these duplicates.
To obtain a robust estimate of classifier performance, a method similar to k-fold cross validation was employed. In each of the k evaluations, the full set of positive labelled com-munities was combined this with a randomly sampled (without replacement) set from the negative communities. For each of thekiterations, the resulting set was randomly partitioned into training and evaluation sets, with 70% of the observations used for training and 30% used for evaluation. In each iteration the F-score was calculated using three values for the
num. parties frequency 0 50 100 150 200 0e+00 2e+04 4e+04 6e+04 8e+04 1e+05
Figure 3.4: Distribution of size for extracted communities.
weighting factor, 1 = 0.1, 2 = 0.5, 3 = 1. These values were selected as we are interested
in the ability of the classifier to achieve a high-precision. An ROC curve was also calculated in each iteration and a parameter ⌧ was determined from this curve giving the threshold value for classifier scores that maximised the F-score for a given value of . Precision and recall were then calculated for this value of ⌧. Mean performance in F-score, precision, recall and area under the ROC curve was then calculated across the k iterations.
3.2.2.1
Financial communities
After removing duplicates, a total of 758,271 communities were extracted from the network. Figure 3.4 shows the distribution of size (number of parties) for extracted communities. Additional statistics are provided in Table 3.2. As shown in Figure 3.4, the vast majority of extracted communities have more than 5 and less than 50 parties.
3.2.3 Classifier performance
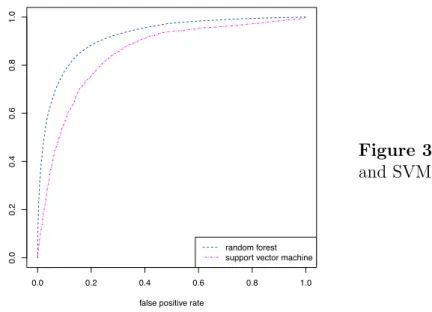
Table 3.3 gives the mean performance for a set of classifiers evaluated using the sampling process described in Section 3.2.2, taking k = 10. Example ROC curves are shown for a classifier of each model type. The results shown in Table 3.3 and Figure 3.5 indicate that
total positive 69,328 (all positive) total negative 688,943 (random sample) mean num. parties 33
mean num. supplementary rela-tionships
47 mean num. transactions 124 mean diameter 3.5
Table 3.2: Community statistics.
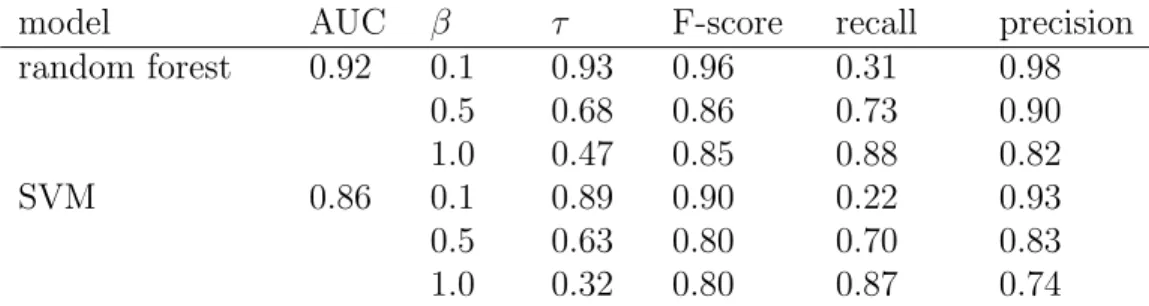
model AUC ⌧ F-score recall precision random forest 0.92 0.1 0.93 0.96 0.31 0.98 0.5 0.68 0.86 0.73 0.90 1.0 0.47 0.85 0.88 0.82 SVM 0.86 0.1 0.89 0.90 0.22 0.93 0.5 0.63 0.80 0.70 0.83 1.0 0.32 0.80 0.87 0.74
Table 3.3: Mean performance of random forest classifiers over ten samples. Each random forest consisted of 100 trees. Parameters and⌧ refer to the weighting used in the calculation of F-scores and threshold used for classification, respectively.
both the random forest and SVM classifiers are able to achieve a level of performance that is suitable for use in a live environment. The random forest gives slightly better performance. While the average recall of the classifiers is quite low, both models exhibit an extremely high precision. This means that a high classification threshold (⌧) can be selected, so that the classifier can operate with low rates of false positives. This is an important characteristic for real-world application of our system, as any communities classified as suspicious will be further investigated by human analysts. Since this is a time-consuming task, only minimal levels of false-negatives can be tolerated.
3.3 Summary
This chapter has described an automated system for detecting money laundering operations in transaction networks. This system advances the current state-of-the-art by analysing both explicit transaction relationships and implicit relationships derived from supplementary
in-false positive rate tr ue positiv e r ate 0.0 0.2 0.4 0.6 0.8 1.0 0.0 0.2 0.4 0.6 0.8 1.0 random forest support vector machine
Figure 3.5: ROC curve for random forest and SVM classifiers.
formation. The system extracts small, meaningful communities from this network in manner that allows existing business knowledge to be considered in the process. Supervised learning is then applied to these communities to obtain trained classifiers. Evaluation of the system shows that a suitable level of accuracy is achieved at high levels of precision. This is an important characteristic for our system, as use in a live environment necessitates a low rate of false positives.