Wayne State University Dissertations
January 2018
Validating Functional Mechanisms For Non-Coding Genetic
Validating Functional Mechanisms For Non-Coding Genetic
Variants Associated With Complex Traits
Variants Associated With Complex Traits
Cynthia Ann Kalita
Wayne State University, [email protected]
Follow this and additional works at: https://digitalcommons.wayne.edu/oa_dissertations
Part of the Genetics Commons, and the Molecular Biology Commons
Recommended Citation Recommended Citation
Kalita, Cynthia Ann, "Validating Functional Mechanisms For Non-Coding Genetic Variants Associated With Complex Traits" (2018). Wayne State University Dissertations. 2169.
https://digitalcommons.wayne.edu/oa_dissertations/2169
This Open Access Dissertation is brought to you for free and open access by DigitalCommons@WayneState. It has been accepted for inclusion in Wayne State University Dissertations by an authorized administrator of
by
CYNTHIA A. KALITA DISSERTATION
Submitted to the Graduate School, of Wayne State University,
Detroit, Michigan
in partial fulfillment of the requirements for the degree of
DOCTOR OF PHILOSOPHY
2018
MAJOR: MOLECULAR GENETICS AND GENOMICS Approved By: ———————————————————– Advisor Date ———————————————————– ———————————————————– ———————————————————– ———————————————————–
I would like to dedicate this to my family,
who have been nothing but supportive to me during this process.
I cannot thank Dr. Francesca Luca and Dr. Roger Pique-Regi enough for allowing me to pursue my Doctoral degree under their mentorship. Their guidance and enthusiasm for science kept me proceeding forward with my thesis even when obstacles occured. I am grateful to all members of the LucaPique group, especially past members Dr. Greg Moyerbrailean and Dr. Allison Richards who would let me brainstorm my project with them. In addition, I would like to thank Andrew Freiman and Camilla Cascardo for their help in the lab. I would also like to thank my committee members who gave me their valuable guidance and insight.
Dedication . . . ii
Acknowledgements . . . iii
Chapter 1 Introduction . . . 1
Chapter 2 Computational predictions and analysis of non-coding variants for allele-specific expression . . . 11
Introduction . . . 11
Methods . . . 15
Results . . . 26
Discussion . . . 38
Chapter 3 High throughput characterization of genetic effects on DNA:protein binding and gene transcription . . . 41
Introduction . . . 41
Methods . . . 43
Results . . . 45
Discussion . . . 55
Chapter 4 Rapid profiling of regulatory regions and variants to study GxE in complex traits . . . 58 Introduction . . . 58 Methods . . . 60 Results . . . 68 Discussion . . . 77 Chapter 5 Conclusion . . . 79 Appendix A . . . 82 iv
References . . . 123 Abstract . . . 144 Autobiographical Statement . . . 146
Table 1 Statistical methods for ASE and MPRA analysis. . . . 14
Table 2 Primers used in BiT-STARR-seq. . . . 64
Table 3 GEMMA per SNP heritability estimates relative to the genomic av-erage. . . . 70
Table 4 Number of identified factors/differential factors from ATAC-seq in LCLs. . . . 75
Table 5 Summary of GWAS meta analysis traits examined. . . . 84
Table 6 Factor binding sites enriched for GWAS SNPs. . . . 84
Table 7 SNPs associated with GWAS traits that fall in Centipede-predicted TF binding sites. . . . 84
Table 8 Reporter gene assay results. . . . 84
Table 9 Annotations Used. . . . 101
Table 10 QuASAR Results for LCLs. . . . 101
Table 11 QuASAR Results for HepG2. . . . 101
Table 12 Logistic Model predictions for LCLs. . . . 101
Table 13 Logistic Model predictions for HepG2. . . . 101
Table 14 BiT-STARR-seq results. . . . 113
Table 15 Annotations Used: CentiSNPs. . . . 113
Table 16 Annotations Used: GWAS. . . . 113
Table 17 Annotations Used: eQTL. . . . 113
Table 18 Distribution of ASE Z-scores. . . . 114
Table 19 Transcription factors in BiT-STARR-seq.. . . 114
Table 20 DEseq results: Combined concentrations. . . . 114
Table 21 DEseq results: Low concentration. . . . 114
Table 22 DEseq results: Mid. . . . 114
Table 24 BiT-BUNDLE-seq results. . . . 114
Table 25 Designed Regulatory Category Content. . . . 115
Table 26 Enrichment for ASB and ASE variants in TFs. . . . 115
Table 27 ASB and complex traits.. . . 115
Table 28 ASE and complex traits.. . . 115
Table 29 Designed Regulatory Category Content. . . . 115
Table 30 Primers used in BiT-STARR-seq. . . . 115
Table 31 Sequencing Depth. . . . 116
Figure 1 GWAS study outline and example hit. . . . 2
Figure 2 High-throughput regulatory assays. . . . 4
Figure 3 Integration of annotations into GWAS results. . . . 28
Figure 4 Reporter gene assay validation of allelic regulatory activity. . . . . 30
Figure 5 Comparing ASE testing methods in LCLs from Tewhey et al.(2016). 32 Figure 6 Comparing ASE testing methods in Ulirschet al. (2016). . . . 33
Figure 7 Exploring the performance across multiple simulated conditions. . 35
Figure 8 Validating experimental annotations in LCLs. . . . 36
Figure 9 Validating computational genomic annotations in LCLs. . . . 38
Figure 10 BiT-STARR-seq and BiT-BUNDLE-seq identify regulatory variants in non-coding regions. . . . 48
Figure 11 ASE for individual transcription factors. . . . 50
Figure 12 Allele-specific binding for NFKB1. . . . 52
Figure 13 Overlap with GWAS. . . . 54
Figure 14 Integration with GWAS. . . . 73
Figure 15 Differential hypersensitive ATAC-seq. . . . 74
Figure 16 ASE in treatments identified from BiT-STARR-seq. . . . 76
Figure 17 Enrichment for ASE in TF footprints matched by treatment. . . . . 77
Figure 18 Enrichment of transcription factors motifs from fgwas. . . . 85
Figure 19 Association plots identifying SNPs in footprints. . . . 86
Figure 20 Association plots identifying SNPs in footprints from fgwas. . . . . 87
Figure 21 Comparing ASE testing methods in HepG2 from Tewheyet al.(2016).103 Figure 22 Validating experimental annotations in HepG2. . . . 103
Figure 23 Validating computational genomic annotations in HepG2. . . . 103
Figure 25 Identifying cell type effects in in HepG2. . . . 104
Figure 26 Comparing QuASAR and QuASAR-MPRA ASE testing methods in LCLs. . . . 104
Figure 27 Schematic of oligos in BiT-STARR-seq and BiT-BUNDLE-seq. . . . 117
Figure 28 Correlation of DNA libraries. . . . 117
Figure 29 Correlation of RNA libraries. . . . 118
Figure 30 BiT-STARR-seq effect by regulatory category.. . . 119
Figure 31 DNase window centering of BiT-STARR-seq variants. . . . 119
Figure 32 DNase peak size of BiT-STARR-seq variants. . . . 120
Figure 33 Enrichment of NF-kB complex footprints in BiT-BUNDLE-seq bound regions. . . . 120
Figure 34 Overlap between constructs with significant ASB for each concen-tration in BiT-BUNDLE-seq. . . . 121
Figure 35 Overlap between constructs with significant ASB or ASE. . . . 121
Figure 36 Depletion of ASE with TFs that repress NFKB1 binding. . . . 122
CHAPTER 1 INTRODUCTION
GWAS and functional genomics: uncovering the molecular mechanisms behind asso-ciation
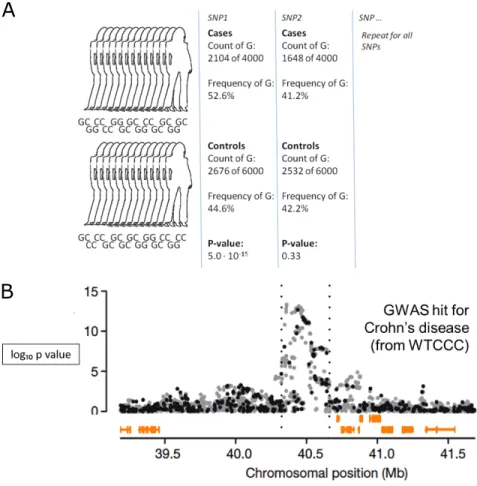
Genome wide association studies (GWAS) have identified thousands of common ge-netic variants associated with complex traits, including normal traits and common dis-eases. For these studies, case and control individuals are genotyped, then differences in allele frequency at each single nucleotide polymorphism (SNP) are quantified. SNPs are determined to be associated with the trait if the case allele frequency is significantly dif-ferent from that of the control group (Figure 1A). The end goal is to discover the genetic basis of complex traits in order to predict case conditions, for intervention, and for ther-apeutics. GWAS work by exploiting linkage disequilibrium (LD), with genotyping arrays sampling just enough SNPs to determine haplotype. These haplotypes are a result of histor-ical evolutionary forces such as population size, mutation, recombination rate, and natural selection.
Despite many successful findings, GWAS have failed to explain the majority of esti-mated heritability. Part of this problem comes from the fact that GWAS identify large regions of association and in general, cannot directly pinpoint the true causative variant. Statistical power is an additional challenge. In order for a variant to reach genome-wide significance, it depends on sample size, effect size of the causal variant, and frequency of the variant. Despite the challenges, array style studies remain the most common due to how affordable they are. Unobserved variant frequencies can typically be recovered through statistical imputation by using haplotype information, therefore increasing statis-tical power for the study.
A
B
Figure 1:GWAS study outline and example hit.Source: Wellcome Trust Case Control Consortium (June 2007). A) Overview of GWAS study design. B) GWAS hit for Crohn0s Disease.
The success and failure of GWAS have spurred multiple approaches to better model population structure, identify novel variants, estimate and partition genetic covariance, or infer causality. One of the largest challenges that faces GWAS is in determining the func-tional relevance of human DNA sequence variants (Ward and Kellis, 2012). An estimated 80% of the genome (Consortium, 2012), and an ever larger percentage ( 90%) of GWAS hits (Maurano et al., 2012), lie outside of protein coding regions. This makes it difficult to infer mechanisms linking individual genetic variants with the disease trait (Figure 1B). In addition, we do not know under which environmental conditions the sequence vari-ants have a functional impact, and whether they become one of many factors involved in complex phenotypes at the organismal level.
High-throughput assays to identify functional regulatory variants
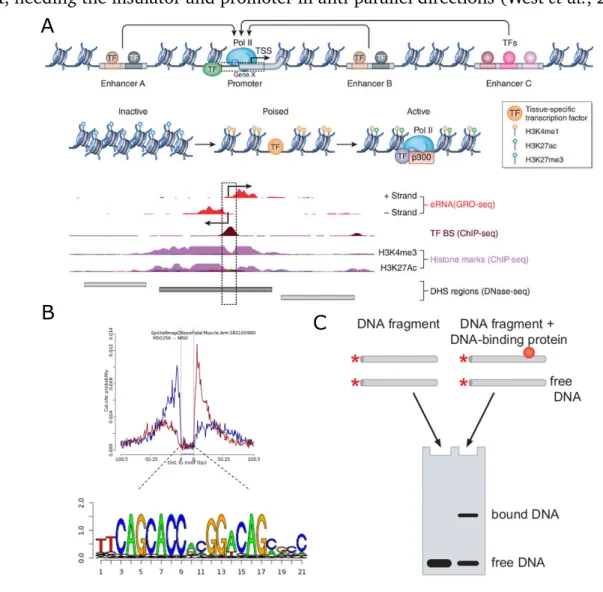
Non-coding regions in the genome are largely made up of regulatory elements, for which it can be difficult to predict the functional outcome of variants within these sites. Functional genomics data collected by ENCODE (http://genome.ucsc.edu/ENCODE/), Roadmap Epigenome (http://www.roadmapepigenomics.org/), and other groups (Viselet al., 2009) have provided large amounts of information on regulatory regions of the human genome (Figure 2A). Protein binding to DNA mainly controls gene regulation and these proteins require open chromatin to access the DNA. DNA accessibility assays (e.g., DNase-seq (Song and Crawford, 2010), FAIRE-seq (Simon et al., 2012) or ATAC-seq (Buenrostro et al., 2013)) are used to identify these regions. DNase-seq uses an enzyme, DNaseI to cut DNA, where it can0t cut heterochromatin or regions bound by a protein (protected areas). The DNA is sequenced, and regions of open chromatin show peaks of increased cuts. However, even with identifying accessible regions this fails to provide regulatory mechanisms.
Transcription factors (TFs) are important gene regulators and include both enhancers and repressors or insulators. Enhancers are short DNA regions of 20-400bp that can acti-vate promoters (Bondarenkoet al., 2003) to increase gene expression. They work by sta-bilizing DNA-protein complexes at the enhancer and target promoter before activation or forming loops to bring the enhancer and the promoter closer together, facilitating commu-nication between the enhancer and its target (Bondarenko et al., 2003; Ong and Corces, 2011; Krivega and Dean, 2012). Enhancers are well characterized as working position independent, and can target promoters both incisand intrans. In contrast, insulators typ-ically work by separating enhancers from the target promoter, creating separate domains.
Loop formation is the most common mechanism, and this is typically orientation depen-dent, needing the insulator and promoter in anti-parallel directions (Westet al., 2002).
A
B
C
Figure 2:High-throughput regulatory assays.Non-coding regulatory DNA in the human genome. Source: Elkon and Agami (2017). B) NRSF peak and motif from Centipede. Source: Moyerbraileanet al.(2016b). C) EMSA overview. Source: Gibiansky (2015).
Chromatin immunoprecipitation sequencing (ChIP-seq) assays can directly identify where TFs are binding genome-wide, where the DNA-bound protein is immunoprecipitated using a specific antibody. There are some drawbacks to this method. While this method does capture genome wide binding, it is only for a single TF at a time, making this method low throughput. This method also relies on the availability of high quality antibodies to the TF of interest. Also, recent studies have found that 50% of the binding sites found may have
no role in transcriptional regulation (Liet al., 2008; Fisher et al., 2012; Teytelman et al., 2013; Lizioet al., 2015). This may be due to non-specific binding of TFs to the DNA, which allows for transient binding for non-functional weak interactions (Shlyuevaet al., 2014).
Alternatively, binding events can be identified from DNase-seq data, which allows for identification of all potential TFs from a single assay. Centipede (Pique-Regiet al., 2011) is a program that detects these sites by integrating binding sites predicted by a motif model with genome wide DNase I footprinting data (from the ENCODE and Roadmap Epigenome projects). Transcription factors bind in regions where the chromatin is open and is more accessible to DNase I cleavage. To identify these sites, peak sites are analyzed for footprints of protection from DNase which is likely where the TF is binding. Looking at the DNA sequence at this position can provide the motif for the TF binding there (Figure 2B).
The availability of extensive functional annotations (Consortium, 2012; Pique-Regi
et al., 2011; Hoffmanet al., 2012) now enables the integration of functional genomic in-formation into eQTL and GWAS analysis, which can be useful to dissect the causal variant and the functional basis of the observed associations. SNPs that fall within a transcription factor binding site represent a major mechanism underlying gene expression quantitative trait loci (eQTL) and GWAS variants are also much more likely to be expression quanti-tative trait loci (eQTNs) than SNPs not associated with any complex trait. (Nicolae et al 2010; Zhong et al. 2010). Linking genomic annotations to eQTLs and GWAS SNPs goes beyond genetic association analysis, and helps gain a better understanding of the underly-ing biological processes. Some of these issues have been discussed by previous works. For example, (Gaffney 2012, Veyrieras 2008, Lee 2009, Lappalainen 2013) have examined the enrichment of selected genomic annotations in cis-eQTLs, and (Pickrell 2014; Price 2012)
have found enrichment for functional categories in GWAS hits. In addition to predicting causal SNPs associated with GWAS traits within regulatory regions, it is possible to predict the allele specific binding (ASB) effect of any SNP within a motif, but this does not predict whether binding enhances or represses gene expression.
High-throughput assays to identify functional regulatory variants
There are a few methods that have been used to experimentally test for ASB. The two most common are QTL mapping and allele specific analysis. For QTL studies, large panels of individuals are genotyped, and the genotype is then matched to a quantitative trait (ie. open chromatin (dsQTL), gene expression (eQTL)). For higher throughput, allele-specific analysis can be used, where in a single individual you see the difference in allele count within the reads. However, these require heterozygous sites and in-depth sequencing to analyze.
Electrophoretic mobility shift assay (EMSA) can can identify TF binding to any DNA sequence of interest. For this, the DNA sequence is combinedin-vitrowith the TF of interest and then run on a polyacrylamide gel. Where the protein binds, the complex travels more slowly through the gel, so the bound portion of DNA can be seen shifted upwards from the free or unbound DNA. The EMSA however, is more qualitative than quantitative, as well as being low throughput testing a single sequence at a time. This led to the development of the high throughput EMSA (Wong et al., 2011; Stormo et al., 2015; Levo et al., 2015), where a pool of sequences are combined with the TF of interest, the bound and unbound portions of the gel are cut out, DNA extracted and sequenced to get a quantitative measure of the binding events (Figure 2). While BUNDLE-seq compared binding and reporter gene expression, and EMSA has been previously used to ascertain allelic effects, none of the
high-throughput EMSA methods have been previously used to determine allelic effects on binding.
Identifying ASB is necessary for assigning mechanism to expression and phenotype outcomes. However, gene regulation is highly complex, so binding changes do not always lead to a predicted outcome. Instead, effect on expression can be measured, and the gold standard for this is the traditional reporter assay. For this, the enhancer region containing either allele is cloned into a plasmid containing a minimal promoter and reporter gene (typically luciferase). This gets transfected into cells, and readout (luminescence) is a measure of the enhancer strength. However this method is both time and cost intensive to test each construct one at a time. So in the last few years, high throughput methods were developed to test the expression of thousands of oligos at once. There are two main methods for this, the massively parallel reporter assay (MPRA) and self transcribing active regulatory sequencing (STARR-seq). For MPRA (Melnikov et al., 2012; Kwasnieski et al., 2012; Patwardhanet al., 2012; Sharonet al., 2012; Kwasnieski et al., 2014), a multitude of unique synthesized DNA oligos containing a barcode at the 30 UTR of a reporter plasmid are transfected into cells, and transcripts are isolated for RNA-seq. The number of barcode reads in the RNA over the number of barcode reads from the plasmid DNA is used as a quantitative measure of expression driven by the synthesized enhancer region. This method is fairly complex, requiring sequencing after cloning the enhancer/BC into the plasmid to match the sequences together and then another cloning and sequencing to place the reporter gene between the enhancer and BC. While the oligo being matched to multiple BCs helps with noise, it is imperfect since so many steps lie between the matching step and the final libraries. Studies have used this method to broadly characterize mutations within
enhancer and repressor regions (Melnikovet al., 2012; Kwasnieskiet al., 2014) and fine-map eQTLs (Tewheyet al., 2016) or GWAS (Ulirschet al., 2016).
STARR-seq (Arnoldet al., 2013) methods involve fragmenting the genome and cloning the fragments 30 of the reporter gene and sequencing the fragment directly instead of a BC proxy. The approach is based on the concept that enhancers can function independently of their relative positions and it0s designed with putative enhancers placed downstream of a minimal promoter, such that active enhancers transcribe themselves, with their strength quantified as the amount of RNA transcripts within the cell. Because they do not use separate barcodes, STARR-seq approaches have streamlined protocols that allow for higher throughput. However, due to the lack of barcoding, these studies tend to be noisy.
In the original study, the D. melanogaster genome was fragmented and transfected into S2 cells (Arnold et al., 2013). An additional study involved treating transfected S2 cells containing the STARR-seq library with ecdysone (Shlyueva et al., 2014) (a well-studied hormone in insects) as many enhancers are controlled by external stimuli (Hurtadoet al., 2011; Biddie et al., 2011; Hah et al., 2011, 2013; Shlyueva et al., 2014). A more recent adaptation to this method is Cap-STARR-seq (Vanhilleet al., 2015). This method targeted specific regulatory regions whereby DNA fragments were captured on a custom-designed microarray. These methods were created to identify and validate regulatory regions, with no consideration of regulatory variants. However, placing the variant in biological con-text, for example by identifying the transcription factor whose binding is disrupted, often improves our understanding of disease mechanisms and opens further avenues for thera-peutic intervention.
Analysis of the molecular function of non-coding variants across diverse risk envi-ronments
Aside from epidemiological studies, little attention has been paid so far in understand-ing how an individual0s genetic make-up interacts with his/her environmental exposures in defining disease risk. Accordingly, it is crucial to consider the role of genetic risk factors in the context of specific environments (e.g. vascular endothelium and stress for CVD-related traits). Little attention has focused on the analysis of how gene-environment interactions may affect an individual0s phenotype, because, in part, controlling for an individual0s life-time environment is difficult. Cowper-Sal-lari et al. 2012 (Cowper-Sal et al., 2012) used functional genomics data to functionally annotate GWAS hits for breast cancer variants, by using functional genomic assays in the context of in-vitro estrogen treatments. The success of this study resides in considering the specific environmental context (estrogen treatment) relevant for the complex trait analyzed (breast cancer). These findings further support the necessity of considering the molecular function of each genetic risk variant in the context of the cellular and the organismal environment.
While it is extremely difficult to control for environmental exposure in the context of GWAS studies, they can be modeled underin-vitrosettings with the cellular environment as a proxy for the organismal environment. This has been successfully done in eQTL studies looking at response to infection (Nédélec et al., 2016; Pacis et al., 2015) and drug treat-ment (Maranvilleet al., 2011; Mangraviteet al., 2013; Maranville et al., 2013), known as reQTLs. Looking at response to treatments with this method however is not viable on a large scale. Instead it is possible to use an allele-specific approach, where allelic effects are
modeled within a single individual at heterozygous sites. This method is also more con-trolled for confounding factors, giving it more power to detect conditional ASE (cASE) than is possible in reQTL studies, particularly in small sample sizes. For even more controlled conditions, exact sequences can be studied in the case of high throughput reporter as-says, as was done in S2 cells with ecdysone (a well-studied hormone in insects) (Shlyueva
et al., 2014) and A549 cells with dexamethasone (synthetic glucocorticoid) (Vockleyet al., 2016).
CHAPTER 2 Computational predictions and analysis of non-coding
variants for allele-specific expression
1Introduction
Genetic variants in non-coding regions are responsible for inter-individual differences in molecular and complex phenotypes. Quantitative trait loci (QTLs) for molecular and cellular phenotypes (Dermitzakis, 2012) have been crucial in providing stronger evidence and a better understanding of how genetic variants in regulatory sequences can affect gene expression levels (Stranger, 2007; Gibbs et al., 2010; Melzer et al., 2008; Cheung et al., 2003; Bremet al., 2002). However, eQTL studies have severe limitations in identifying the true causal variant, due to linkage disequilibrium (LD) limiting the resolution of analysis. The availability of extensive functional annotations (Consortium, 2012; Pique-Regiet al., 2011; Hoffmanet al., 2012; Moyerbraileanet al., 2016b) enables the integration of func-tional genomic information into eQTL analysis, which can be useful to dissect the causal variant and the functional basis of the observed associations (Gaffneyet al., 2012; Veyri-eraset al., 2008; Leeet al., 2009; Lappalainenet al., 2013; Kichaevet al., 2014; Wenet al., 2015; Pickrell, 2014). SNPs that fall within a transcription factor (TF) binding site (TFBS) represent a major mechanism underlying eQTLs (Degneret al., 2012). Recently, additional computational and experimental techniques have been developed to predict and detect al-lelic effects of SNPs in TFBS (CentiSNPs) using DNase I footprinting and ChIP-seq data (from the ENCODE and Roadmap Epigenome projects) (Moyerbrailean et al., 2016b; Lee
et al., 2015a; Mauranoet al., 2015; Zhou and Troyanskaya, 2015). Still, it is a challenge
1Parts of this chapter originally appeared as: Moyerbrailean, G. A., Kalita, C. A., Harvey, C. T., Wen, X.,
Luca, F., & Pique-Regi, R. (2016). Which Genetics Variants in DNase-Seq Footprints Are More Likely to Alter Binding? PLoS Genetics, 12(2), e1005875.
Kalita, C. A., Moyerbrailean, G. A., Brown, C., Wen, X., Luca, F., & Pique-Regi, R. (2018). QuASAR-MPRA: Accurate allele-specific analysis for massively parallel reporter assays. Bioinformatics, 34(5).
to further validate if allelic effects in binding translate to effects on gene transcription. Here we used the CentiSNPs annotation (variants predicted to affect TFBS) generated from previous work in done in the lab (Moyerbrailean et al., 2016b) in combination with a software called fgwas (Pickrell, 2014) to finemap variants associated with GWAS. The rich meta information provided by the tissue-specificity and the identity of the putative TF binding site being affected also helps in identifying the underlying mechanism supporting the association. While all these existing computational annotations are useful for predict-ing the causal SNP in an eQTL, they do not prove the SNP is truly causal, nor do they properly quantify its effect on gene expression. This can be validated experimentally using a traditional reporter assay, where the enhancer region is cloned into a plasmid containing a minimal promoter and reporter gene (ie. Luciferase. This gets transfected into cells, then the reporter signal is used as a correlate of the enhancer activity. Here we tested a subset (21) of the putatively causal GWAS hits identified using fgwas with the CentiSNP annotation for significant allele specific gene expression.
Traditional reporter assays, while the gold standard for the field, are both time and cost intensive. Instead, to dissect regulatory sequences and compare genetic effects on gene expression, different versions of high throughput reporter assays have emerged in the recent years. These include massively parallel reporter assays (MPRA) (Melnikovet al., 2012; Kwasnieski et al., 2012) and self transcribing active regulatory regions sequencing (STARR-seq) (Arnoldet al., 2013) that can simultaneously measure the regulatory function of thousands of constructs at once. MPRAs utilize a multitude of unique synthesized DNA oligos that are associated with barcodes, cloned in a reporter plasmid and transfected into cells. The transcripts are then isolated for RNA-seq. The number of barcode reads in the
RNA over the number of barcode reads from the plasmid DNA is used as a quantitative measure of expression driven by the synthetic enhancer region (Melnikov et al., 2012; Kwasnieski et al., 2012; Patwardhan et al., 2012; Sharon et al., 2012; Kwasnieski et al., 2014). MPRA and STARR-seq were originally developed to identify and validate regulatory regions, but they can also be used to compare allelic effects of genetic polymorphisms or methylation (Lea et al., 2017). Recent studies used this technique to compare allelic variants of SNPs with the aim to dissect, at a large scale, the causal nucleotide in eQTL and Genome Wide Association Study (GWAS) signals. Specifically, Vockley et al. (2015) used a STARR-seq derived method (POP-STARR-seq) to measure allelic effects on gene expression for population based variation in 104 regulatory regions, and a more recent study by Tewhey et al. (2016) adapted MPRA to fine-map variants associated with gene expression in lymphoblastoid cell lines (LCLs) and HepG2.
The application of MPRA to quantify the allelic effects of regulatory variants is very similar to the challenge posed by allele-specific expression (ASE) in RNA-seq data. How-ever, one key difference is that the proportion of plasmids for each allelic construct may not be in a 1:1 ratio. Few off-the-shelf statistical methods have been used for processing and analyzing these large MPRA datasets (Table 1), but they do not consider several tech-nical issues that can lead to false positives, such as base-calling error and over-dispersion. As demonstrated in RNA-seq ASE approaches, a binomial distribution fails to account for overdispersion and results in overly optimisticp-values, while a beta-binomial distribution is a more adequate choice (Kumasaka et al., 2016; van de Geijn et al., 2015). Compared to RNA-seq ASE methods that combine all reads across haplotypes, in MPRA we do not need to accommodate for the uncertainty in phasing or haplotyping as the complete
se-Table 1:Statistical methods for ASE and MPRA analysis.
Type of test
Conditions T Fisher Bin β-bin QuASAR
Previously used in MPRA X X
Previously used for ASE X X X
Requires normally distributed data X
Underestimates the effect of biological variability X X X
Handles overdispersion X X
Accounts for base calling error X
quence of each construct is known. By design we can also avoid oligonucleotides that could lead to ambiguous mapping. This is in stark contrast to using the entire human genome/transcriptome, which typically requires extensive pre-processing. This is because many genomes contain large number of repetitive and quasi-repetitive regions that are only one SNP or base-calling error away from many other paralogous regions. Here we further extend QuASAR (Harvey et al., 2014), an approach which considers both over-dispersion and base-calling errors, to test for allelic imbalance in MPRA constructs when the default proportions are not equal. The new method allows for estimates of the dis-persion parameter depending on variant-specific read coverage, and produces summary statistics that are easy to incorporate in downstream analyses.
Here we tested our new method on MPRA data from Tewheyet al.(2016) and we fur-ther confirmed the robustness of our method on anofur-ther dataset from Ulirschet al.(2016). First we compared our new QuASAR-MPRA statistical test to other tests employed in MPRA and ASE analyses (Table 1). We then demonstrate that the QuASAR-MPRA test better cali-brates thep-values under the null hypothesis, without sacrificing statistical power. Finally, we used the allelic effects identified by QuASAR-MPRA to investigate whether the genetic variants that fall within genomic annotations, such as TF binding motifs, are good predic-tors for allele-specific regulatory function. Our study shows the potential value of using
robust allele-specific analysis in high throughput reporter assays, to improve fine mapping analysis of association signals and validate genomic annotations of regulatory variants.
Methods
Integrating high-resolution functional annotations with GWAS and fine-mapping
To integrate functional annotations and GWAS results, we used the fgwas command line tool (Pickrell, 2014). fgwas computes association statistics genome wide using all common SNPs from European populations in the 1KG Project, splitting the genome into blocks larger than LD. Summary statistics were imputed with ImpG using Z-scores from meta-analysis data. Using an empirical Bayesian framework implemented in the fgwas software, GWAS data were then combined with functional annotations. We then com-pared the informativeness of these annotations from each of the 1891 motifs with Cen-tipede predicted regulatory sites to a baseline model (see section: Adding annotations to SNPs associated with complex traits in Appendix A) consisting of previously used genomic annotations identified as relevant (Pickrell, 2014). For each locus that contains at least one SNP with a PPA>0.2, we only consider the SNP with the highestp-value or PPA from fgwas. Rather than look at a credible set, we pick a single SNP most likely to be causal and see if that SNP has a higher PPA with the annotation than without it. While reduction in size of the credible set is very important for assessing fine-mapping methodologies, here our focus is on combining annotations to identify the single most likely causal SNP per GWAS locus.
Validation of GWAS-relevant effect-SNPs
GWAS-relevant effect-SNPs located in active footprints in LCLs (the cell line used for transfection) were ranked on the Spearman correlation coefficient in Moyerbraileanet al.
(2016a). We initially selected the top 25 SNPs with a positive correlation, but the as-says for 4 of them failed for several technical reasons (e.g., cloning step failed). To test allele-specific effects on expression for the remaining 21 SNPs, we first constructed inserts containing the reference or alternate allele for each SNP of interest (see section: Validating putative causal SNPs by reporter gene assays in Appendix A). Cloning of these inserts in the pGL4.23 vector was performed using the Infusion Cloning HD kit (Clontech) and DNA was extracted using the PureYield kit (Promega). Transfections were performed into GM18507 using the standard protocol for the Nucleofector electroporation (Lonza). Luciferase activ-ity was measured for up to 20 replicate experiments using the Dual-Glo Luciferase Assay Kit (Promega). We contrasted the activity of each construct to the pGL4.23 vector, to assess enhancer/repressor activity of each region. To evaluate allele-specific effects, we contrasted the activity of the reference allele to the alternate allele for each region and we used a t-test to assess significance at a p < 0.05 threshold. We used the Benjamini-Hochberg (Benjamini and Benjamini-Hochberg, 1995) procedure to assess FDR across all 21 SNPs tested.
Data source and pre-processing
We downloaded processed read counts from GEO (GSE75661) ftp://ftp.ncbi.nlm.
nih.gov/geo/series/GSE75nnn/GSE75661/suppl/GSE75661_79k_collapsed_counts.txt. gz (Tewhey et al., 2016). This MPRA study was designed to look at ASE in 39,479 oligo
pairs representing 3,642 eQTLs from the GEUVADIS RNA-seq dataset of lymphoblastoid cell lines (LCLs) from European and African individuals (Lappalainenet al., 2013). It has a large number of experimental replicates (8 LCL replicates), and makes use of barcodes (an average of 73 unique barcodes per oligo per replicate) to remove PCR duplicates, making this an ideal dataset to work with. We considered separately sequences in the for-ward and reverse strand direction in the library, as direction of the regulatory region could potentially affect reporter gene and therefore barcode expression. Tewhey et al. (2016) found that filtering the data to remove variants with low coverage greatly reduced the variability between replicates. Higher variance could then lead to falsely identifying ASE. We therefore began processing the dataset by applying a counts filter. For each direction we removed all cases with less than five reads on the reference and alternate allele, and where the sum of two alleles was ≤ 100. This gave us a total of 33,664 SNPs in the DNA library as input to the RNA library.
For the RNA library, we first separated the library into forward and reverse directions, and then required that RNA constructs were in the DNA library. We used a counts filter of 5 for both reference and alternate alleles so that we were only looking at variants that had sufficient reads covering both alleles to test for allele-specific effects on expression. This left us with 19,287 SNPs in the forward library and 19,748 SNPs in the reverse library or 33,653 SNPs total represented.
We additionally applied the QuASAR-MPRA method to a separate dataset by Ulirsch
et al.(2016). We downloaded processed read counts fromhttp://www.bloodgenes.org/ RBC_MPRA/. This dataset comprised of 2,756 variants in strong linkage disequilibrium with 75 sentinel variants associated with red blood cell traits, with reference and alternate
alle-les represented in the pool of constructs. Each variant has 3 sliding windows of coverage, which we treated as separate constructs (rather than combining counts per variant). This dataset comprised of 2 DNA and 6 RNA replicates (from K562 cells). The data was pro-cessed using the same steps as with the Tewheyet al.(2016) data, resulting in 2,669 SNPs in total.
Baseline statistical methods for comparison
To test for ASE there are several different methods available (Table 1). The t-test, Fisher0s exact test and binomial test are classical tests remarkably appealing due to their simplicity. However, they have several limitations, as they cannot be tuned to the context of the experiment, such as levels of overdispersion (eg. from biological and technical variability) which are known to exist in ASE data (Castel et al., 2015; Skellyet al., 2011; Anders et al., 2010). A paired Student0s t-test for ASE can be used to test whether the mean expression of the reference allele is equal to the mean expression of the alternate allele. This test requires multiple replicates in order to calculate a mean for each allelic expression group that has little variance, otherwise the test will not have the power to detect differences. Fisher0s exact test has been used previously to identify ASE (Romanel
et al., 2015), by testing whether the reference and alternate allele counts0 proportions are the same. Rejection of the null hypothesis, however, only informs us that the difference between the average counts in the two samples is larger than one would expect between technical replicates. In the binomial test, the null hypothesis is that observed values for two categories do not deviate from the theoretically expected distribution of observations. In ASE, the binomial test is used to determine whether the ratio of the two alleles is significantly different from the expected proportion (e.g. 0.5). This is the classic test that
has been employed previously to detect ASE in RNA-seq studies, and assumes that read counts within each gene are binomially distributed (Kilpinenet al., 2013; Consortiumet al., 2015; Lappalainen et al., 2013; Builet al., 2014). Even accounting for reference mapping bias in RNA-seq reads, p-values have been found to remain inflated (Castel et al., 2015). Other methods handling ASE such as WASP, RASQUAL, EAGLE (Kumasaka et al., 2016; van de Geijn et al., 2014; Knowles et al., 2017) use a per SNP overdispersion parameter and give well calibratedp-values. However these methods perform ASE QTL mapping and their application to MPRA would require a large number of replicates (>15).
To reproduce the Student0st-test performed by Tewheyet al.(2016), we calculated the
log2 ratio for the reference and alternate allele constructs (RNA/DNA) for each replicate. These values were used as input for a pairedt-test in R. To perform the Fisher0s exact test on the MPRA counts data, we first added a pseudocount of 1 (Vockley et al., 2015) to each RNA and DNA reference and alternate allele counts and then used the fisher.test function in R. To perform the binomial test on the MPRA counts data, we compared the reference and alternate allele counts to the DNA proportion (reference allele/ reference allele + alternate allele). To combine the p-values for the two LCL individuals, we used Fisher0s method (Tewheyet al., 2016).
QuASAR Approach
QuASAR by default assumes that under the null hypothesis of no allelic imbalance the reference and alternate allele read counts should be at 1:1 ratio. However, in MPRA, the proportionrl of the reference reads is not necessarily 0.5across all the l genetic variants,
due to differences in PCR amplification, as well as cloning and transformation efficiencies. Here, we have extended QuASAR to test for differences between the proportion of
refer-ence reads in DNA rl and the proportion obtained from RNA reads ρl. To reject the null
hypothesisρl =rl, we extend QuASAR0s beta-binomial model. The observed reference Rl
and alternateAl allele read counts at a givenl are modeled as:
Pr (Rl|Nl, ψl, Mb) = Nl Rl Γ (Mb) Γ (Rl+ψlMb) Γ (Al+ (1−ψl)Mb) Γ (Nl+Mb) Γ (ψlMb) Γ ((1−ψl)Mb) (0.1) ψl= [ρl(1−) + (1−ρl)] (0.2)
where Nl = Rl+Al is the total read count at l, and Mb is the concentration parameter
that controls over-dispersion of the mean proportion centered around ψl, which also
in-corporates in the model a base-calling error and the allelic ratio ρl overall-mean. We
can estimate using an EM procedure (Harvey et al., 2014), but here for MPRA we fixed
ˆ
= 0.001 as a conservative estimate of the true base-calling error rate.
We have found previously for ASE that overdispersion decreases with greater depth of coverage (Figure S9 in Moyerbraileanet al.(2016a)). Therefore here, as compared to our previous implementation of QuASAR, we use different Mb parameters depending on the
sequencing depthNl. We binNlinto different quantiles (here deciles) and we estimateMb
for each bin separately using a grid search:
ˆ Mb = arg max Mb L Y l=1 Pr (Rl|Nl,ˆ, ρl=rl, Mb) ! (0.3)
This should work well when the number of sites (i.e., SNPs tested) is relatively large so each bin b has > 200 observations to estimate Mb. In our experience sequencing depth
is a major determinant for M, and because we estimate M under the null, we tend to be conservative (i.e., M is the worst case scenario for all the constructs that belong to the same group). As a consequence, the QuASAR-MPRA p-values remain well calibrated (or in the worst case scenario they will tend to be slightly conservative).
We estimate ρˆl using (0.1) with Mb = ˆMb from (0.3) and a standard gradient method
(L-BFGS-B) to maximize the log-likelihood function:
l(ρl; ˆMb,ˆ) = log Pr
Rl|Nl, ψl =ψ(ρl,ˆs),Mˆb
(0.4)
Finally, all parameters are used to calculate the LRT statistic, contrasting H1 : ρl = ˆρl to
H0 :ρl=rland the resultingp-value.
For comparison, we performed the original QuASAR analysis on the data as well, as described in Harveyet al.(2014).
QuASAR meta-analysis
Using the QuASAR approach, we can generate summary statistics of the allelic imbal-ance that can be used for downstream analyses. For example, to compare DNA to RNA, or between RNA of different cell-types, or to perform meta-analysis of multiple MPRA li-braries. Instead of using an estimate of the allelic proportionρl, in the QuASAR approach
we report the estimate of βl = log(ρl/(1−ρl)) and its standard errorσˆl using the second
derivative (i.e. Hessian) of the log-likelihood function in (0.4). We prefer the logistic transformed parameter βl as it provides a more robust fit and the second derivative is
better behaved than that ofρlon the edges.
for the two LCL individuals using standard fixed effects meta-analysis. The effect sizeβl,n
of each replicate n is weighted by wn,l = 1/σˆn,l2 , to calculate the overall effect size and
standard error: βl∗ = 1 w∗ l X n βn,lwn,l σ∗l = q 1/wl∗ (0.5) where wl∗ =P
nwn, l. We can then calculate theZ-score andp-value to test for an overall
change between all the RNA replicates combined with respect to the original DNA propor-tionβ0: Zl = βl∗−β0 σ∗ l , β0 = log rl 1−rl , p= 2Φ(−|Zl|) (0.6)
Across all the paper, p-values were corrected for multiple testing using the Benjamini-Hochberg0s (BH) method (Benjamini and Hochberg, 1995). To compare the different ap-proaches we quantified the genomic inflation parameter, λ, for a set of p-values (Yang
et al., 2011). For this we calculated the ratio of the median of the p-value distribution to the expected median, thus quantifying the extent of the bulk inflation and the excess false positive rate. We also use a rank sum paired test to assess statistical significance in the
p-value inflation between QuASAR-MPRA and other methods with similar performance.
Simulations
To simulate MPRA data we randomly sampled from a beta-binomial distribution with parameters set to approximate the real data in Tewhey et al.(2016). The advantage of a simulation is that we have full knowledge of which SNPs are truly imbalanced and we can
empirically calculate statistical power (i.e, sensitivity) and FDR under specific assumptions. The true underlying distribution may not exactly be beta-binomial but simulations are still very useful to know how the test performs and compares to other tests. We started by simulating the DNA reads and proportions for each SNP using a beta-binomial. For this we used the DNA proportion from the Tewheyet al.(2016) data as the expected proportionρl
and we set the concentration parameterM to be 200, and the total number of DNA reads
N = 10,000.
θl∼Beta(ρlM,(1−ρl)M)) RDNAl ∼Bin(N, θl) (0.7)
After we simulated the DNA countsRDNA, we recalculated the new DNA proportions r∗l =
Rl∗/N. The exact value of the parameters used to generate the DNA counts are not very important and should have no effect for the simulation as the differences are captured on the RNA data once the DNA proportion is specified.
To simulate the RNA data we need to simulate two conditions: 1) SNPs without ASE and the same proportion as in DNA, and 2) SNPs with ASE and a different allelic pro-portion than those in DNA. To do this, we explored different parameter settings for the concentration parameter M (10, 60 and 100), effect size∆β (0.5, 1.0 and 2.0) and num-ber of RNA replicates (2, 5 and 8). The numnum-ber of reads Nl observed for each SNP was
set up to match the average NA12878 RNA counts for each SNP (so multiple coverages are being simulated) and we divided these by a constant factor to simulate sequencing depths (1/2,1/5 and 1/10) lower than those obtained by Tewheyet al.(2016). Each RNA
replicate was simulated with the same parameter setting. ρ∗l = logit(logit−1(rl∗) + ∆β) (0.8) θl∼Beta(ρ∗lM,(1−ρ ∗ l)M)) R RN A l ∼Bin(Nl, θl) (0.9)
To sample from Beta and Bin, we used the rbeta and rbinom in R respectively. The pro-portion of SNPs with RNA counts with∆β 6= 0and simulated to have an allelic imbalance is 0.1% of the total SNPs. For each simulated data set we then ran thet-test and QuASAR and adjusted the p-values for multiple testing using the same BH procedure as in the real data. For each FDR control threshold we empirically calculated power (Sensitivity) and false discovery rate (eFDR). To ensure that we get robust sensitivity and FDR estimates we repeated the entire procedure 20 times and reported the average.
Annotation Overlap
Table 9 in Appendix A reports the annotations we have considered with their sources. More specifically, we considered two major sets of annotations: experimentally and com-putationally derived. The experimental annotations include allele-specific hypersensitivity (ASH) from (Moyerbraileanet al., 2016b), dsQTLs (Degneret al., 2012), and GTEx eQTLs (Consortiumet al., 2015).
In terms of computational annotations, a variety of different methods have been used recently to predict the allelic effect of SNP on TF binding and chromatin accessibility. GKM-svm (Leeet al., 2015a) uses gapped k-mer frequencies to predict the activity of larger func-tional genomic sequence elements, including the impact of a variant on DNase I sensitiv-ity. It utilizes support vector machinery based on the structural risk minimization principle
from statistical learning theory and kernel function which calculates the similarity between any two sequences. CATO (Mauranoet al., 2015) quantifies the effect of SNPs on the en-ergy of TF binding, through overlapping SNP DHS profiles with TF motifs and applying a logistic model which takes into account site dependent features and phylogenetic conser-vation. DeepSEA (Zhou and Troyanskaya, 2015) uses TF binding, DHS, and histone-mark profiles with genomic sequence information as input for training a deep learning-based al-gorithm and predict the effects that sequence alterations have on the chromatin. DeepSEA has three major features: integrating sequence information from a wide sequence con-text, learning sequence code at multiple spatial scales with a hierarchical architecture, and multitask joint learning of diverse chromatin factors sharing predictive features. Finally we also used CentiSNPs, an annotation that we recently developed (Moyerbrailean et al., 2016b) that uses the Centipede framework (Pique-Regi et al., 2011) to integrate DNase-seq footprints with a recalibrated position weight matrix (PWM) model for the DNase-sequence to predict the functional impact of SNPs in footprints. In CentiSNPs, SNPs in footprints “footprint-SNPs”are further categorized using Centipede hierarchical prior for each allele as “effect-SNP00 if the prior relative odds for binding are > 20 or as “Non-effect-SNPs00 otherwise.
For the other computational annotations we set the following thresholds. To run GKM-svm (Lee et al., 2015a), we extracted sequences around MPRA variants (19bp total) and then ran the reference vs alternate allele sequences with either the GM12878 or HepG2 weights. We then used a threshold of <−6or>6for the variant scores. DeepSEA (Zhou and Troyanskaya, 2015) variant scores were identified using the website tool with a vcf file input (containing the MPRA variants). The functional significance predictions have a
threshold of < 0.05. We overlapped SNPs from MPRA counts data with each annotation type. To identify particular annotations that predict the ASE found in the MPRA, we built logistic modelslog(pl/(1−pl)) = β0+β1×alusing the QuASARp-values (p <0.001) as the
observed binary outcome, and the genomic annotationsalas the predictor. For this type of
analysis we use the nominalp-value (p <0.001), as we test for an enrichment with respect to what would be expected from the null uniform distribution (0.1% of the tests). This nominal p-value corresponds to a FDR threshold of 7.2% for FDR (enrichments are not sensitive to variations of this threshold). A significantp-value from the annotation logistic model together with the QQ-plot are useful to evaluate which annotations work best in predicting changes in gene regulation.
Results
Functional regulatory variants help identify and interpret causal GWAS hits
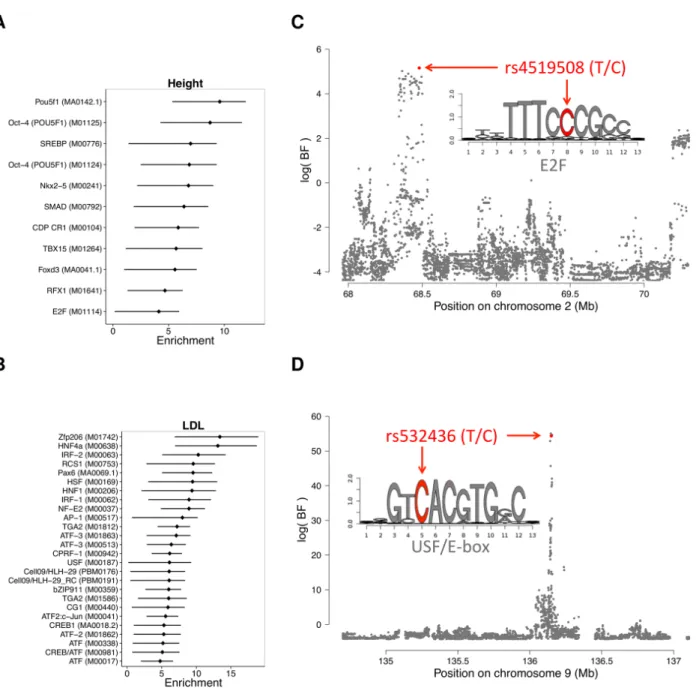
To better test if the annotated CentiSNPs can help fine-mapping and give a mechanistic support for variants associated with complex traits, we integrated them into GWAS meta analyses for 18 traits (seeSummary of GWAS meta analysis traits examined.) using the recently developed hierarchical model fgwas (Pickrell, 2014). Importantly, in this analy-sis we used as input the association p-values measured or imputed to all known common variants in the genome. Furthermore, for each trait we compare to a baseline model (Pick-rell, 2014) that considers previously defined annotations (Mauranoet al., 2012; Thurman
et al., 2012) and confounders (e.g., distance to TSS, coding region, and others). For each trait, we identified factors whose binding sites were enriched for associated SNPs (Figure 3A & B, 18 and Table 6) over the baseline model (the enrichments reported by fgwas are
log-odds ratios from the model parameters).
Overall, we observed high enrichments for biologically relevant factors. For example, the enrichment for CentiSNPs in OCT-4 (POU5F1, a TF with a key role in embryonic de-velopment and stem cell pluripotency (Nichols et al., 1998)) regulatory sequences when considering genetic variants associated with human height is 6.6-fold higher (95%CI: 3.7-8.2) than in the baseline model. This is consistent with previous observations of genetic variants associated with height being enriched in embryonic stem cell DHS sites (Trynka
et al., 2015). We also observed an enrichment for the developmental regulators TBX15 (3.9x), FOXD3 (3.9x), and NKX2-5 (4.7x) for genetic variants associated with height. From a study of low-density lipoprotein (LDL) levels in the blood, enriched factors include the liver-specific factor HNF4A (9.1x), as well as several regulators of immune function, including CREB1 (3.7x), IRF1 (6.2x), and IRF2 (7.1x).
Figure 3:Integration of annotations into GWAS results.(A & B) Enrichment (log2(change in prior odds w.r.t the baseline model)) of
factors for association with (A) height and (B) low-density lipoprotein levels. Error bars are drawn for 95% confidence intervals. (C & D) Association plots showing the Bayes factor of each SNP in the displayed region for (C) height and (D) low-density lipoprotein levels. Shown in red are SNPs with a posterior probability of association>0.4.
Our high resolution annotations allowed us to dissect the most likely functional variant (posterior probability of association, PPA>0.2) in 88 previously identified GWAS regions (Table 7, Figure 20). For all 88 but 2 of these SNPs we have at least a 2-fold increase on the posterior odds of picking the potentially causal genetic variant according to fgwas (8.5x median fold increase) when compared to the comprehensive baseline annotation
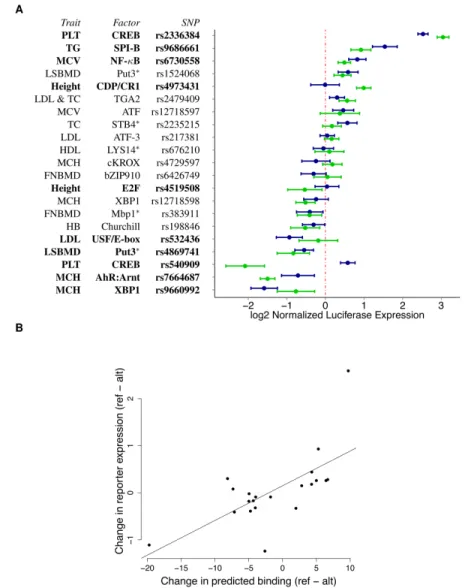
used by (Pickrell, 2014). We then performed reporter gene assays for 21 SNPs to validate the predicted allelic effect on gene expression and the underlying molecular mechanism (Figure 4 A & B, Table 8, Methods). Among the regions tested we validated that 11 have enhancer/repressor activity and 10 have variants with allele-specific activity (p < 0.05, BH-FDR=10%). This corresponds to 48% validation rate which is much greater than the 5% that would be expected by chance (Binomial test p = 2.01×10⁻⁸). Overall the
pre-dicted effect on binding and the change in gene expression are well correlated (Spearman
ρ=0.612,p-value=0.0032), and the three SNPs with opposite effects may represent bind-ing sites for repressors. Spearman correlation is robust to outliers, removbind-ing potential outlier rs540909 results inρ=0.657 (p-value = 0.002).
As an example, rs4519508, associated with a 2.1cm decrease in height (Lango Allen
et al., 2010), is in a binding site for the cell-cycle regulator family E2F (Figure 3D). Our annotation increased the PPA from a baseline of 10.5% to 44.4%, and it is the highest associated SNP in the association block (Figure 19A). This E2F footprint is active in>300 tissues (most of them fetal) and we detected ASH at this SNP in lung fibroblasts, validating that the reference allele at rs4519508 confers stronger binding than the alternate. Inter-estingly, in the reporter assay we observed 1.5-fold increased expression in the presence of the alternate allele, suggesting that at this location, E2F is acting as a repressor. Finally, this SNP is located within the promoter of PPP3R1, a regulatory subunit of calcineurin important for cardiac and skeletal muscle phenotypes; and a SNP in the same region has been shown to be associated with endurance (He et al., 2010) in humans. The p-value of association for this GWAS locus (p = 8.1×10⁻⁶) does not reach genome-wide
a recent more extensive meta-analysis for height (Wood et al., 2014) this locus achieves genome-wide significancep= 8.4×10⁻¹⁰, demonstrating that our annotation can be useful to rescue relevant loci.
Figure 4: Reporter gene assay validation of allelic regulatory activity. (A) Average luciferase expression level for the constructs containing the reference (blue) and alternate (green) allele, normalized to the empty vector. SNPs with significant allele-specific effect on gene expression are listed in bold.∗denotes human orthologs. (B) Change in predicted binding (prior log ratio from the sequence
model, x-axis) versus normalized expression experimentally measured in the reporter assays (y-axis). The black line represents the best-fit line from a linear model fit on all points.
Finally, a SNP associated with LDL levels, rs532436, is within a footprint for USF, an E-box motif (Figure 3C). Adding our annotation increased the PPA of the SNP from 39.7% to 94.7% (Figure 19B). We found that the alternate allele, associated with a 0.0785 mg/dL increase of LDL in the blood, is predicted to have a lower binding probability and results
in 1.8-fold lower expression, compared to the reference allele. This SNP is identified by GTEx (Consortium et al., 2015) as an eQTL for two proximal genes in whole blood: ABO (p = 5×10⁻⁵) and SLC2A6 (GLUT6, a class III glucose transport protein; p = 8×10⁻⁵).
The SNP has an opposite effect on expression of the two genes, with the alternate allele showing lower expression for ABO and higher expression for SLC2A6.
These results show that our integrated analysis provides support for likely mechanisms linking regulatory sequence changes to complex organismal phenotypes. Furthermore, these mechanisms can be directly investigated through molecular studies, providing addi-tional support that these sequence changes are truly funcaddi-tional.
Applying QuASAR-MPRA to identify ASE
We used the method proposed here, QuASAR-MPRA, to detect ASE in the MPRA data collected by (Tewhey et al., 2016). In MPRA, ASE is defined as the departure in the RNA reads from the DNA proportion (the input allelic ratio). Because strand orientation may affect the enhancer function of the sequences tested, each SNP was tested for ASE in the two strand orientations separately (forward/reverse). The two LCL biological replicates were combined using meta-analysis (see Methods). The number of SNPs with significant ASE (10% FDR) were 309 (forward) and 293 (reverse) in LCLs (Table 10 and Figure 5), 85 (forward) and 84 (reverse) in HepG2 (Table 11 and Figure 21). We then compared these results to those obtained using other methods previously used for MPRA/ASE analysis using the same input file with the same pre-processing filters (see Methods).
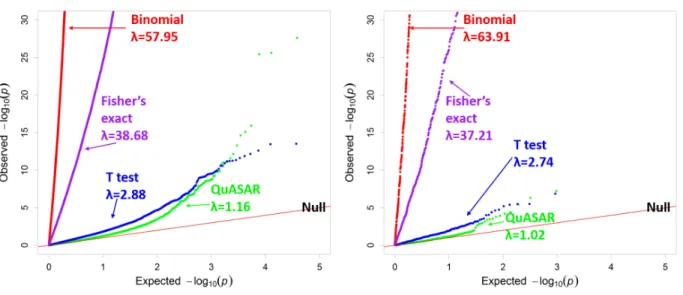
Figure 5: Comparing ASE testing methods in LCLs from Tewheyet al.(2016). QQplot depicting thep-value distributions from testing for ASE using four different methods in LCLs with all SNPs (Left) or SNPs predicted to not have any regulatory effect (non-effect SNPs, Right).λmeasures genomic inflation deviation from the uniform.
While some of the other methods seem to identify a larger number of SNPs with sig-nificant ASE, the distribution of p-values (Figure 5) shows that those methods have very skewed distributions. The majority of genetic variants tested are expected to have no im-pact and only those that were the truly causal eQTL SNP should have a significantp-value. We do not know a priori which variants have ASE, but in Figure 5 we would expect that the majority of p-values would follow the expected uniform distribution if the approach correctly models the data under the null hypothesis. In other words, only a fraction of MPRA constructs are expected to have significant allelic effects. To better quantify the departure from the expected distribution of p-values for each testing method we used the genomic inflation method. In this method, a greater departure from a lambda value of 1 corresponds to greater inflation in the test results (see Appendix A for reverse oligo results). Based on the genomic inflation value λ, QuASAR-MPRA results in the lowest inflation, with λ = 1.161. A paired t-test with independent estimation of variance and Welch0s adjustment, as in (Tewhey et al., 2016), results in a moderately but significantly
larger λ = 2.89(p < 2.2×10⁻¹⁶). The binomial test produces the greatest inflation, with
λ= 57.95, followed by Fisher0s exact test, as in (Vockleyet al., 2015) resulting inλ= 38.68. The methods with the lowest inflation, QuASAR-MPRA and the t-test, have a 69% match at 10% FDR.
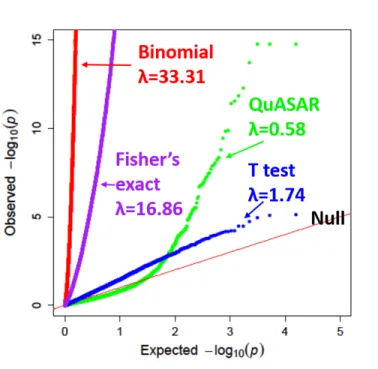
These results are also similar if we use a different dataset (Ulirschet al., 2016) (Figure 6). QuASAR-MPRA results in the lowest inflation, withλ = 0.58, while the binomial test produces the greatest inflation, with λ = 33.31followed by Fisher0s exact test λ = 16.86. The paired t-test is relatively well calibrated λ = 1.74but detects less hits than QuASAR-MPRA (only 64 constructs containing 53 variants at FDR 10%). Using QuASAR-QuASAR-MPRA we were able to identify 103 constructs containing 95 variants (FDR 10%) with significant ASE.
Figure 6:Comparing ASE testing methods in Ulirschet al.(2016). QQplot depicting thep-value distributions from testing for ASE using four different methods in K562 for all SNPs.λmeasures genomic inflation deviation from the uniform.
Alternatively, we also considered the p-value distributions only for the SNPs not pre-dicted to affect TF binding (non-effect SNPs), as these SNPs are more likely to be true
negatives 5. Note that our computationally predicted effects are not a perfect gold stan-dard and in fact one major application of this type of data and its analysis is to precisely validate the accuracy of these computational annotations and predictions as we will show later. Nevertheless, we see (in Figure 5, 6 and 21) that the two methods with lowest lambda values show an even lower departure from the null, consistent with the computa-tional method correctly predicting a large number of true positives.
Applying QuASAR-MPRA to simulated data
To further investigate our proposed new method we used simulated data where we know exactly the underlying true ASE signal to evaluate the detection accuracy. It is im-portant to note that the simulation conditions may not exactly match those from the real data (see Methods) but they are very useful for getting more insights about the scenarios that may have larger impact on performance. Here we only compare the two methods that seem to be well-calibrated under the null hypothesis QuASAR-MPRA and thet-test. Under the null distribution for all our simulations both tests do not show a significant departure from the expected uniform distribution for thep-values.
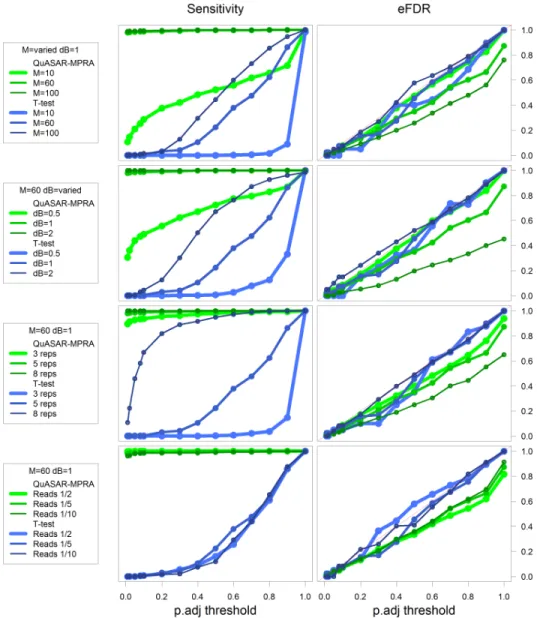
We then compared results from QuASAR-MPRA and the t-test in scenarios when a fraction of the tests do have ASE (see Methods). In every condition QuASAR-MPRA has greater sensitivity to detect ASE than the t-test (Figure 7). The t-test seems to perform better when the over-dispersion is low (M=100), or when the effect size of ASE is high (∆β=2). QuASAR-MPRA also handles well low coverage data and a small number of replicates to achieve good statistical power (Figure 7). This is consistent with our original findings with QuASAR (Harveyet al., 2014) demonstrating that we can measure ASE in a small number of replicates if there is enough read coverage. Thet-test appears to require a
large number of replicates in order to have power to detect ASE as compared to QuASAR-MPRA.
Figure 7: Exploring the performance across multiple simulated conditions. Plots depicting empirical power (sensitivity, Lefty -axis) and empirical FDR (eFDR, Righty-axis) achieved at different BH-FDR control levels (x-axis) for ASE testing using QuASAR-MPRA (green) and at-test (blue) across multiple simulated conditions (rows). Default conditions are M=60,∆β=1, 5 replicates, and reads/5. Each row explores changing different simulation settings: A) over-dispersion high (M=10), medium (M=60) and low (M=100); B) effect-size high (∆β=2), medium (∆β=1) and low (∆β=0.5); C) number of replicates (3, 5, or 8) D) overall sequencing depth compared to (Tewheyet al., 2016) (1/10, 1/5, or 1/2).
Validation of experimental and computational annotations for functional non-coding variants
High-throughput reporter assays can be used not only to fine-map causal variants in both GWAS and eQTL studies, but also to validate SNP functional annotations
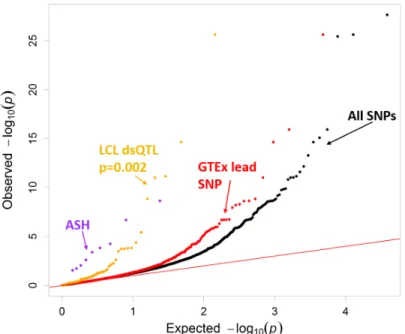
(Kwas-nieski et al., 2014). Here we take advantage that the p-values derived from QuASAR are well calibrated under the null hypothesis to examine enrichments for lowp-values in both experimentally and computationally derived annotations for allele-specific effects on TF binding. The experimentally derived annotations included LCL dsQTLs (Degner et al., 2012), allele-specific hypersensitivity (ASH) SNPs (Moyerbraileanet al., 2016b), and GTEx eQTLs (Consortium et al., 2015). In both LCLs (Figure 8) and HepG2 (Figure 22), ASH SNPs had the greatest departure from the null, followed by LCL dsQTLs.
Figure 8: Validating experimental annotations in LCLs. QQ plot depicting thep-value distributions from testing for ASE using QuASAR, overlapping with experimental genomic annotations including allele-specific hypersensitivity (ASH) (Moyerbraileanet al., 2016b), DNase I sensitivity QTLs (dsQTLs) (Degneret al., 2012) and GTEx (Genotype-Tissue Expression) lead SNP in LCLs (Consortium
et al., 2015). An annotation enrichmentp-value is reported next to their labels, but only for those annotations that are significantly enriched for small QuASAR-MPRAp-values according to the logistic model (see Methods).
We then asked which computational annotations seem to be the most complete and accurate predictors of the effect of a sequence variant on gene regulation as validated by MPRA. We considered effect-SNPs active in LCLs or HepG2 (Moyerbraileanet al., 2016b), non-effect SNPs (negative control) (Moyerbrailean et al., 2016b), predicted functional SNPs from CATO (Maurano et al., 2015), GKM-svm (Lee et al., 2015a) (a gapped kmer
sequence-based computational method to predict the effect of regulatory variation), and DeepSEA (Zhou and Troyanskaya, 2015) (predicts genomic variant effects at the variant position using deep learning-based approach). Each of the functional annotations show marked differences inp-value distribution. As expected, SNPs in active TF footprints, but not predicted to affect binding, show no departure from the overall distribution. In both LCLs (Figure 9) and HepG2 (Figure 23), CATO and GKM-svm SNPs had the greatest de-parture from the null, closely followed by effect-SNPs.
However, effect-SNPs annotated a considerably larger number of SNPs for both cell-types and were also able to predict cell type-specific effects. LCL effect-SNPs in LCLs had a p-value distribution with a greater departure from the null than the HepG2 effect-SNPs (Figure 24) (p = 1.77 ×10⁻¹⁵ for LCL effect-SNPs vs p=0.14 for HepG2 effect-SNPs), whereas HepG2 effect-SNPs in HepG2 had ap-value distribution with a greater departure from the null than the LCL effect-SNPs (p = 1.81× 10⁻⁴ for HepG2 effect-SNPs vs p =
1.06×10⁻⁷ for LCL effect-SNPs Figure 25). The differences found here in HepG2 however are minor, potentially due to fewer annotations (993 annotated LCL effect-SNPs vs 193 HepG2 effect-SNPs).
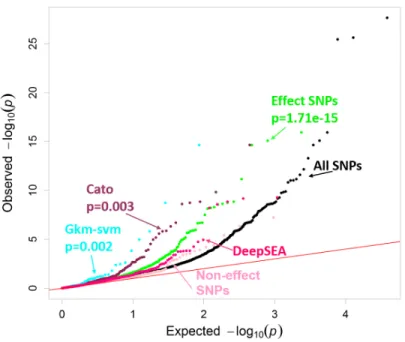
Figure 9: Validating computational genomic annotations in LCLs. QQ plot depicting thep-value distributions from testing for ASE using QuASAR, overlapping with computational genomic annotations in LCLs. Effect-SNP scores have a threshold of<−3or
>3. CATO (Mauranoet al., 2015) prediction scores have a threshold of>0.1. GKM-svm (Leeet al., 2015a) gapped kmer sequence-based computational method to predict the effect of regulatory variation has a threshold of< −6 or> 6. DeepSEA (Zhou and Troyanskaya, 2015) predicts genomic variant effects at the variant position using deep learning-based algorithmic framework. The functional significance predictions have a threshold of< 0.05. An annotation enrichmentp-value is reported next to their labels, but only for those annotations that are significantly enriched for small QuASAR-MPRAp-values according to the logistic model (see Methods).
Finally, to formally quantify which annotations are the best predictors of the ASE found in the MPRA, we used all experimental and computational annotations within a logistic model to predict which SNPs in the MPRA data have a nominally significant QuASAR p -value (p <0.001). The top predictors were GKM-svm SNPs (p <2×10⁻¹⁶) and effect-SNPs (p = 2.17×10⁻¹⁵) in LCLs (Table 12). In HepG2, effect-SNPs were the greatest predictor
(p= 1.18×10⁻¹⁰) (Table 13).
Discussion
High throughput reporter assays have proven extremely useful for the experimental validation of enhancer regions. The recent adaptation of MPRA to investigate ASE addi-tionally allows for validation of regulatory variants in TF binding sites, which have been