del Servizio Studi
Does Market Transparency Matter?
a Case Study
by A. Scalia and V. Vacca
The views expressed in the articles are those of the authors and do not involve the responsibility of the Bank.
Editorial Board:
MASSIMO ROCCAS, FABRIZIO BALASSONE, GIUSEPPE PARIGI, ROBERTO RINALDI, DANIELE
by Antonio Scalia* and Valerio Vacca*
$EVWUDFW
We analyse a change in the degree of transparency of MTS, the electronic inter-dealer market for Italian Government bonds, namely the July 1997 move to the anonymity of quotes. Our evidence supports the hypothesis that a decrease in transparency makes liquidity traders worse-off, whereas large/informed traders find it less costly to execute block trades. The evidence is also consistent with the “waiting game” hypothesis of Foster and Viswana-than (1996): under anonymity, traders tend to delay their trades in an attempt to acquire in-formation through the order flow.
From a public welfare perspective, our results indicate that the move to anonymity has been accompanied by an increase in market liquidity and by a reduction in volatility, a phe-nomenon that is also partly explained by the growth in Italy’s prospects for early participa-tion in the EMU. The speed of informaparticipa-tion aggregaparticipa-tion on MTS increases, as shown by an improvement of the MTS lead over the futures market. In a European perspective, the current organisation and performance of MTS place the market in a competitive position with re-spect to other sovereign bond markets and may contribute to their integration under the sin-gle currency.
2. The market... 15
3. Evidence on theoretical predictions... . 17
3.1 Hypothesis I - The liquidity trader’s curse... 17
3.2 Hypothesis II - The large trader’s blessing... 18
3.3 Hypothesis III - The decline of OTC free-riding... 19
3.4 Hypothesis IV - The waiting game... 19
4. Liquidity... 20 4.1 Active bonds... 20 4.2 Bid-ask spread... 21 4.3 Market impact... 24 5. Volatility... 24 6. Efficiency... 25
7. Discussion and regulatory policy implications... 28
8. Conclusion... 32
Tables and figures... 34
Appendix... 46
The electronic inter-dealer market for Italian Government bonds, known as MTS (from Mercato Telematico dei Titoli di Stato), is characterised in international comparison by a high degree of transparency (Inoue, 1999). In July 1997, ten years after its inception, MTS switched to a new operating regime in which the names of market makers who post bid and ask quotes for each security are not revealed.
This switch seems worth investigating because it prompts a number of interesting questions for financial economists and regulatory authorities. What was the reason for the switch? Who benefited from it? How did it affect market performance, in terms of liquidity, efficiency and price volatility? Is market microstructure theory consistent with the evidence? Has the switch altered the way Italian T-bonds are traded on MTS as compared to the over-the-counter market? Can we derive any regulatory policy lessons from the experience of MTS? What are the implications for the development of an integrated sovereign bond market in the European single-currency area?
Market microstructure theory shows that the existence of information asymmetries among participants is a key element in understanding how a financial market is organised and works. If the market is populated by two types of agents with different information en-dowments and objective functions, the better-informed and the liquidity-motivated, then a given market set-up may be optimal for one group but, generally, not for the other. Similarly, a change in the set-up may benefit one group at the expense of the other. The dynamic rela-tionship between the two groups has implications for the consolidation or fragmentation of trading in different markets and for asset price volatility. It can be argued that in a bond mar-ket, like ours, the absence of “inside” information on an asset’s fundamental value reduces the scope for heterogeneity of beliefs with respect to a stock market. However, we observe
1 7KLVSDSHUZDVZULWWHQDVDFRQWULEXWLRQWRWKH6WXG\*URXSRQ0DUNHW/LTXLGLW\VHWXSE\
WKH&RPPLWWHHRQWKH*OREDO)LQDQFLDO6\VWHPRIWKH * FHQWUDO EDQNV :H DUH JUDWHIXO IRU PDQ\ KHOSIXO FRPPHQWV IURP 0DVDDNL 6KLUDNDZD WKH FRRUGLQDWRU RI WKH 6WXG\ *URXS &DUOR 6DQWLQL0LFKHOH%DJHOOD0DUFR0D]]XFFKHOOL3DROR$QJHOLQL5REHUWR9LROLDQDQRQ\PRXVUHIH UHHDQGVHPLQDUSDUWLFLSDQWVDWWKH%DQNRI&DQDGDLQ9DQFRXYHUWKH%DQFDGª,WDOLDDQGWKH 9,,)LQDQFLDO&RQIHUHQFHDWWKH8QLYHUVLW\RI5RPH7RU9HUJDWD7KHXVXDOGLVFODLPHUDSSOLHV 7KHYLHZVH[SUHVVHGKHUHLQDUHWKRVHRIWKHDXWKRUVDQGGRQRWLQYROYHWKHUHVSRQVLELOLW\RIWKH %DQFDGª,WDOLD&RUUHVSRQGHQFHDGGUHVVHPDLOVFDOLDDQWRQLR#LQVHGLDLQWHUEXVLQHVVLW!
that the concept of private information must also include knowledge that dealers may acquire on the order flow and on the trading intentions of large customers, an argument which ap-plies to the bond and foreign exchange markets as well as to the stock market. This knowl-edge causes an update of beliefs and may be profitably exploited at the expense of other market participants, according to a notion that is also at the basis of the literature on block trading and dual-trading. From an empirical viewpoint, some studies support this hypothesis in the forex market and in the bond market (see Lyons, 1995 and Scalia, 1998a), although there is also evidence to the contrary (Proudman, 1995).
The models of information asymmetry point to one conclusion: liquidity traders in general prefer more transparency, informed traders prefer less transparency. This notion was pioneered by the Grossman (1988) model of sunshine trading. Sunshine trading, i.e., dis-closing pre-trade information on the direction of price-contingent orders, removes the possi-bility that those orders are information-based and thus eases the inference problem of market makers. This should lower execution costs for sunshine traders and possibly increase overall trading volume. Forster and George (1992) explore the effects of various degrees of traders’ anonymity on the distribution of wealth within the two groups of market participants. They conclude that if monitoring who is trading in a centralised system gives information on li-quidity trades, then disclosing the identity of current participants lowers execution costs for liquidity traders, provided that there is sufficient competition among privately informed agents. This clearly reduces the expected profit of informed traders. The analysis of Pagano and Röell (1996) provides similar results: in a comparison of alternative trading systems, it is shown that greater transparency, such as that provided by a centralised order execution sys-tem with full disclosure, reduces the average trading cost for liquidity traders. Madhavan (1995) examines the issue of post-trade information disclosure and market fragmentation vs consolidation in a two-period dynamic model. The model provides an unambiguous predic-tion on the implicapredic-tion of different disclosure rules for informed traders and “large” (or stra-tegic) liquidity traders: they should prefer non-transparency because it facilitates dynamic trading strategies, like “working” a large order over time. Without mandatory disclosure, dealers also prefer not to disclose trades voluntarily because they profit from the reduction in price competition. Naik, Neuberger and Viswanathan (1994) investigate the relationship
between delayed trade disclosure rules and execution costs in a dynamic market setting with risk averse dealers. If there are two stages of trading, first a public investor who trades with market maker A, and then A who trades with other competing market makers, a delayed dis-closure rule of the first-round trade by A grants him the possibility in the second round to exploit the information conveyed by the trade itself. In turn, A passes on part of the associ-ated profit to the public investor. The authors stress the fact that their conclusion has a more general bearing: any time less-than-full disclosure of large and informative orders occurs, the dealers who intermediate the orders and their customers should be better-off.
Our summary of models that explore the effects of information asymmetry and market transparency is far from exhaustive. However, theory provides an unambiguous prediction in our context: under the assumption that significant informational asymmetries exist, the switch that took place on MTS in July 1997 should have shifted the balance between liquid-ity traders’ and informed/large traders’ profits in favour of the latter. For the purpose of the tests to be conducted in the following sections, we set forth two hypotheses.
• Hypothesis I: liquidity traders have been made worse-off by the move to
anonymity (we shall call this hypothesis the “liquidity trader’s curse”).
• Hypothesis II (the “large trader’s blessing”): large/informed traders have
been made better-off.
Our brief survey also suggests a third implication, related to the previous ones. By not disclosing the names of market makers, the 1997 switch has made the structure of MTS more similar to that of the over-the-counter inter-dealer broker market, where dealers negotiate trades without revealing their identity. We should consider the possibility that dealers in the opaque over-the-counter market (trading either through a broker or vis-à-vis) benefit from the price discovery function of the highly transparent MTS, thus free-riding on the information disseminated by the latter (see also Madrigal, 1996). Hence, before the 1997 shift there would have been two types of free-riding. The first would have been among MTS members, and it is captured by Hypothesis I. The second would have been by the OTC market at the expense of MTS. If the switch to anonymity has reduced the second type of free-riding,
making MTS more similar to the OTC market, then the incentives for informed/large dealers to trade over-the-counter rather than on the regulated market have declined. We have the following hypothesis.
• Hypothesis III (“decline of OTC free-riding”): trading volume on the OTC
market has fallen since the MTS shift.
The events that preceded the market move seem broadly consistent with Hypotheses I-III. At the end of 1996 the proposal of anonymity was put forward by a group of MTS spe-cialists (which we may assimilate to the informed/large traders of theory), led by one with foreign affiliation. The main argument advanced by the proponents was that the shift would increase the welfare of the most skilled market players, thus enhancing competition and mar-ket efficiency. In fact, the proponents’ complaint about the regime of full transparency was that it allowed small dealers to mirror the moves of the big players. Understandably, some small traders had reservations. The Treasury and the Banca d’Italia raised no objections. In the end the management board (in which small dealers are lowly represented) approved the proposal, which became effective on 14 July 1997.
The MTS switch of 1997 is also interesting for another reason. Foster and Viswanathan (1996) have explored the possibility that informed traders’ signals are different, giving an centive to informed traders to forecast the price forecasts of others. This may induce each in-formed trader to delay his transactions and wait for the other traders’ moves to reveal more information. The Foster-Viswanathan model has the following prediction for intraday trading activity on MTS.
• Hypothesis IV (the “waiting game”): after the switch to anonymity, the
in-creasing dispersion in traders’ opinions reduced market turnover in the early stages of trading and increased it in the later stages.
The previous discussion explains the first objective of this paper. By analysing various market indicators before and after the MTS switch to anonymity, we wish to conduct a test of the four above mentioned hypotheses: the liquidity trader’s curse, the large trader’s blessing,
the decline of free-riding and the waiting game hypothesis. Another contribution of our test is that we use an original and extensive data set as compared to that of the existing literature.
Should the hypothesised worsening of terms for liquidity traders be the unique, or even the main concern for market regulators? This question raises the more general problem of which market design maximises public welfare, which brings us to the subject of normative economics and regulatory policy. O’Hara (1995) tries to qualify the three goals of a market set forth by Domowitz (1990). They are (i) reliable price discovery, (ii) broad-based price dissemination, and (iii) effective hedging against price risk.
Concerning the first goal, O’Hara argues that the ability to find a market-clearing price is enhanced by scale and possibly by the existence of multiple settings which suit the needs of different types of traders.
The achievement of broad-based price dissemination is a more contentious issue be-cause the free-riding problem discussed earlier sets up a trade-off between market ency and the price discovery process in the same market. Broadly speaking, market transpar-ency certainly improves public welfare. However, in a dynamic setting, if the same asset is traded in market A and market B, and market A becomes more transparent, then it is possible that large/informed traders will move from A to B. In this case, it is conceivable that the
price discovery process in market A will diminish, to the advantage of market B2. Therefore,
it is not clear where on the ideal market transparency scale the costs from a reduction in in-formed trading will outweigh the benefits from greater information dissemination (see e.g. Franks and Schaefer, 1995). This issue is at the heart of our investigation.
The third goal, namely hedging of price risk, reflects the concern for the market’s abil-ity to provide insurance to liquidabil-ity traders. The empirical counterpart of this goal is the minimisation of execution costs for liquidity trades and the improvement in general of mar-ket liquidity, defined as the property whereby the price impact of an order is small.
27KHDERYHVWDWHPHQWKDVQRSUHFLVHLPSOLFDWLRQVRQWKHFKDQJHLQWKHGHJUHHRISULFHGLVFRYHU\
WKDWGHULYHVIURPDFKDQJHLQWKHWUDQVSDUHQF\RI$IRUWKHZKROHPDUNHWJLYHQE\WKHVXPRI$ DQG%
O’Hara introduces a fourth goal of optimal market design:
“ (...) another, perhaps greater, function of the market that is not recog-nized in the working definitions given above (...) is the role of market efficiency. How well and how quickly a market aggregates and impounds information into the price must surely be a fundamental goal of market design.”
However, she also notes that the search for market efficiency presents two main prob-lems. First, raising the speed of information aggregation may in principle increase price volatility, which is not desirable. Second, since market efficiency is positively related to the extent of information-based trading, which in turn generates losses for liquidity traders, the goal of efficiency may conflict with that of minimising execution costs for the uninformed. To summarise, although the issue of the optimal design of a financial market remains in O’Hara’s words an open question, it seems safe to claim that, provided “sufficient” scale and transparency, the contribution of a market to public welfare should be measured along three dimensions: liquidity, volatility, efficiency (where the second variable clearly exerts a nega-tive effect).
We observe that in the case of the government bond market the pursuit of public wel-fare along these lines is consistent with the objective of minimising the cost of public debt servicing and with the operating objectives of the monetary and regulatory authorities (Santini, 1997): to carry out liquidity management operations that do not affect the smooth functioning of the market, to obtain information about market expectations, to improve
monetary policy implementation in general, to conduct macro-prudential policy3.
The second objective of our empirical investigation is therefore of a regulatory nature. Because normative economics in this area does not show unambiguously what is the welfare-maximising degree of market transparency, we wish to develop a case study based on the previously noted event. We observe a change of regime in the arrangement of our market. By estimating the three performance variables defined earlier, both before and after the shift, we
3 $ GHWDLOHG VXUYH\ RI PDUNHW VWUXFWXUH DQG UHJXODWLRQ LQ JRYHUQPHQW VHFXULWLHV PDUNHWV LV
try to empirically assess whether it afforded a higher or lower level of welfare. We shall also try to keep into account an important macroeconomic factor that may have influenced the performance of MTS during our sample period, namely the fiscal consolidation process which brought about a sharp improvement in Italy’s prospects for early participation in the European Monetary Union. To this extent, we shall provide estimates of the relative weight of the macroeconomic effect on our market performance measures, as distinct from the mi-croeconomic effect related to the shift to anonymity.
The paper proceeds as follows. Section 2 describes the main features of the market. Section 3 presents evidence and tests on Hypotheses I-IV. Sections 4 to 6 provide estimates and tests on market liquidity, volatility and efficiency, respectively. Section 7 discusses the empirical evidence against the background of theory, the regulatory implications and the prospects for the development of an integrated securities market in the single currency area. Section 8 summarises and concludes. An Appendix table provides a brief history of the Ital-ian government bond market during the last decade.
2. The market
The securities listed on MTS include all recent Italian Treasury issues: the 3, 6 and 12-month bills known as BOTs, the 18 and 24-12-month bills known as CTZs, the floating-rate notes with initial life of 7 years known as CCTs, and the fixed-coupon BTPs with initial life of 3, 5, 10 and 30 years. The minimum order size is 5 billion lire, which is by far the modal trade size. Market members are of three types: specialists, primary dealers and ordinary
members4. Specialists and primary dealers are committed to quoting firm two-way quotes on
a wide range of securities, to being competitive in terms of tightness of spreads, and to maintaining a share on the primary and secondary market above a certain threshold, with
stricter requirements applying to specialists5. Both categories may apply for bond and cash
4 Strictly speaking, specialists are included in the class of primary dealers. Upon demand and subject to the selection criteria set by the TreasuryDQGWKH%DQFDGª,WDOLD, a primary dealer may be upgraded to the status of specialist.Downgraded specialists maintain the status of primary dealers.
5 7KHUHTXLVLWHVIRUVSHFLDOLVWVDUHDPDUNHWVKDUHDERYHSHUFHQWRQWKHSULPDU\PDUNHWDQG
lending with the Banca d’Italia. Ordinary members can trade at the quoted prices. Specialists
and primary dealers can also trade at somebody else’s quotes6. In practice over 60 per cent of
transactions take place between two market makers (specialists and primary dealers). In what follows we shall refer to the players who initiate a trade as “traders”, without distinguishing whether they are market makers or ordinary members.
Trading hours are from 9.00 to 17.10. The market trading mechanism is fully inte-grated. Each member’s video-terminal serves three functions: (i) publication of pre- and
post-trade information, including the five best bid and ask quotes for each security7, (ii) trade
execution at a key-press, and (iii) automatic clearing and settlement onto the centralised
sys-tems for bank reserves and government bonds managed by the central bank8.
In the Spring of 1997 the run-up to the annual review of the specialists’ requisites, in-cluding a check of their market share, contributed to the growth in overall trading volume observed on MTS. Some specialists may have inflated their transactions on an intraday basis, without affecting their open positions at the end of the day, in an attempt to improve their turnover score. After the June 1997 review, the Treasury and the Banca d’Italia decided to
lengthen the observation period to two years and to hold the next review in January 20009.
Partly as a consequence of this process, daily trading volume changed from an average 36 trillion lire in the second half of 1996, to 45 trillion in the first half of 1997; since then, it has stabilised at around 33 trillion lire.
The data-set employed in the empirical analysis of the following sections includes all MTS transactions, and the identity of the traders, in the period from 1 September 1996 to 31 May 1998. The old regime data sample runs from 1 September 1996 to 13 July 1997 (period 1). The new regime sample goes from 14 July 1997 to 31 May 1998 (period 2). The two
6 7KH-XO\VKLIWWRDQRQ\PLW\ZDVDFFRPSDQLHGE\DIXUWKHULQQRYDWLRQDOOTXRWHVDWWKH
VDPH SULFH PDGH E\ GLIIHUHQW PDUNHW PDNHUV DUH DJJUHJDWHG OHDGLQJ WR DQ DJJUHJDWH YROXPH ILJXUHDVVRFLDWHGZLWKHDFKRXWVWDQGLQJTXRWH
7 3ULFHVDUHTXRWHGFOHDQDVDSHUFHQWDJHRISDUYDOXH
8 )XUWKHUGHWDLOVRQWKHIXQFWLRQLQJRI076FDQEHIRXQGLQ%DQFDGª,WDOLD
9 7KHVZLWFKWRDQRQ\PLW\ZDVDOVRYLHZHGDVDPHDVXUHWRDYRLGWKHLQIODWLRQRIWUDGLQJYRO
samples are approximately equal in length, about 10 and a half months each. To be precise, there are 213 working days in period 1 and 221 working days in period 2.
3. Evidence on theoretical predictions
3.1 Hypothesis I - The liquidity trader’s curse
The first type of evidence we should like to gather is that concerning the change, if any, in the degree of market participation by the informed/large dealers and the liquidity/small traders. To this extent, Table 1 provides summary statistics on the average number of active traders on a daily basis, ranked according to their market share, before and after the switch to anonymity. If we consider the smallest traders (below 0.1 per cent of trading volume) we note that they decrease in number from 15 in period 1 to 3 in period 2. The second smallest class of traders (between 0.1 and 0.25 per cent) decreases from 110 to 84. The third class (between 0.25 and 0.5 per cent) increases slightly from 59 to 65 traders. The fourth class (0.5 to 1 per cent) increases from 34 to 41 traders. Overall, if we set a threshold for “small” trad-ers at 1 per cent, we note that their average number decreases from 218 to 193. The two classes of the largest traders, from 1 to 2.5 per cent and above 2.5 per cent, both increase, with their sum going from 42 to 48 traders. The reduction in the number of small traders is also evidenced by the data on market concentration, provided in the lower part of the table. The Herfindahl concentration index of traders increases from 3.2 to 3.8 per cent. The degree of concentration measured on the market makers’ side increases from 5.0 to 5.8 per cent on average. The null hypothesis of equal means before and after anonymity is rejected. These
results are consistent with Hypothesis I10
.
10
7KHGDLO\EHKDYLRXURIWKHFRQFHQWUDWLRQLQGLFHVKDVDPL[HGSDWWHUQ,WLVUHODWLYHO\VWDEOHLQ WKHILUVWKDOIRIHDFK\HDUEXWLWWHQGVWRLQFUHDVHVOLJKWO\WRZDUGV\HDUHQG
3.2 Hypothesis II - The large trader’s blessing
The greater concentration among market makers seems consistent with the hypothesis that large traders have been made better-off. The category of informed and/or large traders can also be detected ex post based on the occurrence of large trades. On MTS a “block trade” as such hardly ever occurs. Due to the prudence of market makers who post firm quotes, also in terms of size, 99 per cent of transactions occur at or below 5 times the minimum size of 5 billion lire. Traders wishing to exchange a large amount of bonds respond to this behaviour by working the order over time. This would suggest to proxy large trades by tracking down the continuations of trades made by the same trader on the same bond on each working day. Things are complicated, however, by the fact that during our sample period a “race for vol-ume” took place (see the previous section), and many trades were inflated, i.e. offset by trades of opposite sign within the same day. To control for this phenomenon, we proxy large trades as follows. Within each working day, we compute the net daily change in each trader’s holdings of each listed bond. When the net change in absolute terms is larger than a given threshold, we count one “large trade” for each continuation of trades above the same thresh-old. Our working variable is then defined as the ratio of large trades so defined to total daily volume.
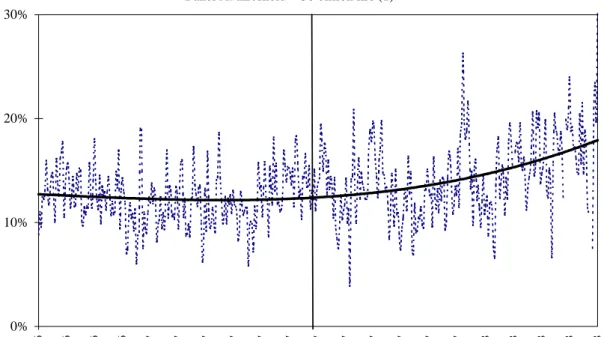
The evidence is presented in Figure 1, Panel A, for a threshold of 50 billion lire, and Panel B, for a threshold of 100 billion lire. Each panel reports the daily series of the large trade ratio and an interpolating function In the case of a threshold of 50 billion lire, the ratio generally lies between 10 and 20 per cent. Panel A shows that the series increases from pe-riod 1 to pepe-riod 2, and the tests of equal mean and of equal distribution across pepe-riods are rejected. The series obtained with a threshold of 100 billion lire generally lies between 0 and 10 per cent. The evidence across periods is analogous: the ratio increases from period 1 to period 2, indicating that, under anonymity, it has become easier to build/unwind large posi-tions on MTS, and the tests of equal mean and distribution are rejected. These findings sup-port Hypothesis II.
3.3 Hypothesis III - The decline of OTC free-riding
In order to gather evidence on the hypothesised shift from OTC to MTS transactions, we used the information contained in the monthly statistical reports of MTS market makers to the Banca d’Italia. These reports include the OTC trading volume in government bonds of each dealer, with a breakdown for trades carried out with residents and non-residents. We corrected the residents’ figures for the effect of double counting by scaling them down by the share of MTS turnover involving trades between two market makers. We thus obtained an estimate of the OTC volume that is comparable with the MTS exact figures that we possess. We then calculated the ratio of OTC volume over total inter-dealer volume (OTC plus MTS). The resulting figures are given in Table 2. It shows that the OTC share tends to increase from the end of 1996 onward. The highest OTC share figures are observed in July 1997 (37.3 per cent) and in May 1998 (39.6 per cent). The subdued OTC share in the Spring of 1997 may partly be explained by the race for volume that took place on MTS and that no longer oc-curred under anonymity. The evidence of Table 2 is at odds with Hypothesis III.
3.4 Hypothesis IV - The waiting game
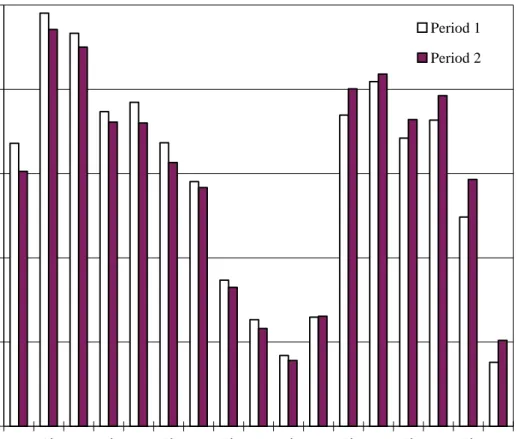
If the waiting game hypothesis holds, dealers should try to delay their trades on an in-traday basis in the attempt to acquire more information through trade flow, and we would expect a shift of trading volume from the early stages of trading to the later stages. In order to analyse intraday turnover on MTS, we chose the benchmark 10-year BTP issue, which is generally the most heavily traded security. The evidence is given in Figure 2, which shows the intraday relative volume on the benchmark BTP, i.e., the share of trading volume ob-served in each half-hour interval of the day over the total daily volume of the bond. The key findings that emerge from Figure 2 are as follows. First, trading volume increases from the first half-hour of trading (9.00-9.30) to the second half-hour. Second, like in most financial markets, there is a decline in trading activity after 12.30 for about 1½ hours. Third, trading activity remains steady after 14.30 (we recall that the closing interval after 17.00 lasts only 10 minutes, i.e. one third the duration of the other intervals). Finally, we note that from pe-riod 1 to pepe-riod 2 volumes decline slightly in the morning intervals and increase
corre-spondingly in the intervals after 14.30. In fact, 3.2 per cent of total daily volume shifts from trading before 14:30 in period 1 to after 14:30 in period 2. The hypothesis of identical distri-bution of volumes is rejected in 9 out of 17 intraday intervals by the Kolmogorov-Smirnov test. The hypothesis of identical means is rejected in 6 out of 17 intervals by the t-test. The last finding seems consistent with Hypothesis IV.
4. Liquidity
Various definitions have been provided in the literature for the concept of market li-quidity. Perhaps the most popular one is “a market is liquid if the impact of a trade on price is small”. However, the liquidity concept has several other dimensions (see e.g. O’Hara, 1995; Muranaga and Shimizu, 1997). The richness of our data-set allows us to conduct an empirical study of market liquidity along different definitions. The first and simplest indica-tor of market liquidity is turnover. For the reason explained in Section 2, namely that trading volume should have been biased by the dealers’ effort to maintain their status before the June 1997 review, we do not think that it is useful to compare total MTS trading volume before and after the market move to anonymity. Instead, we prefer to focus our attention on the number of bonds that were actively traded on each day. The second indicator of liquidity is the bid-ask spread. The (half-)spread is the reward paid by traders to market makers for their services, which provides immediacy to those wishing to buy or sell a security. The third indi-cator of liquidity is the market impact of a trade, which is related to the adverse selection problem faced by market makers and which varies directly with the perceived arrival of or-ders from informed traor-ders. We present the evidence on each of the above mentioned indi-cators respectively in the three following subsections.
4.1 Active bonds
We choose two statistics to describe turnover on the active bonds. We first rank the bonds traded on each day by their volume of transactions. We then consider those bonds be-low the median and take (i) their number (i.e., one half of the total number of traded bonds) and (ii) their share over total daily trading volume. These statistics are plotted on a daily
ba-sis in Figure 3. It shows that the number of the 50 per cent least-traded bonds tends to in-crease in period 1, and thereafter it declines slightly. On average, this number changes from 63.6 in period 1 to 65.1 in period 2. On the other hand, the volume share of the least traded bonds shows an increasing trend, and it doubles on average from 6.9 per cent before ano-nymity to 14.3 per cent after anoano-nymity. The tests of the hypotheses that the mean and distri-bution of market share by class do not change are rejected.
We note that in addition to the review of the specialists’ status (see Section 2), there were also reviews of the primary dealers’ status at the end of 1996 and 1997. One of the req-uisites was related to each dealer’s ability to make a market in the illiquid bonds. We attrib-ute the observed increase in the share of the least traded bonds at year-end to the dealers’ at-tempt to qualify in the annual review. This phenomenon seems to have been particularly sig-nificant at the end of 1997.
4.2 Bid-ask spread
Our intraday data-set does not include data on the bid-ask spread. In order to obtain es-timates of the fixed-cost of trading associated with the existence of the spread, we use our intraday transactions data to fit the two-equation empirical model of trade and quote revision proposed by Foster and Viswanathan (1993) (see Hasbrouck, 1991 for a thorough discus-sion). The model is as follows:
(1) qt i d i dp q i N j t j k t k t k j t = + = + + + = = − = −
∑
∑
∑
α δ 1 β ι τ 2 1 3 1 3 (2) dpt c[
q q]
ci[
]
v i N q q d i t j d j t t j N t t t t t t = > − > + − + + + = > > = = = −∑
−∑
2 1 0 1 0 2 1 1 1 1 2 0 0 2 1 1 λτ λ τwhere qt is the signed trade size (e.g., –5 indicates a public sale of 5 billion lire at the
the current trade. 1d i
t= is an indicator variable equal to 1 if trade t occurs in the i-th
half-hour interval of the day and 0 otherwise. 1q 0
t> is an indicator variable equal to 1 if trade t is
a public buy and 0 otherwise. Equation (1) tries to model the expected value of the incoming
order conditional on the past record of orders and prices; the residual τt is the unexpected
component, or the innovation brought about by the order and potentially related to informed
trading11. This residual in turn becomes one of the explanatory variables of the price change
caused by the order, given by equation (2). In it, the coefficient c is an estimate of the “fixed” component of transaction costs. Assuming that the “true” (and unobservable) value of the bond does not change, c measures the difference between the transaction price and the true price, corresponding to one half of the spread, i.e., to the compensation for the market mak-ing services provided by the dealer who posted the quote. In practice, since the true bond price does change over time, if we take 2c we do not obtain the actual spread but an unbiased
(and noisy) estimate of it12. In equation (2) we allow for the possibility that 2c changes
dur-ing the day, by introducdur-ing dummy variables for the half hour intervals i =2,...,N, where N
is the last interval of the day (from 17.00 to the market close at 17.10). In the same equation,
the λ coefficient measures the adverse selection component of trading cost, or market
im-pact of a trade, which enters the total cost of trading when the trade itself is not expected by the market makers on the basis of the past order flow. Again, we allow for the possibility that
λ changes during the day, by introducing (N-1) interval dummies. This estimation approach,
which recognises the dynamic nature of trading costs, is similar to those employed in a
num-ber of previous studies13.
11 (TXDWLRQLVUXQXVLQJWKHORJLWPHWKRG 12 ,QRUGHUWRFRQWUROIRUUHVLGXDOKHWHURVNHGDVWLFLW\FDXVHGE\WKHGLIIHUHQWOHQJWKRIWLPHEH WZHHQVXEVHTXHQWWUDGHVZHZHLJKWHDFKREVHUYDWLRQLQHTXDWLRQE\WKHLQYHUVHVTXDUHURRW RIWKHWLPHHODSVHGVLQFHWKHSUHYLRXVWUDGH:HWKXVUXQHTXDWLRQZLWKWKHZHLJKWHGOHDVW VTXDUHVPHWKRG 13(TXDWLRQLVLQVWDQWDQHRXVLHWKHUHDUHQRODJJHGHIIHFWVRISULFHVRUTXDQWLWLHV$FFRUGLQJ WR+DVEURXFNWKHLQFOXVLRQRIODJJHGWHUPVLQWKHSULFHHTXDWLRQZRXOGEHMXVWLILHGXQGHU WKHIROORZLQJFLUFXPVWDQFHVDLQYHQWRU\HIIHFWVDUHLQSODFHVXFKWKDWGHDOHUVVHHNWRVPRRWK WKH KROGLQJV RI ERQGV RYHU WLPH E WKHUH LV §SULFHGLVFUHWHQHVV¨ GXH WR D ODUJH WLFNVL]H F SULFHVDGMXVWVORZO\WRQHZLQIRUPDWLRQ,QRXUVHWWLQJZHWKLQNWKDWWKHFDVHIRUK\SRWKHVHVD FLVZHDNDQGWKHLQFOXVLRQRIODJJHGWHUPVZRXOGRQO\DIIHFWWKHHIILFLHQF\RIWKHHVWLPDWHV 7KHUHIRUHZHVHHQRFRPSHOOLQJUHDVRQIRUGHSDUWLQJIURPWKH)RVWHU9LVZDQDWKDQLQVWDQWDQH RXVPRGHOOLQJDSSURDFK7KHDYHUDJHDGMXVWHG5VTXDUHRIRXUGDLO\HTXDWLRQVLVHTXDOWR
The evidence on the intraday spread estimates for the benchmark 10-year BTP is plot-ted in Figure 4. The first fact that we note is that 2c is roughly W-shaped during the day. The spread has three peaks: at the open, before 14.30 and at the close. The peak between 14.00 and 14.30 (8.00-8.30 US Eastern Standard Time) is related to the market’s uncertainty con-cerning the opening prices of the United States financial markets. The peak may also be re-lated on some days to the upcoming release of United States’ macroeconomic indicators. This finding is analogous to previous evidence for MTS (Scalia, 1998a) and to the behaviour of the United States’ T-bond market (Fleming and Remolona, 1997). The second fact that we note is that the spread in period 2 is uniformly lower than in period 1. In particular, the spread in the initial and final intervals of the day declines from 2 to 1.4 basis points of price.
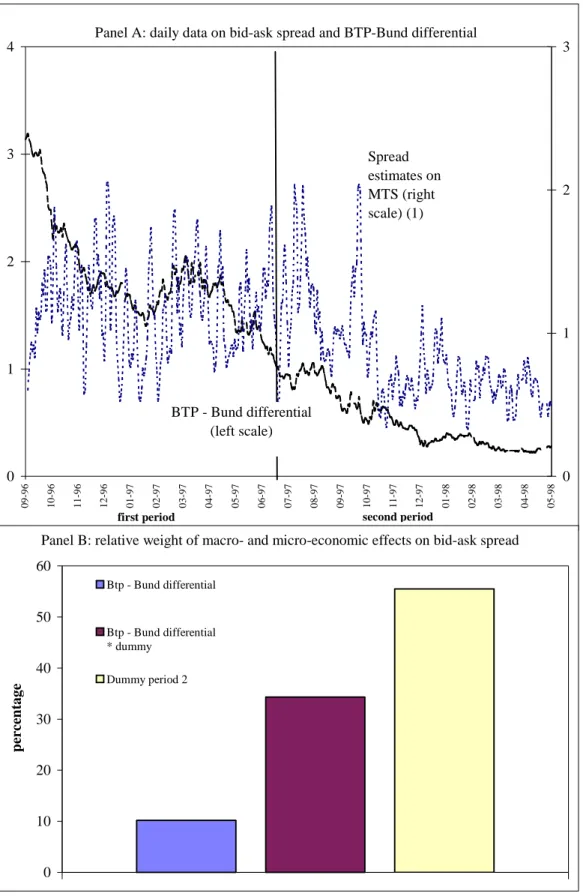
It may be argued that the estimated reduction of the spread, which is positively related to the asset’s expected volatility, may have been caused by the general improvement in the Italian Treasury bond market, brought about by the increase in Italy’s prospects for early par-ticipation in the EMU. This poses the problem of distinguishing the effects that MTS ano-nymity and the macroeconomic change have had on our market performance variables. As a control variable for macroeconomic improvement, we chose the 10-year BTP-Bund yield
dif-ferential14. Figure 5, Panel A shows the series of the estimated bid-ask spread and the
BTP-Bund yield differential on a daily basis. The yield differential fell from around 3 per cent in September 1996 to 1 per cent in July 1997, and fell again to 0.25 per cent in May 1998. The bid-ask spread series shows a declining trend in period 2. In that period the differential and
the spread are clearly associated15.
What are the relative weights of the micro- and macroeconomic effects on the spread? In order to provide an answer, we run a regression of the spread estimate over a constant, the differential, a dummy equal to 1 in the second period, and the product of the previous two
14 $QRWKHUSODXVLEOHSUR[\PLJKWEHWKHPDUNHWSHUFHLYHGSUREDELOLW\RI,WDO\ªVHDUO\SDUWLFLSD
WLRQ LQ WKH (08 7KLV HVWLPDWHG SUREDELOLW\ PHDVXUH DQG WKH %73%XQG VSUHDG DUH VWURQJO\ FRUUHODWHG
15 7KLV LV FRQILUPHG E\ D VLPSOH UHJUHVVLRQ RI WKH VSUHDG RYHU D FRQVWDQW DQG WKH GLIIHUHQWLDO
QRW UHSRUWHG IRU VLPSOLFLW\ :H DOVR SHUIRUP D &KRZ VWDELOLW\ WHVW WKDW WKH UHJUHVVLRQ FRHIIL FLHQWVDUHLGHQWLFDOEHWZHHQSHULRGDQGSHULRG7KHUHVXOWVVKRZWKDWWKHGLIIHUHQWLDOLVGL UHFWO\UHODWHGWRWKHVSUHDGKRZHYHUWKLVHIIHFWLVOLPLWHGWRSHULRGDQGWKHVWDELOLW\WHVWLV UHMHFWHG
variables. The weights are obtained as the product of the estimated coefficients by the aver-age value of each variable, as a percentaver-age of total. These weights are reported in Figure 5, Panel B. The weight of the microeconomic effect, related to the dummy variable, is equal to 56 per cent. The macroeconomic variable, i.e. the differential, accounts for 10 per cent, and the third variable (the differential times the dummy) accounts for 34 per cent. Adopting a cautious stance, and attributing the last estimate entirely to the macroeconomic effect, we ob-serve that the microeconomic effect accounts for over one half of the total improvement in the bid-ask spread from period 1 to period 2.
4.3 Market impact
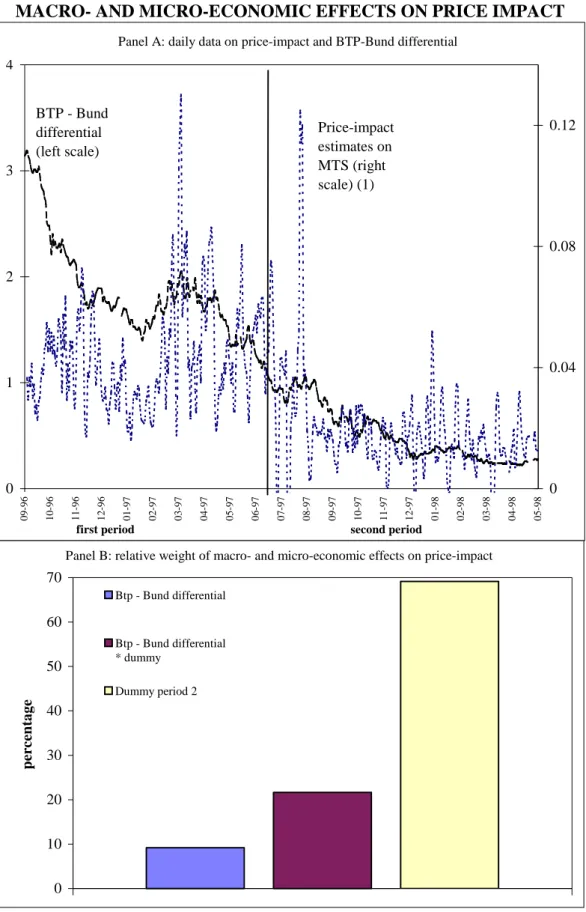
The intraday evidence on the estimates of the market impact λ is plotted in Figure 6.
The first finding is that in period 1 there are minor variations of λ during the day, whereas
in period 2 there is a tendency for market impact to increase in the early afternoon intervals.
The second finding is that λ is uniformly lower in period 2 than in period 1.
Has λ been influenced by the general macroeconomic improvement of the market?
Figure 7, Panel A shows the market impact series and the yield differential series. The evi-dence, again, is that the differential is positively related to the spread in period 2, but
unre-lated to it in the earlier period16.
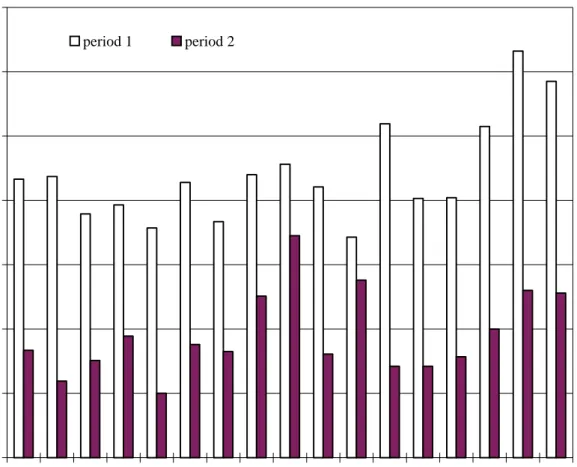
The results on the weights of the micro- and macroeconomic effects are given in Panel B, obtained with the same methodology of the previous subsection. The microeconomic ef-fect turns out to be extremely large, equal to around 69 per cent of the total price impact. The macroeconomic effect accounts for the remaining 31 per cent.
5. Volatility
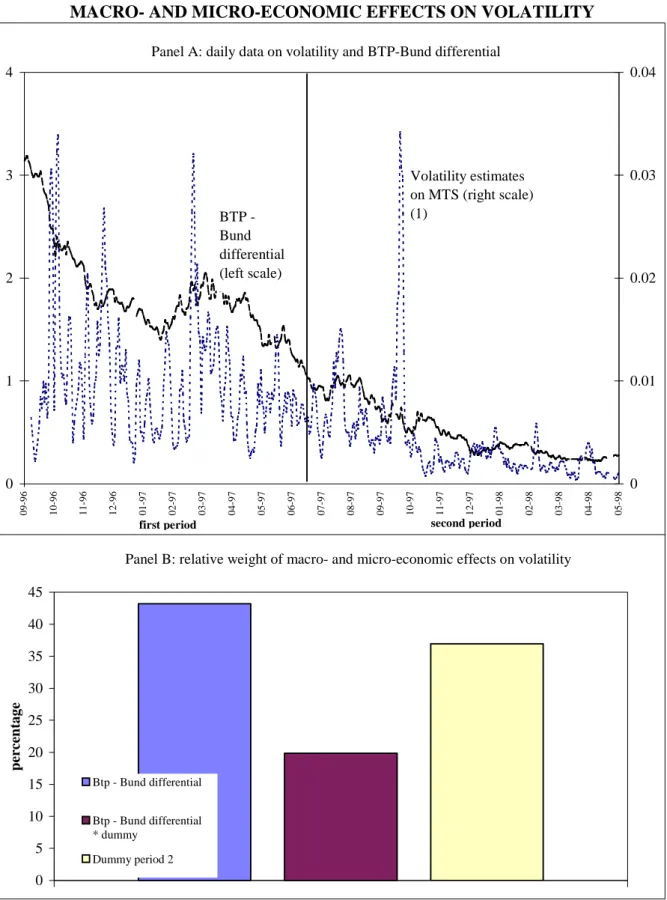
We estimate volatility on an intraday basis as the squared log-difference of the bench-mark 10-year BTP prices, taken at half-hourly intervals. The resulting evidence is presented
16
in Figure 8. Intraday volatility displays a U-shape. Although its estimate declines in the last interval of the day, we recall that the different length of the interval itself does not make the
corresponding value comparable to estimates for earlier intervals17. Volatility is largest in the
initial interval of period 1, when it is equal to 0.03 per cent. Throughout the rest of the day it is much lower, generally below 0.015 per cent, and it rises after 14.30. The second fact that we note is that volatility in period 2 is uniformly lower than in period 1. In particular, vola-tility in the first half hour of trading declines from 0.030 to 0.011. Moreover, after 14.30 the increase in volatility is less pronounced.
Figure 9, Panel A provides evidence on the relationship between the BTP-Bund yield differential and volatility on a daily basis. The picture is slightly different from the case of the spread and market impact. A direct relationship between yield differential and volatility is found; this is significant in period 2 only; however, the Chow stability test between peri-ods cannot be rejected. The evidence of Panel B is that the microeconomic effect has a weight of 37 per cent on volatility, i.e. much smaller than in the case of the cost measures, whereas the macroeconomic effect accounts for the remaining 63 per cent.
6. Efficiency
The notion of financial market efficiency implies that prices fully reflect all available information. As is well known, Fama (1970) distinguishes three types of efficiency: weak-form efficiency, which requires that no investor can earn excess returns based on historical price information; semi-strong-form efficiency, which implies that no investor can earn ex-cess returns by applying trading rules based on any publicly available information; and strong-form efficiency, which implies that no investor can earn excess returns using any type of information, whether public or private. While strong-form efficiency is unachievable if one accepts the view that information asymmetries are a relevant factor in explaining deal-ers’ behaviour, weak-form and semi-strong-form efficiency are in principle attainable by a financial market. In particular, the hypothesis of weak-form efficiency has been tested by
17 8QGHU WKH K\SRWKHVLV WKDW ERQG SULFHV IROORZ D %URZQLDQ PRWLRQ RXU VTXDUHG YRODWLOLW\
SUR[\LQWKHODVWLQWHUYDOVKRXOGEHPXOWLSOLHGE\ªª LQRUGHUWRH[SUHVVLWLQKDOIKRXUO\ WHUPV
empirical studies on leads and lags between cash and futures markets for the same security, in which prices are strictly correlated due to a no-arbitrage argument. The evidence in the case of bond markets is available for Japan and Italy. In Japan the JGS inter-dealer cash mar-ket is driven by the futures marmar-ket, with cash prices lagging behind the price of the 10-year JGS contract traded on the Tokyo Stock Exchange by two minutes on average (Miyanoya, Inoue and Higo, 1997). In the case of the Italian BTPs there is evidence of reciprocal causal-ity between the futures contract traded on LIFFE and the benchmark 10-year BTP traded on MTS in the years 1992-1993; furthermore, the futures lead cannot be exploited to earn excess returns on MTS, consistent with weak-form efficiency of MTS with respect to LIFFE (Scalia, 1998b; see also Angeloni et al., 1996).
Has MTS changed its record of efficiency with respect to LIFFE following its switch to anonymity? This question is relevant because traders in the two marketplaces are not fully integrated, particularly concerning their access to information on monetary policy imple-mentation, the Treasury’s issuing decisions and the order-flow. The empirical analysis that follows seeks to update previous evidence, while improving the type of data and the power of the causality test.
Our data sample includes all MTS transactions on the benchmark 10-year BTP and all
BTP futures transactions at LIFFE in the period from September 1996 to May 199818. We
also employ an intraday data-set, obtained from the Reuters service, that contains market prices and quotes at 5-minute intervals on the following financial instruments: the 3-month eurolira futures contract at LIFFE (last trade price), the Deutsche Mark/US Dollar exchange rate (last bid), and the 10-year Bund futures contract traded at LIFFE (last trade price). The general motive for the inclusion of these variables in a VAR analysis of causality is to take into account the behaviour of the world financial markets that potentially may explain the behaviour of BTP prices, i.e., we should like to include in a parsimonious way all the rele-vant information set. We observe that, compared with previous studies, we take a step from the notion of weak-form efficiency to that of semi-strong-form efficiency, which involves the predictability of prices based on all publicly available information. The specific reasons for
this set of variables are as follows. The short-term rate futures captures the attitude of do-mestic monetary policy. The DM/USD exchange rate is the reference exchange rate for Europe, reflecting the relative degree of monetary tightness between the United States and Germany. The Bund futures prices incorporate the attitude of investors towards the European fixed-income market.
After taking the log-differences of our intraday time series at 5-minute intervals (simple differences for the eurolira rate), for each day in our sample we ran a VAR system of equations in order to check if any pattern of causality emerges among the prices of our
finan-cial instruments, and in particular between BTP cash and futures prices19. The evidence on
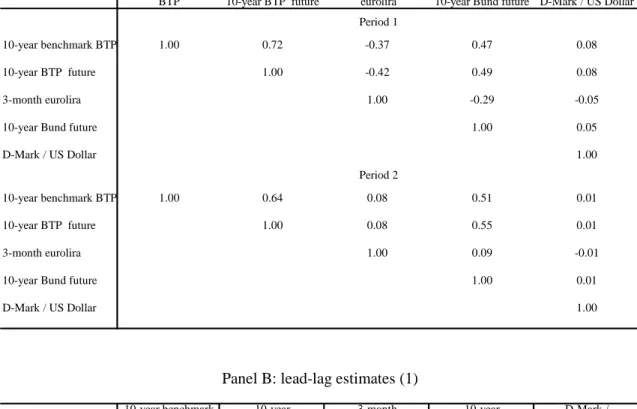
absolute contemporaneous correlation among variables is given in Table 3, Panel A. The evidence on the VAR estimates is contained in Panel B, which gives summary statistics (frequency and mean) on the coefficients that turned out to be significantly different from zero across all days. The maximum lag length with significant statistical power in both sam-ples is 10 minutes (two lags). However, since the second lag of variables turns out to be sig-nificant in a negligible number of cases, for ease of presentation the table reports only the evidence for the first lag of variables.
The key facts that emerge from our estimates are as follows. First, as with previous evidence from many financial markets world-wide, all our series display substantial mean-reversion at 5-minute intervals. In particular, the average mean-mean-reversion coefficient for the BTP cash price is -0.41 in period 1 and -0.35 in period 2; the averages for the BTP futures are -0.33 and -0.41, the averages for the eurolira rate are -0.33 and -0.31. Second, contempo-raneous correlation of price changes between cash and futures BTP is extremely high (0.72
and 0.64 on average in periods 1 and 220), as one would expect based on the no-arbitrage
principle. Third, causality between cash and futures BTP runs in both directions. In particu-lar, the 5-minute average lead of LIFFE declines from 0.39 to 0.34, while the average lead of MTS is almost unchanged, from 0.33 to 0.32. Furthermore, while the number of days in
19 7KH9$5PRGHOLVHVWLPDWHGLQWKHLQWHUYDO¥RSHQLQJKRXUVRI076RQDGDLO\
EDVLV7KHQXPEHURIODJVLVVHOHFWHGE\PLQLPLVLQJWKH$NDLNHLQIRUPDWLRQFULWHULRQ
20 7KH IDFW WKDW ZH XVH WKH EHQFKPDUN %73 ZKLFK LV QRW QHFHVVDULO\ WKH FKHDSHVWWRGHOLYHU
ERQG IRU WKH IXWXUHV FRQWUDFW GLPLQLVKHV WKH SRZHU RI WKH QRDUELWUDJH SULQFLSOH LQ RXU FDVH WKXVUHGXFLQJWKHFRUUHODWLRQEHWZHHQFDVKDQGIXWXUHV
which LIFFE displays a significant lead on MTS declines from 30 in period 1 to 18 in period 2, the corresponding frequency for the MTS lead increases from 17 days in period 1 to 25 days in period 2. Finally, there is evidence of positive two-way causality between price changes of the Bund futures, on one side, and of the BTP cash and futures, on the other side. Interestingly, we observe that contemporaneous correlation increases over time (from 0.47 to 0.51 for the benchmark BTP, from 0.49 to 0.55 for the BTP futures) and that causality from the Bund to the BTP becomes positive in a number of cases in period 2. These phenomena are consistent with the hypothesis that, thanks to the improvement in the prospects of first-round participation of the lira in the EMU, in period 2 the Italian and German bond markets have become more integrated.
Compared with the evidence on causality for the years 1992-1993, when the LIFFE lead over MTS was of 15 to 30 minutes with an intensity of 0.25-0.30, in recent years the lead has become much shorter, and the frequency of cases in which it is longer than 5 min-utes is just 4 days out of 309. The MTS lead has increased compared to 1992-1993.
7. Discussion and regulatory policy implications
We summarise the main empirical findings of the previous sections.
A. Small traders’ participation on MTS decreases from period 1 to period 2. B. Large traders’ participation increases.
C. Large trades on MTS become more frequent in period 2.
D. The share of OTC transactions over total inter-dealer trading increases slightly from period 1 to period 2.
E. The shape of intraday trading volume on the benchmark bond is slightly dis-placed towards the late trading intervals of the day, from period 1 to period 2.
F. The share of trading volume of the 50 per cent least traded bonds on MTS dou-bles from period 1 to period 2.
G. The intraday bid-ask spread is W-shaped, and the spread in period 2 is uniformly lower than in period 1.
H. The market impact λ is uniformly lower in period 2 than in period 1. I. Volatility is U-shaped and uniformly lower in period 221.
J. The increase in Italy’s prospects for early participation in the EMU is correlated to the improvement in spread, market impact and volatility in period 2, but virtually un-correlated to them in period 1. The macroeconomic effect explains between 31 and 63 per cent of the improvement in market performance.
K. Causality between BTP cash prices on MTS and futures prices at LIFFE runs in both directions.
L. From period 1 to period 2 the intensity of causality from either market becomes similar, the frequency of the LIFFE lead declines, the frequency of the MTS lead in-creases.
The first theoretical hypothesis that we made was that the smaller MTS traders, who are most likely to be liquidity motivated and uninformed, have been made worse-off by the market move to anonymity. Finding A is clearly consistent with the “liquidity trader’s curse”. Some small traders, although formally MTS members, may have withdrawn from active market participation because under anonymity they have less control on the “real game” played by the large traders, thus being unable to mirror their moves. It seems likely that ei-ther or both of the following phenomena may have occurred in period 2: (i) small players deal more frequently on an OTC basis through large dealers, and are prepared to pay a com-mission for the superior information possessed by the latter; (ii) small players participate more actively in the uniform-price auctions of Treasury securities. The counterpart to this are findings B and C, suggesting that the “large trader’s blessing” has indeed occurred. Under anonymity large traders are better able to carry out big inventory adjustments, which in pe-riod 1 were presumably executed on the OTC market.
The estimated increase in the share of OTC trading volume (finding D), although a small amount, is somewhat puzzling. It is the opposite of Hypothesis III. The “decline of
21 &RQFHUQLQJWKHILQGLQJV*+DQG,IRUFRQWUROSXUSRVHVZHDOVRUDQWKHHPSLULFDOWHVWVRQ PDUNHWOLTXLGLW\DQGYRODWLOLW\XVLQJDGLIIHUHQWVHWRIVHFXULWLHVQDPHO\WKHMXVWRIIWKHUXQ \HDU%73V,QDUDQNLQJRIGDLO\WUDGLQJYROXPHWKHVHERQGVJHQHUDOO\OLHEHWZHHQWKHWKDQG WKHWKPRVWWUDGHGLVVXHV7KHHYLGHQFHDYDLODEOHIURPWKHDXWKRUVFRQILUPVWKHILQGLQJVIRU WKH\HDUEHQFKPDUNERQGV+RZHYHUILQGLQJ(LVQRORQJHUREVHUYHGRQ\HDU%73V
OTC free-riding” hypothesis is actually related to two considerations. First, anonymity makes MTS more similar to the OTC inter-dealer-broker market. This increases ceteris pari-bus the incentives to trade on MTS. Second, under anonymity it becomes more difficult for the OTC market to free-ride on price and order-flow information provided by MTS. This phenomenon may cause an increase in trading cost on the OTC market, and may induce some dealers to trade directly on MTS. Are there any other reasons for the observed increase in OTC turnover? It is possible that the OTC inter-dealer brokers have reacted to the 1997 MTS shift, which increased competition between the two markets, by reducing spreads. We note an interesting example concerning competition between the OTC market and MTS. Cantor Fitzgerald, one of the major brokers trading Italian bonds from London, had often used MTS through an intermediary in the past; at the end of 1997, it applied for membership with MTS and in May 1998 it started trading large volumes directly on the Italian market. Since MTS prices reflect a more homogeneous market set-up, it is now conceivable that they can be straightforwardly applied to OTC transactions. If this is so, then OTC free-riding on MTS might have even increased after the MTS switch.
The fourth theoretical prediction that we investigated is the waiting game hypothesis of Foster and Viswanathan. Finding E is consistent with this hypothesis: under anonymity the order flow information of MTS has become less useful to dealers, and they tend to wait longer in order to extract more information. There is a further reason for the slight displace-ment of the intraday profile of trading volume in period 2. During our sample period the Italian market has become increasingly integrated with the other major financial markets. Among these, the US market is an important source of information and it has been a growing source of investment into the Italian market. Hence, the information and orders that start ar-riving on MTS from 14.30 onward, i.e. from the opening of the US market and the release time of most US macroeconomic indicators, have increased over time, and this clearly con-tributes to the observed shift in intraday trading volume on MTS.
Findings F to L represent in our opinion impressive evidence on the improvement in the performance of MTS in recent years. In interpreting these results, we face an attribution problem. As we argued earlier on, two distinct factors may have played a role, namely the switch to anonymity, a one-time event that took place in the middle of 1997, and the steady
progress of public finance of 1996-1997. We tried to distinguish between these two factors, and obtained results that show that the macroeconomic effect accounts for 31 to 63 per cent of the variation in the market performance variables. In the case of the two cost measures, the microeconomic effect is more important. In the case of volatility, the macroeconomic effect takes first place. This is not surprising, since market volatility may be expected to be more sensitive to macroeconomic conditions than trading costs.
An additional factor that may have played a role is the listing of repo contracts on MTS starting in December 1997. Repo contracts on Treasury bonds have been traded among deal-ers on the OTC market for long before that date. However, cash traddeal-ers greatly benefited from the inception of repo trading directly on MTS, through a reduction in the cost of set-ting-up short positions. This may help explain why the speed of price discovery on MTS has increased with respect to the futures market (findings K and L).
From a regulatory point of view, the evidence presented in this paper has several impli-cations. The first implication is domestic. The move to anonymity has furthered the reform process of the Treasury bond market that the Italian regulatory authorities initiated in 1994 (see the Appendix table). This reform was aimed at restoring the competitive role of MTS with respect to the OTC market, by opening up the former to foreign investors, lowering transaction costs and promoting competition among dealers. Since 1994 MTS has greatly in-creased efficiency and turnover relative to the OTC market. As we have shown, the 1997 shift helped to enhance this competition, affording higher levels of welfare for those who in-vest in Italian Treasury bonds. The improvement of the secondary market should also have benefited the issuer, through a reduction in the cost of debt servicing. We conclude that the 1997 innovation on MTS has proved successful.
The second regulatory implication follows from the first one. Looking at the Italian Treasury bond market from a more general perspective, we note that the market has made a remarkable progress in just one decade, from an opaque, lowly liquid market with negligible foreign participation to a highly transparent and liquid market with a large participation of international investors. This progress has been similar in nature to developments in other in-dustrialised countries, but in the Italian case it has been more intense. To this extent, MTS
has played a key role. The ideas that have underlain the MTS inception and development have proved successful in the medium-term. These ideas are: (i) full automation of the trad-ing mechanism; (ii) transparency; (iii) large participation, (iv) inside and outside competi-tion. We believe that the experience of MTS may be useful for those emerging countries wishing to establish a liquid and efficient financial market in a relatively short time horizon.
In 1998 the market was fully privatised A major development took place in September 1998, namely the listing of a eurolira 10-year bond issued by the European Investment Bank
and of a large group of German government bonds22. The listing of sovereign bonds from
other countries is also planned. In the perspective of EMU, it has been argued that the likely integration of the European bond markets might imply either a strong cooperation among sovereign issuers, or a “race to benchmark status” (McCauley and White, 1997). In both cases, the role of each country’s government bonds within the European market will be posi-tively affected by the liquidity conditions of the domestic market and by the availability of the securities in the portfolios of international investors, even more than by the creditworthi-ness of the issuer. In this view, the improvement in the liquidity of MTS, along with the de-cision by the Italian Treasury to convert all outstanding debt in euros on 1st January 1999, places the Italian issues in a strong position among the partner countries’ issues.
8. Conclusion
We analysed a change in the organisation of the electronic inter-dealer market for Ital-ian Treasury bonds known as MTS, namely the shift to the anonymity of quotes in July 1997. The implications of this event were investigated in the light of market microstructure theory and from a public welfare perspective. We employed an extensive data-set which includes all transactions carried out on MTS with the identity of the traders, in the period from Septem-ber 1996 to May 1998. In addition, we used intraday prices for the BTP futures contract traded at LIFFE and for a set of financial instruments that may be viewed as explanatory variables for the dynamics of BTP prices. Our evidence supports the hypothesis that the
22 &RQWUDFWV RQ WKHVH ERQGV DUH FOHDUHG DQG VHWWOHG WKURXJK LQWHUQDWLRQDO GHSRVLWRU\ HQWLWLHV
crease in transparency makes liquidity traders worse-off, whereas large/informed traders find it less costly to execute block trades. The evidence is also consistent with the “waiting game” hypothesis of Foster and Viswanathan (1996) on intraday trading: under anonymity, traders tend to delay their trades in an attempt to acquire information through the order flow. From a public welfare perspective, our results indicate that the move to anonymity has been accom-panied by an increase in market liquidity and by a reduction in volatility, a phenomenon that is also partly explained by the growth in Italy’s prospects for early participation in the EMU. The speed of information aggregation on MTS increases, as shown by an improvement of the MTS lead over the futures market. From a regulatory policy perspective our evidence sug-gests that, despite the welfare loss suffered by small traders, the move to anonymity has af-forded an overall improvement in market performance. In this respect, the experience of MTS may be useful for the development of market mechanisms in emerging countries. Fi-nally, in a European perspective, the current organisation and performance of MTS place the market in a competitive position compared to other cash markets for government bonds, and may contribute to a closer integration of these markets under the EMU.
Table 1
DEALERS’ PARTICIPATION ON MTS
Period 1 Period 2 p-value > t (1)
Number of traders with a market share of: (2)
less than 0.1 per cent 15 3
0.1 - 0.25 per cent 110 84
0.25 - 0.5 per cent 59 65
0.5 - 1 per cent 34 41
1 - 2.5 per cent 27 30
2.5 per cent or more 15 18
Total 260 241
Herfidahl concentration index 1) among all traders
daily average (%) 3.2 3.8 0.00
(standard deviation) (0.7) (1.0)
2) among market makers
daily average (%) 5.0 5.8 0.00
(standard deviation) (0.9) (1.0)
(1) A p-value at or below 0.05 implies rejection of the null hypotesis of identical means by the t -test. - (2) The traders’ shares are daily averages (213 days for period 1, 221 days for period 2).
Table 2
MONTHLY TRADING VOLUME ON OTC MARKET AND MTS
(Trillion lire and percentage values)
OTC (1) MTS OTC share on total (%)
1996 Sep 310 812 27.6 Oct 393 915 30.1 Nov 326 892 26.7 Dec 284 717 28.3 1997 Jan 343 1136 23.2 Feb 360 834 30.2 Mar 356 735 32.6 Apr 396 898 30.6 May 463 1048 30.6 Jun 528 946 35.8 Jul 508 854 37.3 Aug 322 562 36.4 Sep 455 898 33.6 Oct 457 928 33.0 Nov 363 730 33.2 Dec 355 611 36.8 1998 Jan 297 658 31.1 Feb 295 621 32.2 Mar 379 726 34.3 Apr 296 566 34.4 May 315 481 39.6 (1) Estimated values.
Table 3
INTRADAY EVIDENCE ON PRICE CAUSALITY
(Averages of daily estimates) Panel A: contemporaneous correlations
10-year benchmark
BTP 10-year BTP future
3-month
eurolira 10-year Bund future D-Mark / US Dollar Period 1
10-year benchmark BTP 1.00 0.72 -0.37 0.47 0.08
10-year BTP future 1.00 -0.42 0.49 0.08
3-month eurolira 1.00 -0.29 -0.05
10-year Bund future 1.00 0.05
D-Mark / US Dollar 1.00
Period 2
10-year benchmark BTP 1.00 0.64 0.08 0.51 0.01
10-year BTP future 1.00 0.08 0.55 0.01
3-month eurolira 1.00 0.09 -0.01
10-year Bund future 1.00 0.01
D-Mark / US Dollar 1.00
Panel B: lead-lag estimates (1)
10-year benchmark BTP 10-year BTP future 3-month eurolira 10-year Bund future D-Mark / US Dollar Average (2) No. days (3) Average (2) No. days (3) Average (2) No. days (3) Average (2) No. days (3) Average (2) No. days (3) Period 1 10-year benchmark BTP -0.41 38 0.39 30 -0.81 19 -0.10 20 0.18 12 10-year BTP future 0.33 17 -0.33 28 -1.37 11 -0.02 20 0.19 8 3-month eurolira -0.03 18 -0.08 34 -0.33 85 -0.01 15 -0.03 10
10-year Bund future 0.17 11 0.27 22 -0.41 15 -0.32 36 0.09 10
D-Mark / US Dollar 0.08 13 0.00 11 -0.50 8 0.17 13 -0.27 37
Period 2
10-year benchmark BTP -0.35 35 0.34 18 0.12 9 0.29 17 0.11 9
10-year BTP future 0.32 25 -0.41 39 0.10 8 0.32 21 0.13 7
3-month eurolira 0.04 12 0.08 14 -0.31 56 0.01 8 0.00 4
10-year Bund future 0.15 18 0.20 20 0.34 9 -0.34 27 -0.01 9
D-Mark / US Dollar -0.07 9 0.31 6 0.11 5 0.30 21 -0.25 18
(1) Causality at 5-minute level runs from the variables along the top row to the variables along the first column on the left. Due to gaps in the intraday series, 159 days and 150 days were employed for the estimates respectively in period 1 and in period 2. - (2) Ave-rage estimated causality over the days where the estimated causality is non-zero with 95% confidence. - (3) Number of days in which the estimated causality is non-zero with 95% confidence.
Figure 1
BLOCK TRADES ON MTS AS A SHARE OF TOTAL TRADING VOLUME
(1) A block trade is assumed whenever the net daily change in a trader’s holding of an issue is worth at least 50 billion lire. - (2) A block trade is assumed whenever the net daily change in a trader’s holding of an issue is worth at least 100 billion lire.
0% 10% 20% 30%
09-96 10-96 11-96 12-96 01-97 02-97 03-97 04-97 05-97 06-97 07-97 08-97 09-97 10-97 11-97 12-97 01-98 02-98 03-98 04-98 05-98
first period second period
Panel A: threshold = 50 billion lire (1)
0% 10% 20%
09-96 10-96 11-96 12-96 01-97 02-97 03-97 04-97 05-97 06-97 07-97 08-97 09-97 10-97 11-97 12-97 01-98 02-98 03-98 04-98 05-98
first period second period
Figure 2 MTS: INTRADAY TRADING VOLUME
ON 10-YEAR BENCHMARK BTP (1)
(1) Data are averages of shares of daily volume. The Kolmogorov-Smirnov test rejects the null hypothesis of identical distributions in period 1 and 2 for 9 out of 17 intervals, at 5% level. The t -test rejects the null hypothesis of identical means for 6 out of 17 intervals, at 5% level.
0 2 4 6 8 10 901 902 1001 1002 1101 1102 1201 1202 1301 1302 1401 1402 1501 1502 1601 1602 1701
half hour intervals
percentage
Period 1
Figure 3
LEAST LIQUID BONDS ON MTS:
NUMBER OF ISSUES AND SHARE OF TRADING VOLUME
(1) The Kolmogorov-Smirnov test rejects the null hypothesis of identical distributions in period 1 and 2 at 5% level. The t -test rejects the null hypothesis of identical means at 5% level.
0 5 10 15 20 25 09-96 10-96 11-96 12-96 01-97 02-97 03-97 04-97 05-97 06-97 07-97 08-97 09-97 10-97 11-97 12-97 01-98 02-98 03-98 04-98 05-98 p ercen tage 30 35 40 45 50 55 60 65 70 75
Share of trading volume, left scale (1)
No. of issues, right scale
Figure 4 INTRADAY SPREAD ESTIMATES ON 10-YEAR BENCHMARK BTP (1)
(1) Data are in basis points. See equations (1) and (2) in the text. The Kolmogorov-Smirnov test rejects the null hypothesis of identical distributions in period 1 and 2 for 16 out of 17 intervals, at 5% level. The
t -test rejects the null hypothesis of identical means for 16 out of 17 intervals, at 5% level.
0 0.5 1 1.5 2 2.5 901 902 1001 1002 1101 1102 1201 1202 1301 1302 1401 1402 1501 1502 1601 1602 1701 period 1 period 2
Figure 5
MACRO- AND MICRO-ECONOMIC EFFECTS ON BID-ASK SPREAD
(1) Spread estimates on MTS, in basis points, are moving averages over three days.
0 1 2 3 4 09-96 10-96 11-96 12-96 01-97 02-97 03-97 04-97 05-97 06-97 07-97 08-97 09-97 10-97 11-97 12-97 01-98 02-98 03-98 04-98 05-98 0 1 2 3 Spread estimates on MTS (right scale) (1) BTP - Bund differential (left scale)
Panel A: daily data on bid-ask spread and BTP-Bund differential
first period second period
0 10 20 30 40 50 60 p ercen tage Btp - Bund differential Btp - Bund differential * dummy Dummy period 2
Figure 6 INTRADAY PRICE IMPACT ESTIMATES
ON 10-YEAR BENCHMARK BTP (1)
(1) Basis points per 1 billion lire order size. See equations (1) and (2) in the text. The Kolmogorov-Smirnov test rejects the null hypothesis of identical distributions in period 1 and 2 for 17 out of 17 intervals, at 5% level. The t -test rejects the null hypothesis of identical means for 15 out of 17 intervals, at 5% level.
0 0.01 0.02 0.03 0.04 0.05 0.06 0.07 901 902 1001 1002 1101 1102 1201 1202 1301 1302 1401 1402 1501 1502 1601 1602 1701 period 1 period 2
Figure 7 MACRO- AND MICRO-ECONOMIC EFFECTS ON PRICE IMPACT
(1) Price-impact estimates on MTS, in basis points, are moving averages over three days.
0 1 2 3 4 09-96 10-96 11-96 12-96 01-97 02-97 03-97 04-97 05-97 06-97 07-97 08-97 09-97 10-97 11-97 12-97 01-98 02-98 03-98 04-98 05-98 0 0.04 0.08 0.12 Price-impact estimates on MTS (right scale) (1) BTP - Bund differential (left scale)
Panel A: daily data on price-impact and BTP-Bund differential
first period second period
0 10 20 30 40 50 60 70 percentage Btp - Bund differential Btp - Bund differential * dummy Dummy period 2
Figure 8 INTRADAY PRICE VOLATILITY ON 10-YEAR BENCHMARK BTP (1)
(1) The Kolmogorov-Smirnov test rejects the null hypothesis of identical distributions in period 1 and 2 for 17 out of 17 intervals, at 5% level. The t -test rejects the null hypothesis of identical means for 16 out of 17 intervals, at 5% level. 0.000 0.005 0.010 0.015 0.020 0.025 0.030 0.035 901 902 1001 1002 1101 1102 1201 1202 1301 1302 1401 1402 1501 1502 1601 1602 1701 (x 10,000) period 1 period 2
Figure 9
MACRO- AND MICRO-ECONOMIC EFFECTS ON VOLATILITY
(1) Volatility estimates on MTS, in basis points, are moving averages over three days.
0 1 2 3 4 09-96 10-96 11-96 12-96 01-97 02-97 03-97 04-97 05-97 06-97 07-97 08-97 09-97 10-97 11-97 12-97 01-98 02-98 03-98 04-98 05-98 0 0.01 0.02 0.03 0.04 Volatility estimates on MTS (right scale) (1) BTP - Bund differential (left scale)
Panel A: daily data on volatility and BTP-Bund differential
first period second period
Panel B: relative weight of macro- and micro-economic effects on volatility
0 5 10 15 20 25 30 35 40 45 p ercen tage Btp - Bund differential Btp - Bund differential * dummy Dummy period 2
Appendix
The Development of the Italian Government Bond Market in the Last Decade
Year International integration Changes in market microstructure
New instruments
1988 Liberalisation of capital flows (partial) Inception of MTS
Start of regular reopenings of Treasury auctions
Floor to bid prices abolished for T-bills, uniform price auction intro-duced for other bonds
1990 Liberalisation of capital flows (full) Real-time securities transferral at the central depository (Banca d’Italia)
1991 10-year BTP futures at LIFFE (London)
1992 Inception of the Italian futures
market (MIF)
1993 First US$ global bond issue by the Re-public of Italy
First issuance of 30-year BTPs
Prohibition of direct financing of the Treasury by the Banca d'Italia
1994 Reform of MTS Treasury starts publishing timetable of auctions
Electronic bid submission at auc-tions
Reserved reopenings for
"specialists in government securi-ties"
Continuous trading on MOT, the electronic retail market
1995 First issuance of CTZs (2-year zero
coupon bonds)
CCT indexation fully matched with contemporaneous 6-month bills 1996 EU Investment Service Directive made
effective
1997 Withholding tax abolished for foreign investors
Monitoring functions to the MTS management board
Treasury bond repo trading starts on MTS
Remote access to MTS for foreign pri-mary dealers
1998 First ad hoc reopenings of Treasury auctions
Book-entry system for all new Treasury issues