A Comparative Study on Moving Object Detection and
Tracking Methods
Vivek Shukla, Dhirendra Pandey, Raj Shree & Ashwani Kant Shukla
Abstract
Moving object detection and tracking has great application in the field of computer vision. Patient monitoring, human–computer interplay is the newly developed methods of the human motion detection and their classification. Now it is recently applied in vehicle motion detection by detecting vehicle as per shape, color and speed. Initially the method is applied to identify the specified object is available in the video frame or not. There are three essential stages of data processing in object detection that are: Correct recognition of object, Characteristics of object and object tracking. Tracking requires the point of location and defined shape of an object in every frame. In this review paper we have studied various object detection and tracking methods that are used to classify, detect and track the object in different situations e.g. shadow region, crowded areas, occluded object and hazy background image (Alexe, Deselaers, Ferrari, 2010).
Keywords: Moving object detection, Object Tracking, Object extraction, Object classification.
In a computer vision moving object detection and tracking is a still active and an open research area due to daily advancement in this field, we identify and track objects over an image classification that tries to determine by using of, identify and track object on the classification of the images and also by human operators to analyze and monitor the developing of the camera by changing the old techniques that make try to explain the nature of object (Ess, Leibe, 2009; Zhang, Sun, Fu, Wang, Wang, 2014). Basically object detection and tracking monitoring mechanism, vehicle navigation, autonomous robot navigation, video, etc. Object detection includes the correct position of the objects in the frame of a video classification. Object tracking is needed in more efficient applications that provide the correct position and shape of object (Nimo, Lopez, Sappa, Graf, 2010). Each object tracking techniques emerge to be the first video where each frame or objects while the object detection techniques are required. In moving object detection and tracking the initial step is to detect the specified moving object and track in successive frames. Interplay moving objects detection, frame, frame such as object tracking and analysis is to detect their nature (Leibe, Seemann, Schiele, 2005; Freeman, Roth, 1995).
The further stage is moving object detection and tracking, which can be characterized as the result of environment correspondence among detected object from one frame to another frame. This can be happened due to the incorrect division in the present frame or incorrect division in the past frame, or perhaps because of an object coming into another object in the frame sequence (Gavrila, Giebel, Munder, 2004).
Method Comparison
The methods described below for moving object detection and tracking have some advantage and disadvantage:
Table 1 – Method Comparison
Methods Advantage Disadvantage Object Identified
Background
subtraction methods
Simple to implement. A background can
combine with
existing background without changing in features.
Smart method that
doesn’t require
reprogramming. Easy to implement with any method.
Fast recovery
process.
Less space
requirement.
Rate of precision is very less.
Tough to manage in
quick changes in
frame.
Initializing the
Gaussians is
important.
It not a decent method when shadow or some other obstacles in background.
In some cases gives false positives.
It not suitable with multi-model
background.
Any targeted object
Real Time
Background
Subtraction and
Shadow Detection Technique Theory
Precision is more better than frame differencing
It detects shadow as Well.
It’s a little complex method.
Target foreground objects
Optical Flow
It can produce the complete Information of moving object
containing good
precision.
Require large amount of calculation.
Flow vectors of
moving objects
over time to detect moving regions in an image
Frame Differencing
Good for static
background. High precision. Very simple method
Background without moving objects.
Low to moderate
computational time.
comparisons
between two
successive frames to detect moving targets
Motion based It does not require
detection of
predefined motion patterns.
Struggles to
distinguish a non-moving human object.
Number of moving objects in each frame
Point Tracking
Handle occlusion and misdetection.
Track points in noisy images.
Easy to manage with adding new object and exit existing object.
Assume no object
entries and exists. State is distributed by Gaussian.
Computationally exponential both in time and memory.
Solves the problem of Kalman Filter.
State of a single object is estimated.
Kernel Tracking Robust to occlusion, clutter, distraction.
Spatial information of the target is lost cannot give good performance when an object & its
background have
similar color.
Efficient to
occlusion.
Silhouette tracking
Object Shape is
Implicitly modeled. Less sensitive to appearance changes.
Training is required
Shape essentially modeled.
Table 1: Method Comparison of Object Detection and Tracking ( Tan,Wang, Maybanks, 2004; Zhou, Yang, Yu, 2013; Chaohui, Xiaohui, Shuoyu, Zheng, Min., 2007).
Conclusions
It is not easy task to take one method for detecting all type of images, nor can all methods gives the result with high precision for specific types of image. Moving object detection in video image captured from single camera with static or moving background that means fixing camera at appropriate place that to achieve better results by applying background subtraction method to extract and classify the features. There are many methods present to detect and track the moving object by using a single method but is very challenging task, less precision and decrease the performance of system. To solve the identified problems with high quality and accuracy with better performance that needs to develop smart real time moving object detection and tracking system by combining of the multiple techniques to make use of it together according to the application.
References
Alexe, B., Deselaers, T., and Ferrari, V. (2010). What is an object? In Computer Vision and Pattern Recognition (CVPR). IEEE Conference on (San Francisco, CA: IEEE), 73–80. doi:10.1109/CVPR.2010.5540226.
Andreas Ess, Bastian Leibe. (2009). Robust Multiperson Tracking from a Mobile Platform,
IEEETransactions on Pattern Analysis and Machine Intelligence, Vol. 31, No. 10.
Bastian Leibe, Edgar Seemann, and Bernt Schiele. (2005). Pedestrian Detection in Crowded Scenes. IEEE Conference on Computer Vision and Pattern Recognition, pp. 1063-1072. D. M. Gavrila, J. Giebel, and S. Munder. (2004). Vision-based pedestrian detection: the protector system. IEEE Intelligent Vehicles Symposium, Parma, Italy.
David Gero nimo, Antonio M. Lopez, Angel D. Sappa, and Thorsten Graf. (2010). Survey of Pedestrian Detection for Advanced Driver Assistance Systems. IEEE Transactions on Pattern Analysis and Machine Intelligence, Vol. 32, No. 7.
Wanceng Zhang, Xian Sun, Kun Fu, Chenyuan Wang, and Hongqi Wang. (2014). Object Detection in High- Resolution Remote Sensing Images Using Rotation Invariant Parts Based Model. IEEE Geoscience And Remote Sensing Letters.
W.-M. Hu.T.-N. Tan, L.Wang and S. Maybanks. (2004). A survey on visual surveillance of object motion and behaviors. IEEE trans. On systems, Man and Cybernetics-Part C: Applications and Reviews, vol.34, no.3, pp.334- 352.
W. T. Freeman and M. Roth. (1995). Orientation histograms for hand gesture recognition.
Zurich, Switzerland, pages 296–301.A COMPARATIVE STUDY ON MOVING OBJECT
DETECTION AND TRACKING METHODS 7
Xiaowei Zhou, Can Yang, and Weichuan Yu. (2013). Moving Object Detection by Detecting Contiguous Outliers in the Low-Rank Representation. IEEE Transactions On Pattern Anlysis And Machine Intelligence.
Markeing Of Banana In Pudhukkottai District-A Current
Scenario
Dr.N.Palanivelu
V.Sougoumarin
Introduction
Banana being a highly perishable fruit is to be marketed within a short span of time. Therefore, a systematic package of practices in banana production will greatly improve productivity and enable the growers to reap maximum benefit. Similarly a well-organised marketing system for banana will give a suitable reward to people actually participating in the system. Marketing cost is the cost incurred in cleaning, packing, transporting and other incidental charges paid in marketing the produce. It is the actual expenses incurred in bringing goods and services from the producer to the consumer. The marketing cost is a vital factor in determining the profitability of the banana growers and middlemen. The first of banana exports to Europe will start in a couple of months through separate private initiatives in Tamil Nadu. This will eventually open the doors to markets in the West for the local varieties.
One, the Trieste Port Authority in Italy is funding a project by the Tamil Nadu Banana Growers Federation, which is working with the Tamil Nadu Agriculture University, to standardise harvesting and post-harvest facilities for banana exports.
Austrian interest
Through another project, a buyer based in Vienna, Austria, keen on Indian varieties for the local markets there, is supporting Tirupur-based fruits exporter Ka Ve Ezhilan of Greeneers Agro Products India. The exporter is partnering with the National Research Centre for Banana (NRCB) and a consultant in IIT-Madras for a cable conveyor for moving harvested bananas to the pack house.This equipment has been demonstrated to the buyer who has approved the idea, he said.
Ezhilan, who is, on his own initiative, investing over ₹10 crore in a pack house for fruits exports in Pollachi, says the first consignment of about 100 kg of Grand Naine variety of banana will be airlifted by the month-end. Then, exports will be stepped up and by September a 20-tonne consignment of the fruit will be shipped out. The objective is to move about 150 such containers a year.
Ezhilan says farmers can benefit from a 20-25 per cent increase in prices as compared with the ₹15-20 a kg they get now.
Tapping the West
Theni in Tamil Nadu is a major banana cultivation centre but exports are primarily restricted to Gulf countries and South-East Asia, targeting overseas Indians. But now, exporters are targeting developed markets in Europe. While initially, the Cavendish banana will be shipped, he plans to popularise local varieties including Red Banana, Poovan and Kathali.G Ajeethan, General Secretary, Tamil Nadu Banana Growers Federation — who is backed by
Asst Professor, Dept of commerce, GASC,Peravurni
the Trieste Port Authority — says, as of now, there is no common infrastructure facility meeting European norms for banana exporters in the State.
For freshness
The Port Authority is funding the Federation and the Agriculture University about ₹1.25 crore to establish a rope conveyor facility in a selected banana farm. The major challenge is to minimise human handling during harvest and post-harvest to maintain the freshness of the fruits at destination. By mid-June, Ajeethan expects to ship out the first of the consignments to Europe. The consignment will initially be airlifted through Kochi or Bangalore, he said.S Uma, Director & Convenor, NRCB, said a team at the centre has designed the protocol for sea shipments of Nendran variety of bananas to Dubai. This was a Public-Private Partnership project with a Kochi-based exporter, Fair Exports India and the Agriculture and Processed Food Products Export Development Authority, New Delhi.
While airlifting can be costly, protocols have to be designed for sea shipments as the fruits will be in transit for up to three weeks. Now, nearly 20 tonnes of Nendran are being shipped out weekly. This has helped to bring down prices for overseas consumers who now pay about ₹125 a kg compared to ₹150 for air cargo consignments. Farmers too benefit as they get ₹5-10 more per kg.
Objectives Of The Study
The main objectives of the study are to find out the various problems faced by the banana growers and to identify the factors influencing the satisfaction of banana growers. Under these main objectives have been framed for the present study.
• To study the production practices of the selected banana in the study area.
• To evaluate the marketing practices followed by the growers of the selected banana.
• To analyze the various problems faced by the banana growers. Sampling Design
The present study proposes to cover the production and marketing of banana in Pudhukkottai District. As census method is not feasible, the researcher has proposed to follow sampling. It is decided to select the banana which are cultivated in more than 200 Acres in Pudhukkottai district. The present study selected 5 bananas namely poovan, Rusthali, Moris, Appel bananas and Cavendish bananas in cultivated in the district. These banana are mainly cultivated in all blocks of the district. Pudhukkottai District Consist of Alangudi,Vadakadu, Pudhukkottai, Thirumayam, and one block Karakbakkudi, A selection of 240 banana growers is made on a simple random basis at the rate of 40 from each Taluks and One block. Sources Of Data
Tabel No:1.1: AVERAGES OF VARIABLE COSTS FOR PRODUCTION OF BANANA IN PUDHUKKOTTAI DISTRICT
Machinery Paid
Labour
Family
Labour Materials Subtotal Percentage
Land Preparation
144 56 48 288 536 6.2
Planting 108 308 38 268 722 8.4
Weed control 24 1142 64 274 1072 19.8
Irrigation 60 0 48 734 842 9.8
Fertilization 2 76 14 232 322 3.8
Pest control 142 0 74 430 648 7.5
Harvesting 0 1234 812 456 2542 29.6
Marketing 428 0 672 124 1224 14.2
Other 18 30 0 0 48 0.5
Total 926 2844 1768 3046 8584 100.0
Source: Agricultural Department in Pudhukkottai District
It is inferred from table 1.1 that around one third of the variable cost is incurred for harvesting. It stands first rank in the variable cost of production of tomato. The variable cost weed control occupies the second position. It is interesting and worthy to note that the labour force used for production and marketing and marketing of tomato t is around two sixth of the total variable cost of the tomato in Pudhukkottai district. It indirectly generates employment opportunity. The present study reveals that the growers of tomato in this study area provide employment opportunity to the agricultural laourers in Pudhukkottai district. Marketing Practices
Marketing is a crux of production problems, success of production of any crop depends upon its successful marketing. The selected banana are specialized crop grown in the Pudhukkottai district of Tamilnadu.
Marketing efficiency to a large extent depends upon production and cultivation practice. In Indian economy agriculture sector predominates not due to overwhelming share of the nation’s product output also due to providing employment to a spacious sector of population.*
Generally, the grower’s entire is handed over to one or a small number of middlemen for marketing his produce. As it is seldom possible for the producer to market himself all his profuse, the service of the intermediaries is inevitable. Accelerated growth of agriculture mainly depends upon the provision of farm and non –farm services. Among the nonfarm services Marketing is the most important.
Institutional Aspect Of Market Structure
The institutional aspect of market structure refers to the marketing channel or links of different functionaries involved in the process of marketing in other words marketing channel refers to the flow of the produce from the point of production to the final consumption involving assembling wholesaling re-whole saling and retailing. It is pertinent to examine the channels through which the produce reaches the final consumer as it may have some bearing on the growers on the growers share in the consumer’s rupee.
It should be noted that the commission agent is a common intermediary, which connects two important stages of marketing, i.e., assembling and wholesaling and its subsequent stages. for example, more than one channel may exist up to wholesaling i.e., the product may be sold either directly by the grower himself or through the village merchant or the pre-harvest contractor, but the channel involved after wholesaling may be common i.e., through the retailer to the final consumer. Similarly, only one channel may exist up to wholesaling i.e., direct sale by the grower through and /or to the commission agent and after wholesaling, more than one channel may exist whereby the produce reaches the final consumer either through re – Wholesalers or through retailers or the hawkers.
Market Awareness
It refers to the knowledge of different market situations in general and prices in particular on the part of the growers as well as the market information, which guides the growers as to when, where, whom and how to market the produce to their best advantage. The market rareness and the capacity of the growers to sell their advantage can be judged in terms of certain factors like place of sale, agency of sale and time of sale.
The Place Of Sale
This implies whether at the field itself or at the primary markets or at the Pudhukkottai wholesale market. The analysis pertaining to this may provide some insight about the factors associated with the place of sale on the part of the growers.
Agency Of Sale
It refers to the functionaries involved in the process of marketing As is seen from the previous section, the produce is marketed through various channels involving various functionaries and they differ from produce to produce.
Among the selected banana, except brinjal and lady’s finger, most of the growers sell their produce through the commission agents at the Pudhukkottai wholesale market, mainly due to comparatively higher price as compared to prices at the primary level. In the case of moringa, it is sold mostly to the pre – harvest contractor. Selling the produce to village merchant by the growers also exist in the case of tomato and onion.
Time Of Sale
Time of sale refers to as to when the growers sell their produce i.e., whether they sell during immediate post – harvest period or store in order to fetch better prices. Only onion comes under the purview of storage because of their comparatively less perishable nature. The growers of onion store the produce in order to realize better prices, the period of storage ranges between weeks to six weeks. Although the practice of storage on the part of the growers of the banana is widely prevalent irrespective of the size of holding, the factors compel the growers not to store for reasonably longer period are urgent need of cash, lack of storage facilities / and finally the loss in storage (both due to loss in weight and spoilage). The loss in storage has been reported to be 5 per cent in the case of onion, depending upon the period of storage. The urgent need of cash and the lack of storage facilities to a large extent and spoilage to some extent compel the onion growers not to store the produce for a considerably long period.
Disposal Of Banana In Short Time
There are many reasons such as (i) Most of the banana, especially leafy ones are highly perishable in nature (ii) Storage facilities are inadequate. (iii) processing facilities are inadequate. (iv) Market prices are very fluctuating (v) crops are not insured (vi) lack of cooperative marketing network in Pudhukkottai.
Methods Of Banana Marketing
The commission agent on behalf of the seller settles the prices of banana with the buyer in the following ways.
Private Negotiation
In this method the purchaser makes his offer personally to the commission agent and the bargain is settled. This method is common all over the district.
Open Auction
In this method almost all buyers assemble at a particular time in the market or at shop of the commission agent. Each lot of banana is kept for auction separately by auctioneer. The highest bid accepted for approval of the seller
Closed Bid System
The produce of each grower is arranged in separate lots with an identify number for each. The grower can present his produce for sale in one lot or more according to the grades. The traders visit the market yard before the time stipulated for declaration of sales, and go round examining each put up for sale. They are provided with bid slips are then deposited in a locked box. The slips in the box are taken out at the appointed time and compared by the market officials. The maximum price offered for each lot is called out and the grower’s consent is also obtained for that price. If agreed by the grower, the lot is declared as sold to the trader who has offered the highest price.
Uzhavar Sandhai
Uzhavar Sandhais are functioning in the district for direct selling of banana by growers to consumers without any hindrance of middlemen. The main object of Uzhavar Sandhai is to ensure growers to get a better price for their produce and to enable the consumers to get fresh banana at a lesser price than the retail market price. Various measures are taken by the department of agriculture to increase the arrivals in Uzhavar Sandhai by way of providing facilities like electronic weighing scale, plastic trays, trolleys, wastage bins to the growers. In addition to these, computers for effective communication, new hybrid seeds, seedlings, organic farming methodology, vermin composting demonstration and post harvest management training to growers will also be offered to those growers utilizing Uzhavar Sandhai
Table 1.2: REASONS FOR THE PREFERENCE OF SELLING THE PRODUCE THROUGH UZHAVAR SANDHAI
Total No. of Growers : 240
S.No Reasons No.of growers
Supporting the reason
Percentage On Total No.
Of growers
Rank
1. Absence of Commission 201 83.75 II
2. Absence of Middlemen 154 64.17 VI
3. Correct Weighment 213 88.75 I
4. Immediate Payment 189 78.75 III
6. Government Agency 144 60.00 VII
7. Market Facillities 160 66.67 V
8. Time Savings 136 56.67 VIII
Source: Primary Data
The Uzhavar Sandhai provide accurate weight and measurement for weighing the agricultural produce. It is the main reason for the growers for selling their produce through Uzhavar Sandhai. This reason stands out and takes the first rank among reasons for preference. Further, it is reported that cheating in weighing by private agencies is the reason for this preference to Uzhavar Sandhai. Another important reason is the absence of commission. This view is supported by 83.75 per cent of the respondents. It is because of the fact that growers need not pay even a single paisa to the Uzhavar Sandhai.
Table No:1.3: REASONS FOR THE SELLING OF THE PRODUCE THROUGH AGENCIES OTHER THAN UZHAVAR SANDHAI
S.No Reasons
No.of growers Supporting
the reason
Percentage On Total No.
Of growers
Rank
1. Better Price 80 47.48 III
2. Settlement of prior debts 92 50.00 I
3. A very good amount of
Marketable Surplus
64 34.78 V
4. Better market services 84 45.65 II
5. Traditional and Time bound
practice
68 36.95 IV
6. Others 62 33.70 VI
Source: Primary Data Note : Multiple Answers Considered
It is reported that the intermediaries advance money to the growers both for cultivation and consumption expenses without any securities. But they compel the growers to bring the produce to their shops. The second in intermediaries is the list of reasons for the grower’s preference of the intermediaries is the better market facilities. The third in the rank is concerned with the better price with their experience and influence on behalf of the growers. Another reason for selling the produce through intermediaries is traditional and time bound practice with them as reported by 36.95 percent of the growers who dealt with other agencies also. lastly, convenience and non – availability of packing gunnies are stated by 33.70 percent of the growers in the column others as a reason for selling their produce through intermediaries.
Garrett’s Ranking Technique
Garrett’s Ranking Technique is used to rank the important problems faced by the small growers in coffee plantation. The collected pieces of information from the respondents of small growers are arranged and converted into mean score values which are in turn ranked using Garrett’s Ranking Technique.
Per cent position = 100 (Rij – 0.05) / Ni Where
CHI - SQUARE TEST
The chi – Square test represents a useful method of comparing experimentally obtained data with those expected theoretically. The following formula has been used:
Chi – square test (x2) = E (fo-fe)2/ fe Where fo = Observed frequency.
fe = Expected frequency
Degree of freedom (d.f) = (r-l) (c-1)
If the calculated value is greater than the table value at a particular significant level, say 0.05 level, it is concluded that the factor is dependent on variable for which Chi – Square is computed. If the calculated value is less than the table value, it is concluded that the factor is independent on the variable.
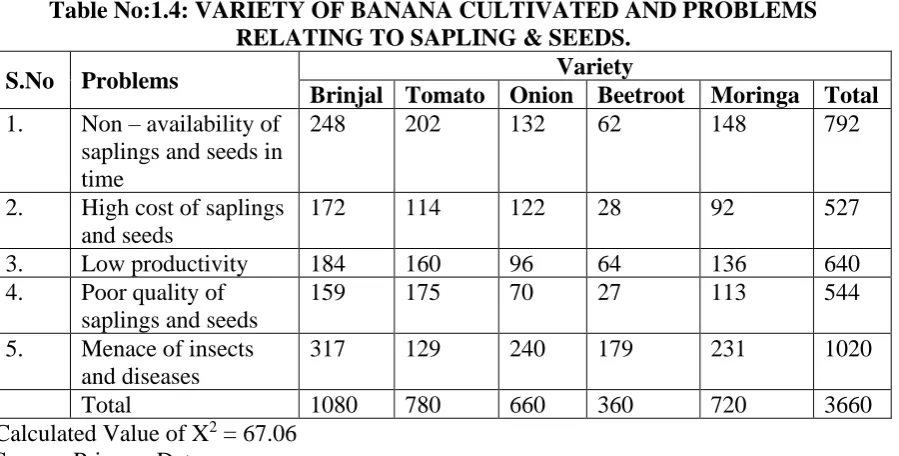
Table No:1.4: VARIETY OF BANANA CULTIVATED AND PROBLEMS RELATING TO SAPLING & SEEDS.
S.No Problems Variety
Brinjal Tomato Onion Beetroot Moringa Total 1. Non – availability of
saplings and seeds in time
248 202 132 62 148 792
2. High cost of saplings and seeds
172 114 122 28 92 527
3. Low productivity 184 160 96 64 136 640
4. Poor quality of saplings and seeds
159 175 70 27 113 544
5. Menace of insects
and diseases
317 129 240 179 231 1020
Total 1080 780 660 360 720 3660
Calculated Value of X2 = 67.06
Source :Primary Data
Table value at 5% significant level for 16 d.f = 26.30.
The calculated value is more than the table value. It implies that the hypothesis there is a significant relationship between variety of banana cultivated and problems relating to saplings and seeds’ holds good. Thus it is statiscally revealed that there is a significant relationship between variety of banana cultivated and problems relating to saplings and seeds.
The calculated value is seen to be more than the table value. It implies that the hypothesis there is a significant relationship between awareness of the growers and problems relating to saplings and seeds’ holds good. This reveals statistically that there is a significant relationship between awareness of the growers and problems relating to saplings and seeds. Landholdings And Problems Relating to Agricultural
Table No:1.5: LANDHOLDINGS AND PROBLEMS RELATING TO AGRICULTURAL LOAN
S.No Problem Landholdings Total
Small Medium Large 1. Not properly extended in
time 465 251 126 842
2. Inadequate for banana 348 172 96 616
3. Higher rate of interest 324 179 109 612
4. Improper lending system 348 172 102 622
5. Granted on the basis of
favoritism / preference 465 336 107 908
Total 1950 1110 540 3600
Calculated value of x2= 28.96 Source : Primary Data
Table value at 5% significant level for 8 d.f = 15.51.
The calculated value is greater than the table value. it implies that the hypothesis there is a significant relationship between landholdings and problems relating to agricultural loan’ holds good. This confirms statistically that there is a significant relationship between landholdings and problems relating to agricultural loan.
Table No1.6: Variety of Banana Cultivated and Problems Relating to Agricultural Loan
Problems
Variety Brinjal Tomato Onion Beetroot
Moringa Moringa Total Not properly extended
on right time 250 180 156 80 176 842
Inadequate for banana
cultivation 188 135 111 61 121 616
Higher rate of interest 179 138 124 60 111 612
Improper lending system 190 130 106 58 138 622
Granted on the basis of
favoritism / preference 273 197 163 101 174 908
Total 1080 780 660 360 720 3600
Source : Primary Data Calculated value of x2 = 7.55
Table value at 5% significant level for 16 d.f = 26.30
The calculated is less than the table value. It implies that the hypothesis there is a significant relationship between variety of banana planted and problems relating to agricultural loan does not hold good. This confirms statistically that there is no significant relationship between variety of banana cultivated and problems relating to agricultural loan.
At the time of repayment of loan by the growers, the lending financial institutions should adopt a flexible approach in deciding the date of recovery of loan dues from the growers. By taking into account the time of harvesting and the nature of market. The lending institutions should adopt a flexible approach in collecting dues.
The government of India need to design policies generated at making local markets work for growers. This involves creating strong, accountable and transparent regulatory bodies in this sector to provide marketing information and monitor competition among the supply chain. Moreover, technical assistance, better access to credit and inputs, investments in infrastructure and storage facilities are paramount to enable growers make a decent living and compete with others.
The growers should come forward to pay wages higher than industrial operators and builders to avoid labour turnover. Emoluments and fringe benefits should also be given regularly to the workers in order to retain them in the cultivation.
Conclusion
India is the world’s second largest producer of banana. Tamilnadu is the major contributor to the country in banana cultivation. The study revealed that the area of banana cultivation in Pudhukkottai District of Tamilnadu remains constant throughout of the study period but there is a fluctuation in marketing of banana. Considering the current scenario of the agri industry, it has to maintain its comparative attractiveness like others in India to grow and develop as a major industry. This would mean that the rewards to the growers should commensurate with the efforts required of them.
References
1.Businee linePublished on May 04, 2018
2.Agriculture Economics Research revised Volume 19.2006 Jagshand singh Chhina and Bhuphindar singh “potential of Banana – processing and its Impact on the Income and Employment of the Farmers” Agricultural Marketing Jan – Mar 2016.
3.Krishnaiah “Horticulture in Andhra Pradesh. Production and Export potentials” Indian Journal of Agricultural Economics Vol -52, 2017.
4.Kohila. B Development and Evaluation of Banana based Antioxidant mixes” The Indian Journal of Nutrition and Dietetics sep – 2007 Vol – 44, No 9.p.475-2012
5.Pandy A.k. Banana : A Source of nutritional Security” Indian Horticulture Vol-48, No4, 2014
Molecular characterization of a Hill Stream Cyprinid Fish
Garra lamta using D-loop region of Mitochondrial DNA
Pradeep Tiwari
& S N Bahuguna
Arun Bhatt
Abstract
Garra lamta is a hill stream fish belonging to family Cyprinidae and subfamily Garrinae. Being a non-protein coding gene, the mitochondrial D-loop plays a significant role in the field of molecular characterization. Till date, there has been no reported study about the complete or partial sequence of D-loop or control region of Garra lamta. For these reasons, the objective of this research was to assess the molecular characterization of this species using mitochondrial D-loop. The evolutionary history and phylogenetic tree of the sample species was inferred using the maximum likelihood method. MEGA 7 was utilized to induce all the phylogenetic studies.
Key words:Garra lamta, Garrinae, mitochondrial D-Loop, molecular characterization
Introduction
Molecular and genomic analysis of fishes give an understanding about their metabolic exercises and their genomic outline living in wild (Oleksiak, 2010). Hill stream fishes live in quick slope streams and structure their sanctuaries under rocks and stones (Ojha and Singh, 2006). Slope streams are special biological systems portrayed by shallow limited channels with rough beds and quick, violent and shooting hypertonic water stream. In Garhwal, fish is the least expensive and promptly accessible source of protein and fat. In the recent past, the slope stream condition has experienced enormous decimation because of woodland fire, deforestation, overgrazing, multipurpose waterway valley ventures and so on. This has impacted the fish population on an extensive scale by breaking down their bolstering and reproducing grounds. Because of separating of stones and rocks, shakes and stones, which are the bringing forth grounds of various fishes, acquired a change the ichthyofauna of Garhwal locale. Because of changes in geography of the area, the slope stream fishes show a few adjustments for survival and can be described by their slim level bodies, little eyes and suckers.
Fishes of the family cyprinidae comprise 16 percent of the world’s fishes approximately 321 recognized genera and 3268 species (Nelson, 2006). G. lamta is a hill stream fish belonging to family Cyprinidae and subfamily Garrinae. The molecular techniques in the field of biology has helped us to establish genetic relationships between the members of different taxa. DNA sequence analysis has been applied for 30 years to assist species identification (Ward et al., 2005). The mtDNA is the best studied molecular marker applied in molecular characterisation because of its justifying properties like high copy number, maternal inheritance, etc.
The MCR (MtDNA Control Region) plays a pivot role in the field of molecular taxonomy. The control region is the non- protien coding region of mitochondrial DNA, and it has been
proven to be an ideal marker for assessing the genetic structure of recently diverged or closely related populations or species (Avise, 1994; Bremer et al., 1996; Iguchi et al., 1999; Tabata and Taniguchi, 2000; Ishikawa et al., 2001, Li et al., 2012). The Control region is noted for its non-protein coding and a faster rate of evolution, as it is a unique and highly variable area in the mitochondrial DNA (Zhang et al, 2013; Bronstein, 2018). However, there has been no reported study about the complete or partial sequence of the mitochondrial control region of the G. lamta. For these reasons, the objective of this research was to establish the molecular characterization of this species based on control region.
Materials And Methods
Samples of G. lamta were procured from fishermen near the Alaknanda river, a snowfed torrential stream at the Srinagar Garhwal (30.22°N 78.78°E), at an average elevation of 560 meter above sea level (1837 feet). The procured fishes were transported live to the laboratory, and were kept in a well-aerated hatchery at 20-24°C before analysis to get acclimatized to the existing conditions. After correct identification and taking morpho-metric data at species level (Tilak and Hussain 1977; Jingran 1975), the specimens were properly cleaned and different tissues were taken out by sacrificing the fish. Tissue (Muscle) samples were collected and preserved in 95% v/v ethanol in 2ml cryo-preservatory vials. These vials were kept in cyroboxes. The cyroboxes containing tissue samples were then kept at 4°C for further use.
The standard phenol/chloroform procedures (Sambrook et al., 1989) were used to isolate the total genomic DNA. A Partial sequence of the MCR was amplified by PCR (Eppendorf, Master cycler gradient) using sets of primers DLL: 5’- CCACTAGCTCCCAAAGCTA -3’ and DLH: 5’- ACTTTCTAGGGTCCATC -3’ (Bernatchez et al., 1992). Each PCR mixture (25 μL) included 2μl template DNA, 2.5 μL 10X Taq Assay Buffer, 2.5 μL dNTPs (2 mM each), 1.8-2 μL MgCl2 (25 mM), 0.5 μL of each primer (10 μM), 0.15-0.2 μl (1 U) Taq DNA
polymerase. The following cycling protocols were used to amplify the MCR gene: an initial denaturation at 94ºC for 3 min, 35 cycles of denaturation at 94ºC for 30 secs, annealing at 49ºC for 45 secs and extension at 72ºC for 1 min and a final extension at 72ºC for 10 min. Sequencing of amplified PCR products were done from outside agency: Xcelris Labs Limited, Ahmedabad.
Phylogenetic and molecular evolutionary analyses were conducted using MEGA 7 (Kumar et al., 2016). The Maximum Likelihood method tree was created to provide a graphic representation of the patterning of divergence between species.
Results And Discussion
Thirty morpho-meristic characters were analysed (Table 1) for correct identification and taking morpho-metric data at species level based on Tilak and Hussain (1977) and Jingran (1975). Altogether 2 samples of G. lamta were used and sequenced for mitochondrial DNA partial sequence analysis. Sequences were submitted to NCBI GenBank (Accession numbers: MK347000-MK47001). In total 12 sequences were analysed for preparing phylogenetic tree.
T*C*k2]/[(A+G)*(T+C)]. For the populations, the average transition/transversion ratio was 7.37, which suggested that the transition was higher than transversion, which was consistent with conclusions of other authors (Liu HY et al., 2004; Yang et al., 2008; Peng et al., 2010; Li et al., 2012).
The nucleotide composition of the mtDNA D-loop of G. lamta was also calculated, in which the average A, T, C, and G contents were 34.3, 45.7, 3.7, and 13.5.0%, respectively, and the base distribution showed no apparent difference among populations. The results showed that the G and C bases were relatively low. The A + T content was higher than the G + C content among the sequences examined, which was consistent with previous findings that the control region is an A + T-rich region of the mitochondrial genome (Brown et al., 1986; Saccone et al., 1987, Cheng et al., 2010; Li et al., 2012).
The evolutionary history was inferred by using the Maximum Likelihood method based on the Tamura 3-parameter model. The tree confirms that the studied samples are of Genus
Garra (Fig. 1). The mtDNA displacement-loop (D-loop) region, is located between tRNAPro and tRNAPhe in mtDNA (Sahoo, 2015). This region being a non-protein coding region ideal marker for phylogenetic studies (Morris, 2012). The present study was a preliminary step toward assessing the molecular characterisation of G. lamta using D-loop from India. However, to better resolve phylogenetic relationships of this species with other members of cyprinids based on D- loop or control region, more taxon sampling is needed for future studies.
Acknowledgement
The authors extend their deepest thanks to Bhim Dutt Joshi and Ashish Kr. Chowdhary for technical assistance in accomplishing this research work. The authors sincerely thanks to Xcelris Labs Limited, Ahmedabad for sequencing purposes.
References
Avise JC (1994) Molecular Markers, Natural History and Evolution. Sinauer Associates, New York.
Bernatchez L, Guyomard R, Bonhomme F (1992) DNA sequence variation of the mitochondrial control region among geographically remote European brown trout Salmo trutta populations. Molecular Ecology 1: 161–173.
Bremer JRA, Mejuto J, Greig TW, Ely B (1996) Global population structure of the swordfish (Xiphias gladius L.) as revealed by analysis of the mitochondrial DNA control region. J. Exp. Mar. Biol. Ecol. 197: 295-310.
Bronstein O, Kroh A, Haring E (2018) Mind the gap! The mitochondrial control region and its power as a phylogenetic marker in echinoids. BMC evolutionary biology 18(1): 80. doi:10.1186/s12862-018-1198-x.
Brown GG, Gadaleta G, Pepe G, Saccone C, Sbisà E (1986) Structural conservation and variation in the D-loop-containing region of vertebrate mitochondrial DNA. J. Mol. Biol. 192: 503-511.
Cheng Y, Xu T, Shi G, Wang R (2010) Complete mitochondrial genome of the miiuy croaker
Miichthys miiuy (Perciformes, Sciaenidae) with phylogenetic consideration. Mar. Genomics 3: 201-209.
Ishikawa S, Aoyama J, Tsukamoto K, Nishida M (2001) Population structure of the Japanese Eel, Anguilla japonica as examined by mitochondrial DNA sequencing. Fish. Sci. 67: 246-253.
Jhingran VG (1975) Fish and fisheries of India. Hindustan Publishing Corporation (India), Delhi. I-xv. 1-954.
Kumar S, Stecher G, Tamura K (2016) MEGA7: Molecular Evolutionary Genetics Analysis version 7.0 for bigger datasets. Molecular Biology and Evolution 33:1870-1874.
Li HY, Xu TJ, Cheng YZ, Sun DQ, Wang RX (2012) Genetic diversity of Setipinna taty (Engraulidae) populations from the China Sea based on mitochondrial DNA control region sequences. Genetics and Molecular Research 11 (2): 1230-1237.
Liu HY, Jing SG, Su TF, Gong SY (2004) Polymorphism study of the mitochondrial DNA D-loop gene sequences from Sparus latus. J. Fish. China28: 371-374.
Morris K (2012). Non-Coding RNAs and Epigenetic Regulation of Gene Expression: Drivers of Natural Selection. Norfolk, UK: Caister Academic Press. ISBN 978-1904455943 Nelson JS (2006) Fishes of the World. John Wiley & Sons, Inc., 414, Ed. xix + 601 pp: ISBN: 0-471-25031-7.
Ojha JK, Singh S (2006) Functional morphology of the anchorage system and food scrapers of a hillstream fish, Garra lamta (Ham.) (Cyprinidae, Cypriniformes). Journal of Fish Biology. 41: 159-161.
Oleksiak MF (2010) Genomic approaches with natural fish populations. Journal of fish biology 76(5): 1067-1093
Peng SM, Shi ZH, Hou J (2010) Comparative analysis on the genetic diversity of cultured and wild silver pomfret populations based on mtD-loop and COI gene. J. Fish. China 34: 19-24.
Saccone C, Attimonelli M, Sbisa E (1987) Structural elements highly preserved during the evolution of the D-loop containing region in vertebrate mitochondrial DNA. J. Mol. Evol. 26: 205-211.
Sahoo PK, Goel C, Bhat FA, Balkhi MH, Barat A (2015) Complete mitochondrial genome organization of Schizothorax labiatus (McClelland, 1842), Mitochondrial DNA 26(6): 904-905
Sambrook J, Fritsch EF, Maniatis T (1989) Molecular cloning. Cold spring harbor laboratory press New York.
Tabata K, Taniguchi N (2000) Differences between Pargus major and Pagrus auratus
through mainly mtDNA control region analysis. Fish. Sci. 66: 9-18.
Tamura K (1992) Estimation of the number of nucleotide substitutions when there are strong transition-transversion and G + C-content biases. Molecular Biology and Evolution 9: 678-687.
Tamura K, Kumar S (2002) Evolutionary distance estimation under heterogeneous substitution pattern among lineages. Molecular Biology and Evolution 19: 1727-1736. Tilak R, Husain A (1977) A check list of the fishes of Himachal Pradesh. Zool. J. Syst. Bot. 104 S: 265-301.
Ward RD, Zemlak TS, Innes BH., Last PR, Hebert Paul DN (2005) DNA barcoding Australia’s fish species. Philosophical Transactions of the Royal Society of London B: Biological Sciences 360(1462): 1847-1857.
Table 1 Measurements (in cm.) and counts of Garra lamta (Hamilton-Buchanan)
Table 2 Maximum Composite Likelihood Estimate of the Pattern of Nucleotide Substitution
A T C G
A - 1.76 1.61 24.08
T 1.4 - 15.07 1.03
C 1.4 16.57 - 1.03
G 32.68 1.76 1.61 -
S.
No. Morpho-Meristic Characters Mean Range
1. Total length 18.94 16.5-21.3
2. Standard length 15.76 13.5-17.8
3. Head length 3.58 3.3-4.0
4. Snout Length 1.66 1.4-1.7
5. Eye diameter 0.62 0.5-0.7
6. Length of caudal peduncle 3.02 2.8-3.4
7. Height of caudal peduncle 1.88 1.7—2.1
8. Maximum Body depth 3.44 3.4-3.8
9. Intra Orbital Length 2.02 1.8-2.2
10. Fork Length 17.22 15.2-18.9
11. Head Depth 2.22 1.9-2.6
12. Pre Pectoral length 3.12 2.8-3.5
13. Pre Dorsal Length 7.24 6.5-7.8
14. Pre Ventral Length 8.3 7.5-8.9
15. Pre Anal Length 11.98 10.7-13.1
16. Height of dorsal fin 2.96 2.1-3.6
17. Height of anal fin 2.58 1.8-3.1
18. Height of caudal fin 4.54 4.3-4.8
19. Length of dorsal fin 2.64 2.32.9
20. Length of anal fin 1.06 0.91.2
21. Length of caudal fin 3.18 3.0-3.5
22. Barbells Number 2 pairs 2 pairs
23. Caudal fin Deeply
Emarginated
Deeply Emarginated
24. No. of lateral line scales 34.2 32-36
25. No. of L. tr. scales 4/4 ½ 4/4 ½
26. Dorsal fin ray 11 (2/9) 11 (2/9)
27. Pelvic fin ray 15 15
28. Ventral fin ray 9 9
29. Anal fin ray 7 (2/5) 7 (2/5)
Effectiveness of Computer Assisted Programs in Developing
English Linguistic Skills among the Students of Aarohi Schools
Dr. Nivedita
Ms. Shaleen Kamboj
Abstract
The main aim of education was to preserve, transmit and advance knowledge. In the past, it was easy to achieve the aims of education with the help of dedicated teachers and self – motivated students. The teachers were using the traditional methods of teaching with the help of some books and visual aids like charts and pictures. But with the passage of time, the system of education changed due to increase in number of students, lack of text books and source material etc. the increased number of students resulted in large classes with individual differences. Normally a class consists of 40 to 50 students who are grouped together and taught by traditional methods irrespective of their individual differences. Moreover, due to information explosion the objectives of education have also become multi dimensional. It is difficult to achieve those multi dimensional objectives using traditional methods only. All these problems have made the education system rigid and static. The solution of these problems can only be tackled by the use of technology in the education system. Only the use of technology can bring the flexibility in the prevailing system of education.
Introduction
Computer assisted program is a program of instructional material presented by means of a computer or a computer system. This is in fact a mode of instruction whereby effective use of computer is made for the purpose of content transaction. Many educational computer programs are available online and from computer stores and textbook companies. They enhance teacher instruction in several ways. Computer programs are interactive and can illustrate a concept through attractive animation, sound and demonstration. They allow students to progress at their own pace and work individually or problem solve in a group. Besides the computer programs may be used for diagnosis or assessment too.
But these programs should be selected with thorough review by the teacher. The teacher should review the computer program or the online activity or game to understand the context of the lesson and determine which ones fit the needs of their students and how they may enhance instruction.
There are many advantages of using computers in education. They provide one to one interaction with the students. Besides, an instantaneous response to answers is elicited. This way the students receive immediate feedback and it let them not to continue to practice the wrong skills. Computers capture the students’ attention because the programs are interactive and engage the students’ spirit of competitiveness to increase their scores and hence their level of skill acquisition. The computer programs allow students to proceed at their own pace and do not move ahead until they have mastered the skill. In addition, the computer programs
Asst. Prof. Dept. of Education, CDLU, Sirsa
also follow the psychological principal of individual differences. The computer programs provide differentiated lessons to cater the needs of all students who are at risk, average or gifted.
Definitions Of CAP
Computer assisted programs provides instructional activities through the use of a computer as the primary vehicle for teaching content. Different educational technologists have defined computer assisted programs as follows:-
According to Good’s Dictionary(1973) “computer assisted programs is an automated instructional technique in which automatic data processing method is used to control the presentation of stimuli to a learner, to accept the response and evaluate the learner’s responses.”
Bhatt and Sharma (1992) were of the view that computer assisted instructions provide an interaction between learners, a computer controlled display and a response entry device for the purpose of achieving educational outcomes.
Chamber and Sprecher (1983) defined CAP as the use of a computer to provide classroom instructions and course content in the form of drill and practice tutorials and simulation. Review Of Related Literature
Every research project in the behavioral science has on its early stage that is a review literature. Review literature consists of two words review and literature. The term review means to organize the knowledge of the specific areas of research to involve to progress the depth of knowledge to show that his study be an addition to this field.
The word literature implies to the different meaning to the different situation. Here in research the knowledge of particular are of investigation of any discipline which include, theoretical, practical and its research studies.
In the word of Good Barr and Seats- The competent physician must keep a breast discoveries in the field of medicine obviously the careful students of education. The research worker and investigator should become familiar with location and use of source of educational information. Reviewing the literature has includes identifying all the relevant published material in the problem area and reading that part of it.
Studies in Abroad
Ya Huei Wang and Huang Chang Liao(2017) studied about “Learning performance enhancement using CALL by collaborative learning groups”. It was attempt to test whether the use of CALL and innovative collaborative learning could be more effective than that of conventional teaching in improving students language proficiencies. True experimental design was used in this research. [(TOEIC) test of English for international communication for listening, reading, writing and speaking] were used for pre test and post test assessments. 2 groups were formulated : (a) traditional collaborative learning group (TCLG) comprised of 32 students, (b) Innovative collaborative learning group (ICLG) comprised of 32 students, for the experiment. MANCOVA and ANOVA were used to analyze the data. The results revealed that CALL had significantly better learning performance than those who did not. Students of ICLG were better than students of TCLG in their learning performance.
computer assisted instruction have higher achievement in physical science subject than those who are taught with conventional teaching.
Studies in India
Dr. Suman Dalal and Ms. Rinku Rani (2016) aimed at finding out the effectiveness of computer assisted programs in improving language creativity in English. For this study, CAP material & conventional material on various topics of English were developed by the researcher herself. Language creativity test was developed by Dr. S.P Malhotra to test the creativity of language at pre test and post test level. This study was conducted on 60 students of class 7th. 30 students in experimental group and 30 students in control group. This study revealed that CAP method is much more effective in enhancing the language creativity of the learners than that of conventional method.
Dr. sarika sharma ( june, 2017) HOD, central university of Haryana conducted her research on " role of CAI in teaching children with special needs" on sample of 20 students. she overviewed that the use of CAI in teaching reproduces higher achievement than the use of conventional teaching alone. Students learn easily, faster and with speed & pace with the use of CAI.
Justification Of Study
CAI has been used as an effective and efficient medium of instruction in the advanced countries as well as in India for formal and non-formal education at all levels. In CAI, learners can learn at own pace and spend as much time as they need. The use of computer in the classroom has boomed since the 1980s but studies within the past 15-20 years had focused on the relationship between CAI and academic achievement in different subject areas. Number of studies has been carried out to find the effectiveness of CAI at different levels, many researchers have successfully conducted the studies which showed the significant effect of CAI on academic achievement of the learners in different subject. Although a large number of researches were done on the use of CAI in teaching learning process in developed countries. But in the developing countries like India, it is an embryonic stage particularly in the field of teaching foreign language i.e English language. So, there is the need to conduct researches to study the effect of CAI for teaching and learning of the English language. Further very researches have been done for developing self learning material forCAI in teaching of English at pre service training level.
Keeping in view the dearth of researches in CAI for teaching English language at teacher education level Indian situations, this experiment study was planned and executed
Statement Of The Problem
"EFFECTIVENESS OF COMPUTER ASSISTED INSTRUCTIONS IN DEVELOPING ENGLISH LINGUISTIC SKILLS AMONG THE STUDENTS OF AAROHI SCHOOL"
OPERATIONAL DEFINITIONS OF THE TERMS USED COMPUTER ASSISTED INSTRUCTIONS
a. Computer based programs is any course of instructions whose primary means of delivery is a computer.
b. A sequence of instructions written to perform a specified task that a computer can interpret and execute.
c. Computer programming is the iterative process of writing or editing source code. Linguistic Skills
c. Skill in using language affectively and persuasively.
d. A study of speaking or writing, specially the language of a subject. e. The art of using speech to persuade, influence, or please; oratory. AAROHI SCHOOL
(In educationally background blocks of the state):- these are progressive , secular, child centered co- educational school committed to providing quality education in backward blocks or rural areas. The school endeavor to cater to intellectual, physically, emotional, psychological and spiritual development of children to bring out the best in each child. Aarohi Schools are affiliated with Board of School Education, Bhiwani, Haryana. The school has adopted the syllabus of BOSE Haryana, Bhiwani. Medium of instruction is English and Mother tongue as well. To keep pace with present age and to bring the latest in field of information technology with the reach of every student, the schools are equipped with ICT lab where students from all classes are provided opportunities to work on the computer. The objective is to ensure that each child get atleast 6 hours access to computer per week. The curriculum is designed to teach software / hardware/ application/ language and skills. Objectives of the study
• To compare the achievement of the students in developing English Linguistic skills before taught through CAI and Conventional teaching at Criterion Referenced Pre test stage.
• To compare the achievement of the students in developing English linguistic skills after exposed to CAI and conventional teaching at Criterion Referenced post test level. Hypotheses of the study
• There exists no significant difference between the use of CAI and English linguistic skills learning ( at pre test stage).
• There exists no significant difference between the students who develop English linguistic skills with the help of CAP and those who don’t use computer assisted instructions for developing English linguistic skills (at post test stage).
Delimitations of the study Study is delimited to
• A sample of 250 students only
• Students of Aarohi Model Sen. S.ec Schools only • Students of Sirsa District only
• Four linguistic skills in English language only • Carried out with self constructed tool only 2 Research Design
Figure 1.1
Treatment Data collection phase Duration Control
group Experimental group Control group Experimental group Pre training
7 days T1-
conventional program of student teaching
T1-conventional
program of
student teaching
Pre test-
Skill of
Listening,
Skill of
Reading,
Skill of
Writing, and
skill of
Speaking
Pre test-
Skill of
Listening,
Skill of
Reading,
Skill of
Writing, and
skill of
Speaking Training 14 days
T1-conventional program of student teaching
T2- CAI
program of
training
Post training
7 days Post test-
Skill of
Listening,
Skill of
Reading,
Skill of
Writing, and
skill of
Speaking
Post test-
Skill of
Listening,
Skill of
Reading,
Skill of
Writing, and
skill of
Speaking
Pre test-post test control group design is a strong research design in which a group of research participants is randomly assigned to an experimental and control group. Both groups of participants were pre tested on the dependent variables and then post tested after the experimental treatment condition has been administered to the experimental group. Because of strict random assignments of research participants, it is assumed that the two groups are equivalent on all important dimensions and that there are no systematic differences between the 3 groups. They are matched on a list of characterstics like sex, knowledge in computers and parental education that might affects the outcome of the research.
In this study, 250 students of Aarohi Schools of secondary level of Sirsa District with well equipped computer lab were selected for experimentation. Out of these 250 students, two groups of 125 each were formed. One group was designated as experimental group and second as control group. Experimental group was exposed to CAI teaching and the control group was exposed to conventional teaching. These students were tested on 2 stages in order to find out the Effectiveness of computer assisted instructions and conventional teaching. 3.3 Sampling
were also developed and evaluated in the terms of validity and reliability in this phase. In the second phase, experiment was done on a sample of 250 students i.e. 125 students for each group(experimental and control).
For this, purposive sampling was done which is the sampling technique in which sample is selected on the basis of the preliminary knowledge gathered from the population of the study. It is a type of non probability of the researcher. A purposive sampling is also called a judgemental, selective or subjective sampling.
3.8 Data Collection
Data is recorded measure of the certain phenomena. Data collection means recording of facts of the phenomena by the researcher. Data is collected by using certain tools. For this study, the data was collected with the help of the measuring tools developed by the researcher herself i.e. CRTs at pre test level and post test level. for collecting data 2 Aarohi Schools were opted.
3.9 Statistical Techniques Used
Data in its original form does not meet the requirement of the research. There is no ned to convert the collected data into a meaningful form, which is known as data processing. Data processing is done by applying some techniques of statistics know as statistical techniques. On the basis of objectives and design of the study, the following statistical techniques were used in this study :
• The measures of central tendency and the measures of dispersion such as mean and SD were worked out to know the nature of the data;
• T-test was used to compare the effect of CAI and CT on the achievement of the students at pre test level and post test level.
Analysis, Interpretation And Discussion Of The Result
The achievement scores of the sample were obtained as a result of pre test and post test. The data was analyzed using the above mentioned statistical techniques. Significance of difference between the mean scores of both the groups on pre test and post test were compared and tested at 0.01 level of significance and as well as on 0.05 level of significance by calculating t-value.
SECTION-1 COMPARISON BETWEEN MEAN SCORES OF EXPERIMENTAL GROUP AND CONTROL GROUP AT PRE TEST STAGE
The significance of difference between the mean score of experimental and control group on pre test in each English Linguistic skills was found by applying t-test and the results are shown in table 4.1.1 to 4.1.3. the significance of difference between the total mean scores on all the linguistic skills of experimental and control group at pre test stage was also found by t-test and the result of which will be shown in table 4.1.4 and table 4.1.5 presents collective view of all the English Linguistic skills.
Table 4.1.1
Significance of difference between the mean scores of experimental group and control group on pre test level in Skill of Listening
Group N Mean SEd t-value level of Significance
Experimental Group 15 5.42
It can be seen from table 4.1.1 that the mean scores of experimental and control group on pre test in skill of Listening are found to be 5.42 and 5.65 respectively. The values of SEd is 0.42 and t-ratio between the two groups is 0.5. Thus , the difference found between the two mean was statistically not significant. It shows that both the groups can be treated equal for their entry level behavior at pre test.
Table 4.1.2 : Significance of difference between the mean score of experimental group and control group on pre test level in Skill of Reading
Group N Mean SEd t-value level of Significance
Experimental Group 15 6.37
0.48 0.55 N.S. Control Group 15 6.11
It can be seen from table 4.1.2 that the mean scores of Experimental group and control group on pre test in Skill of Reading are found to be 6.37 and 6.11 respectively. The value of SEd is 0.48 and t-ratio between the two groups is 0.55. Thus, the difference found between the two mean was statistically not significant at any level of significance. It indicates that both the groups can be treated equal for their entry level behavior at pre test stage.
Table 4.1.3: Significance of difference between the mean score of Experimental group and control group on pre test level in Skill of Writing
Group N Mean SEd t-value level of Significance
Experimental Group 15 5.48
0.37 0.70 N.S. Control Group 15 5.22
The table 4.1.3 shows that the mean scores of experimental group and control groups on pre test level in skill of writing are found to be 5.48 and 5.22 respectively. the value SEd and t-ratio between the groups are 0.37 and0.70 respectively. The t-value is not significant at any level of significance. It indicates that both the groups can be treated equal for their entry level behavior at pre test.
Table 4.1.4: Significance of difference between the mean score of Experimental group and control group on pre test level in Skill of Speaking
Group N Mean SEd t-value level of Significance Experimental Group 15 6.08
0.38 1.13 N.S. Control Group 15 6.51
Table 4.1.5: Significance of difference between the total mean scores in all English linguistic skills on pre test level of experimental and control group
Group N Mean SEd t-value level of Significance
Experimental Group 15 5.57
4.35 0.009 N.S. Control Group 15 5.71
It can be seen from table 4.1.5 that the total mean scores in all the English linguistic skills of experimental group and control group on pre tests are found to be 5.57 and 5.71 respectively. The standard error of difference between the two groups is 4.35. The t-ratio is 0.009. Thus, the difference between the 2 means was statistically not significant. It indicates that both the groups can be treated as equal in terms of the students previous achievement in CRTs given in all specified skills of English language at pre test stage. So the entry level behavior of the students of both groups was found similar.
The entry level of students can be further studied by the data given in table 4.1.6. In this table pre test scores and post test scores of experimental group and control group in English Linguistic skills are shown with the calculated SEd and t-ratio.
Table 4.1.6: Significance of difference between the mean score of experimental and control group at pre test level
S.no Name of unit experimental group
control group
SEd t-
ratio
level of significance
1 skill of listening 5.42 5.65 0.42 0.54 N.S.
2 skill of speaking 6.37 6.11 0.47 0.55 N.S.
3 skill of reading 5.48 5.22 0.37 0.77 N.S.
4 skill of writing 6.08 6.51 0.38 1.13 N.S
On the basis of results obtained from tables 4.1.1 to 4.1.6, it can be concluded that the students of both the groups were found similar for their entry level behavior before starting the experiment in terms of pre test scores. The students of the experimental group and control group did not differ significantly in their achievement on learning different English linguistic skills. This indicates that the students of both the groups i.e. experimental and control group were found to have almost similar achievement level at pre test stage.
It can also be seen from the table 4.1.6 that mean scores of the students was similar in experimental as well as control group at pre test level. Thus, our first hypothesis, “there exist no significant difference between the students achievement using CAI and those who don’t use CAI at pre test level” is accepted.
4.2 SECTION-2 COMPARISON BETWEEN MEAN SCORES OF EXPERIMENTAL GROUP AND CONTROL GROUP AT POST TEST LEVEL
SECTION 2 presents the result of the execution of the experiment. The significance of difference between the mean scores of both experimental and control group on post test was found to by applying t-test and the results are shown in table 4.2.1 to 4.2.6. Table 4.2.5 shows the total mean score of all the English linguistic skill of both the groups experimental and conventional at post test level.