R E S E A R C H A R T I C L E
Open Access
Decision-making in healthcare: a practical
application of partial least square path modelling
to coverage of newborn screening programmes
Katharina E Fischer
1,2*Abstract
Background:Decision-making in healthcare is complex. Research on coverage decision-making has focused on
comparative studies for several countries, statistical analyses for single decision-makers, the decision outcome and appraisal criteria. Accounting for decision processes extends the complexity, as they are multidimensional and process elements need to be regarded as latent constructs (composites) that are not observed directly. The objective of this study was to present a practical application of partial least square path modelling (PLS-PM) to evaluate how it offers a method for empirical analysis of decision-making in healthcare.
Methods:Empirical approaches that applied PLS-PM to decision-making in healthcare were identified through a
systematic literature search. PLS-PM was used as an estimation technique for a structural equation model that specified hypotheses between the components of decision processes and the reasonableness of decision-making in terms of medical, economic and other ethical criteria. The model was estimated for a sample of 55 coverage decisions on the extension of newborn screening programmes in Europe. Results were evaluated by standard reliability and validity measures for PLS-PM.
Results:After modification by dropping two indicators that showed poor measures in the measurement models’
quality assessment and were not meaningful for newborn screening, the structural equation model estimation produced plausible results. The presence of three influences was supported: the links between both stakeholder participation or transparency and the reasonableness of decision-making; and the effect of transparency on the degree of scientific rigour of assessment. Reliable and valid measurement models were obtained to describe the composites of‘transparency’,‘participation’,‘scientific rigour’ and‘reasonableness’.
Conclusions:The structural equation model was among the first applications of PLS-PM to coverage
decision-making. It allowed testing of hypotheses in situations where there are links between several non-observable constructs. PLS-PM was compatible in accounting for the complexity of coverage decisions to obtain a more realistic perspective for empirical analysis. The model specification can be used for hypothesis testing by using larger sample sizes and for data in the full domain of health technologies.
Keywords:PLS, Structural equation modelling, Quantitative research, Feasibility study, Model evaluation,
Non-parametric, Fourth hurdle, Reimbursement, Neonatal, Europe
Correspondence:[email protected]
1
Helmholtz Zentrum München, German Research Center for Environmental Health, Institute for Health Economics and Health Care Management, Ingolstädter Landstr. 1, 85764, Neuherberg, Germany
2University of Hamburg, Hamburg Center for Health Economics, Esplanade
36, 20354, Hamburg, Germany
Background
Across industrialized countries, many publicly funded healthcare systems have installed mechanisms to formally assess and appraise the coverage and reimbursement of health technologies [1]. Since the establishment of the UK National Institute for Health and Clinical Excellence (NICE) and similar institutions, research on healthcare decision-making has been extended beyond physician and patient behaviour [2]. Generally speaking, a decision pro-duces an action as a result of the decision process. In healthcare, actions comprise provision of treatments, tests or clinical strategies [3]. In relation to coverage, a decision-making committee decides on reimbursement of a technology. Foremost is the decision process, which involves a variety of elements such as evidence assess-ment, stakeholder participation or application of appraisal criteria [4]. As such elements extend the complexity that comprise decisions and resulting actions, suitable methods are required for quantitative analysis.
Analogous to the regulation of environmental and safety issues [5], the implementation of formal coverage decision-making incurs benefits in terms of actions to-wards efficient allocation of resources. For example, the Swedish Pharmaceutical Benefits Board re-evaluated all antihypertensive treatments, which resulted in savings to the national health service of about 5% [6]. In contrast, third-party payers who intend to regulate coverage face costs because they need to enforce processes and con-duct evidence assessments. From the manufacturers’and patients’perspectives, decision processes also delay mar-ket entry and the availability of treatments [7]. To understand the functioning of decision processes, instru-ments are needed to measure the consequences of differ-ent specifications of decision-making.
Coverage has been analysed by description of decision processes and qualitative and quantitative investigation of real-world decisions. Stafinski et al. provide an inventory of decision processes from 31 decision-makers based on avail-able documentation [8]. Coverage decisions are subject to influences from policy, and complex technologies may chal-lenge pre-defined processes. Thus, hypothetical description of decision procedures cannot capture such aspects. Vuor-enkoski et al. identify six qualitative studies that focus on the description of selected aspects of past decision pro-cesses by a single committee [9]. Although qualitative approaches provide an opportunity to describe complex interrelationships between elements of decision-making in detail, they do not allow measurement of the strength of such effects mathematically. Using regression analysis, sev-eral studies have enforced quantitative approaches to ana-lyse real-world decision-making [10-13]. These studies examine the relation between decision outcome and selected appraisal criteria. Furthermore, they focus on the UK NICE and the Australian Pharmaceutical Benefits
Advisory Committee. A number of comparative studies apply descriptive methods but also concentrate on selected aspects, e.g. decision-making for cancer drugs [14-16].
To account for the complexity of decision-making, three aspects need consideration in empirical analysis: (1) Not all elements of decision processes can be measured by spe-cification of variables that can be observed directly. For example, there is discussion about the legitimacy and transparency of decision processes being critical factors that support the appraisal stage [17]. Such concepts can-not be measured by observation of a single variable. So-called latent constructs or, composites are frequently defined from normative concepts and need operationaliza-tion by several observable indicators. (2) The network of linkages between elements of decision processes needs to be accounted for because the components of decision-making are not independent but influence each other. For example, Erntoft argues that cost-effectiveness considera-tions influence both assessment and appraisal [18]. (3) Multiple interrelationships further imply accurate specifi-cation of causal inferences. Correct description of cause and effect offers the opportunity to conduct empirical ana-lysis from a more realistic point of view.
Structural equation modelling comprises a group of esti-mation algorithms that account for the complexity of coverage decisions. Linkages between several composites can be tested in a structural equation model (SEM) by a combination of factor and multiple regression analysis. Partial least square path modelling (PLS-PM) is a tech-nique of structural equation modelling where the share of the variance explained for one or several endogenous con-structs specified in the SEM is maximized through a series of ordinary least squares regressions [19]. PLS-PM is used by a growing number of research disciplines, e.g. strategic management or marketing [20]. However, its current ap-plication to decision-making in healthcare and, especially, to coverage is unclear.
The objective of this study is to present a practical ap-plication of PLS-PM to coverage decision-making and show how it offers a method for empirical analysis of situations that involve multiple interrelationships among several composites. This aim is achieved by identification of studies that have applied PLS-PM in the context of healthcare decision-making. The technique is then ap-plied to a SEM that specifies a set of hypotheses on links between the components of decision-making. It is tested and evaluated for decisions to expand newborn screen-ing programmes across Europe.
Methods
Identification of PLS-PM applications to decision-making in healthcare
decision-making in healthcare and draw from existing specifica-tions of structural models. Studies were included if they analysed decision-making in healthcare, at both individual and institutional level, including coverage and reimbursement. A detailed description of the study identification is presented in Additional file 1: Systematic search. The search identified two publications but none of them dealt with coverage decision-making. Downey and Sharp examined the adoption behaviour of worksite health promotion by company managers using the theory of planned behaviour [21]. Walter and Lopez examined the acceptance of information technologies in the med-ical sector assuming that physicians’ beliefs in their pro-fessional autonomy may be limited through IT [22]. Also, no studies that used covariance-based SEM to ana-lyse coverage decisions were identified.
Partial least square path modelling
Structural equation modelling includes several elements that are different from multivariate regression analysis [20]. A SEM consists of composites that are interrelated. Endogenous constructs depend on one or several exogen-ous constructs. In regression analysis, one dependent variable is explained by several independent variables. Specification of several endogenous constructs is not pos-sible. In the structural model, links between several con-structs can be defined. In the measurement models, the relation between a composite is defined by one or several manifest indicators that are observed directly in the data. Depending on the causality between construct and indicators, measurement models are either formative or reflective. In the former, the causality goes from the indi-cator to the construct, whereas for the latter, the direc-tion of causality is reversed. Through applicadirec-tion of an iterative procedure, the PLS-PM algorithm calculates the path coefficients between the composites and the scores of the constructs in the structural model and the weights and loadings of the manifest indicators in the measure-ment models in a sequence of ordinary least square regressions [19]. The software SmartPLS 2.0 M3 was used for estimation of the case study using the path weighting scheme to calculate the inner weights [23]. The mean replacement algorithm was selected to substitute missing values.
The case study
The applicability of PLS-PM to coverage was assessed for a newly developed SEM which describes specific components of decision processes and their interrela-tionships. The motivation was to measure the effects be-tween components that have been discussed in the literature separately but not in combination. For specifi-cation of the components which were regarded as com-posites, a set of indicators that has been developed to
describe and structure the steps of coverage decision-making was used [4,24]. For the test of applicability, a data set of 55 coverage decisions made on newborn screening (NBS) technologies was available. Because of the small sample size and the expectation that decisions on NBS incur several peculiarities within the range of health technologies, it was not a suitable strategy to build the measurement models by use of clustering tech-niques [25,26]. Instead, the aim was to assess the SEM for hypotheses testing using larger sample sizes and in the full domain of health technologies. In the following, the components, the hypotheses, the empirical operatio-nalization and the data are described.
Components of coverage decision-making and their interrelationships
A set of hypotheses was stated that rested on statements made in the literature, empirical observations and the lo-gical combination of the components of decision pro-cesses. It was aimed to explore and predict the linkages to obtain a general perspective on coverage. Empirical studies have examined aspects that are frequently very specific for the decision-makers under consideration and, thus, their transferability is limited.
As no single theoretical framework exists that combines the components of decision processes, this model rested on two normative deliberations. To obtain reasonable and fair decision-making, the principles of procedural justices state that criteria have to be met such as transparency of and stakeholder participation in decision processes are ensured [4,17,27]. Besides, it is frequently argued that there is not a one single criterion for making reasonable decisions. Instead, a combination of medical, economic and other ethical criteria is used frequently [10-12,28-32]. What is unclear is the influence of the principles of pro-cedural justice on the reasonableness of coverage decisions in terms of the criteria considered for appraisal.
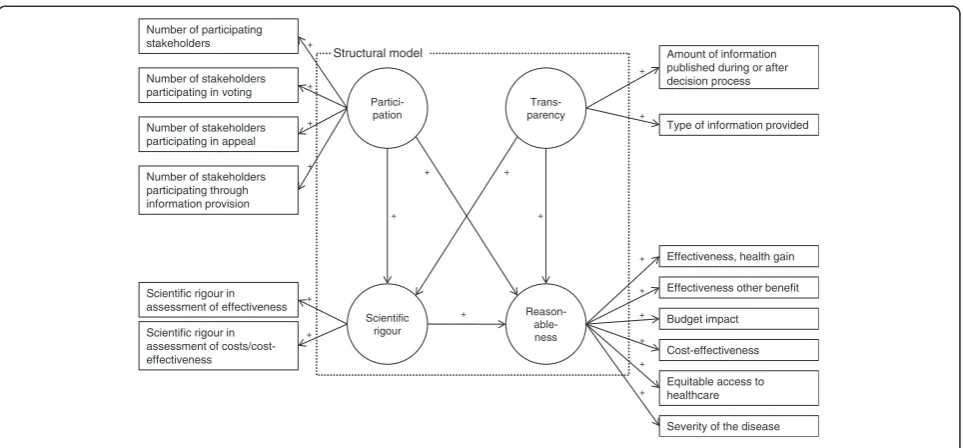
Additionally, accounting for the use of assessment methods to gather evidence on the considered technol-ogy, the model specification thus consisted of four com-ponents:‘transparency’,‘participation’,‘scientific rigour (of assessment)’and ‘reasonableness’[33-36]. A detailed de-scription is provided in Table 1. As the appraisal of a technology is the final stage before the decision outcome is settled, it was hypothesized that the component ‘ rea-sonableness’ is influenced by the others. It was further stated that both transparency and the degree of partici-pation influence the rigour of assessment. An overview of the hypotheses that describe the links between the components is provided in Table 2.
Specification of the structural equation model
The structure outlined by Rogowski et al. captures both process and appraisal criteria [4]. It describes the stylized steps of a decision process from the point where a tech-nology enters a healthcare market to its diffusion into routine use. The following steps were considered: stake-holder ‘participation’; ‘publication’, which reflects infor-mation about the transparency of decision processes;
‘scientific rigour of assessment’ by methods such as sys-tematic literature review or cost-effectiveness analysis;
and‘appraisal’in terms of decision-making criteria which determine whether the technology should be funded given the available evidence on effectiveness and costs and add-itional ethical considerations. This step reflects the reason-ableness of decision-making. Each step in the framework corresponds with a set of indicators for empirical opera-tionalization which has been proposed in the literature [24]. This collection of variables has been validated by a small number of decisions and expert discussions.
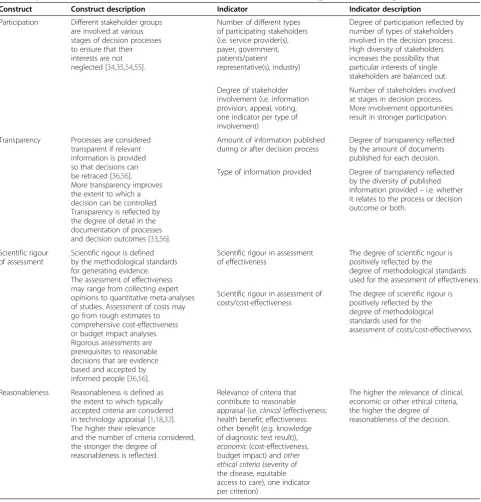
Table 1 Specification of constructs and measurement models for SEM of coverage decision-making
Construct Construct description Indicator Indicator description
Participation Different stakeholder groups are involved at various stages of decision processes to ensure that their interests are not neglected [34,35,54,55].
Number of different types of participating stakeholders (i.e. service provider(s), payer, government, patients/patient representative(s), industry)
Degree of participation reflected by number of types of stakeholders involved in the decision process. High diversity of stakeholders increases the possibility that particular interests of single stakeholders are balanced out.
Degree of stakeholder involvement (i.e. information provision, appeal, voting, one indicator per type of involvement)
Number of stakeholders involved at stages in decision process. More involvement opportunities result in stronger participation.
Transparency Processes are considered transparent if relevant information is provided so that decisions can be retraced [36,56]. More transparency improves the extent to which a decision can be controlled. Transparency is reflected by the degree of detail in the documentation of processes and decision outcomes [33,56].
Amount of information published during or after decision process
Degree of transparency reflected by the amount of documents published for each decision.
Type of information provided Degree of transparency reflected by the diversity of published information provided–i.e. whether it relates to the process or decision outcome or both.
Scientific rigour of assessment
Scientific rigour is defined by the methodological standards for generating evidence. The assessment of effectiveness may range from collecting expert opinions to quantitative meta-analyses of studies. Assessment of costs may go from rough estimates to comprehensive cost-effectiveness or budget impact analyses. Rigorous assessments are prerequisites to reasonable decisions that are evidence based and accepted by informed people [36,56].
Scientific rigour in assessment of effectiveness
The degree of scientific rigour is positively reflected by the degree of methodological standards used for the assessment of effectiveness.
Scientific rigour in assessment of costs/cost-effectiveness
The degree of scientific rigour is positively reflected by the degree of methodological standards used for the
assessment of costs/cost-effectiveness.
Reasonableness Reasonableness is defined as the extent to which typically accepted criteria are considered in technology appraisal [1,18,32]. The higher their relevance
and the number of criteria considered, the stronger the degree of
reasonableness is reflected.
Relevance of criteria that contribute to reasonable appraisal (i.e.clinical(effectiveness: health benefit; effectiveness: other benefit (e.g. knowledge of diagnostic test result)),
economic(cost-effectiveness, budget impact) andother ethical criteria(severity of the disease, equitable access to care), one indicator per criterion)
Translating the framework into a SEM, the steps of decision-making were considered as composites that de-fine the components, whereas the set of indicators pro-vided the definition of the measurement models (Figure 1). A description of constructs and correspond-ing measurement models which were defined in the re-flective mode is provided in Table 2.
Data
Data was obtained from an internet survey of decisions for expansion of NBS programmes in the European Union. NBS includes a number of promising technolo-gies relevant to third-party payers. Of these, tandem mass spectrometry allows screening of multiple disor-ders in one step. Experts provided information about
Partici-pation
Scientific rigour Number of participating
stakeholders
Scientific rigour in assessment of effectiveness
Scientific rigour in assessment of costs/cost-effectiveness
Trans-parency
Amount of information published during or after decision process
Reason- able-ness
Type of information provided
Number of stakeholders participating through information provision Number of stakeholders participating in appeal Number of stakeholders participating in voting
Effectiveness, health gain
Effectiveness other benefit
Budget impact
Cost-effectiveness
Severity of the disease Equitable access to healthcare
Structural model
+
+
+ +
+ +
+
+
+
+
+
+ +
+
+
+
+
+
+
Figure 1SEM for coverage decision-making.
Table 2 Specification of hypotheses: links between components of coverage decision processes
Component: cause Component: effect Hypothesized relationship
Transparency ! Reasonableness The more documents are provided that strongly relate to
dissemination of the process and decision outcome, the higher is the extent to which the decision is appraised against reasonable criteria because this facilitates a better control of the decision-makers.
Participation ! Reasonableness The more stakeholders participate in different stages of
decision-making, the more they mutually ensure that the technology is appraised against reasonable criteria.
Scientific rigour
of assessment !
Reasonableness The higher the methodological standards by which the
technology is assessed, the higher is the extent to which the decision is appraised against reasonable criteria, because decision-makers can draw upon better evidence regarding whether the criteria are met.
Transparency ! Scientific rigour of
assessment
The more documents are provided that strongly relate to dissemination of the process and decision outcome, the higher the methodological standard of technology assessment because the methodological quality can be better controlled by the scientific community.
Participation ! Scientific rigour of
assessment
The more stakeholders participate in different stages of decision-making, the higher the scientific standard of technology assessment because more evidence is identified and improvements of a weak evidence basis can more easily
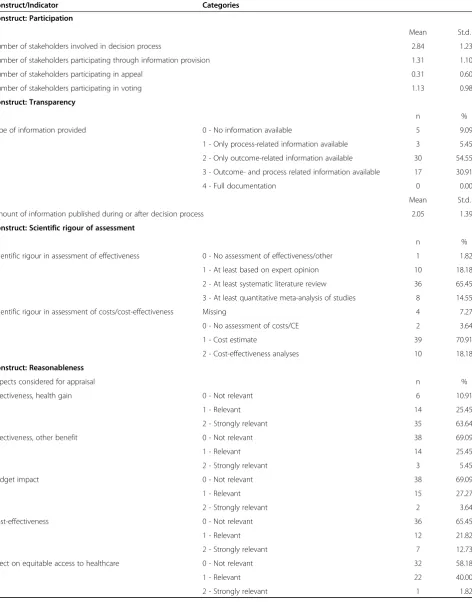
Table 3 Frequencies of indicators for case study on NBS in Europe
Construct/Indicator Categories
Construct: Participation
Mean St.d.
Number of stakeholders involved in decision process 2.84 1.23
Number of stakeholders participating through information provision 1.31 1.10
Number of stakeholders participating in appeal 0.31 0.60
Number of stakeholders participating in voting 1.13 0.98
Construct: Transparency
n %
Type of information provided 0 - No information available 5 9.09
1 - Only process-related information available 3 5.45
2 - Only outcome-related information available 30 54.55
3 - Outcome- and process related information available 17 30.91
4 - Full documentation 0 0.00
Mean St.d.
Amount of information published during or after decision process 2.05 1.39
Construct: Scientific rigour of assessment
n %
Scientific rigour in assessment of effectiveness 0 - No assessment of effectiveness/other 1 1.82
1 - At least based on expert opinion 10 18.18
2 - At least systematic literature review 36 65.45
3 - At least quantitative meta-analysis of studies 8 14.55
Scientific rigour in assessment of costs/cost-effectiveness Missing 4 7.27
0 - No assessment of costs/CE 2 3.64
1 - Cost estimate 39 70.91
2 - Cost-effectiveness analyses 10 18.18
Construct: Reasonableness
Aspects considered for appraisal n %
Effectiveness, health gain 0 - Not relevant 6 10.91
1 - Relevant 14 25.45
2 - Strongly relevant 35 63.64
Effectiveness, other benefit 0 - Not relevant 38 69.09
1 - Relevant 14 25.45
2 - Strongly relevant 3 5.45
Budget impact 0 - Not relevant 38 69.09
1 - Relevant 15 27.27
2 - Strongly relevant 2 3.64
Cost-effectiveness 0 - Not relevant 36 65.45
1 - Relevant 12 21.82
2 - Strongly relevant 7 12.73
Effect on equitable access to healthcare 0 - Not relevant 32 58.18
1 - Relevant 22 40.00
decisions made between 2005 and 2009 on screening for medium-chain acyl-CoA dehydrogenase deficiency, cystic fibrosis, congenital adrenal hyperplasia or other conditions. Forty-three respondents completed the questionnaire and the response rate was 70%. In the questionnaire, at least one question was stated for each construct (see Additional file 2: Survey questionnaire). A detailed description of the survey has been provided elsewhere [37].
From 21 countries, a total of 55 decisions were obtained. All variables to estimate the SEM arose from the data set and were specified as ordinal or count vari-ables according to the definitions provided in Table 2. An overview of descriptive statistics including the fre-quencies of categories for each indicator is provided in Table 3. Data preparation was performed with SAS Ver-sion 9.2 [38].
Evaluation of the structural equation model
For PLS-PM, no global goodness-of-fit criterion exists be-cause it is assumed that the variance is distribution free. Alternatively, a set of standard measures for PLS-PM exists according to which reliability and validity of the model estimation were evaluated [19,20,39]. Although all results were obtained from the iterative estimation at one time, the reflective measurement models were evaluated
before the structural model was assessed by another set of measures. Reliable and valid measurement models are pre-requisites for the evaluation of the structural model. All measures were obtained from the reports provided in SmartPLS [23]. As the SEM does not contain formative measurement models, these measures were neglected.
Evaluation of reflective measurement models
The reliability of the reflective − i.e. the causality goes from the construct to the indicators − measurement models was assessed at construct and indicator level. At construct level, composite reliability was considered, that measures whether the indicators consistently represent the same construct and the systematic error is consid-ered to be zero. Composite reliability accounts for the indicators’weights and is considered acceptable above a value of 0.7 for established constructs and above 0.6 in the early stages of research [19]. At indicator level, the factor loadings reflect the indicator’s variance explained by the construct. To assume reliable measures, at least 50% of the variance should be explained, which is reflected by loadings greater than 0:7pffiffiffiffiffiffiffi0:5.
Validity was evaluated through convergent and dis-criminant validity. Convergent validity assumes that the set of indicators uniquely represents the underlying con-struct. For this purpose, the average variance extracted
Partici-pation
Scientific rigour Number of participating
stakeholders
Scientific rigour in assessment of effectiveness
Scientific rigour in assessment of costs/cost-effectiveness
Trans-parency
Amount of information published during or after decision process
Reason- able-ness
Type of information provided
Number of stakeholders participating through information provision Number of stakeholders participating in appeal Number of stakeholders participating in voting
Effectiveness, health gain
Effectiveness other benefit
Budget impact
Cost-effectiveness
Severity of the disease Equitable access to healthcare
Structural model
0.274
0.251
0.107 -0.066
-0.260
0.813 0.419
0.896
0.956 0.901
0.383 0.976
0.393 0.440 0.711
0.324
0.433
0.685 0.512
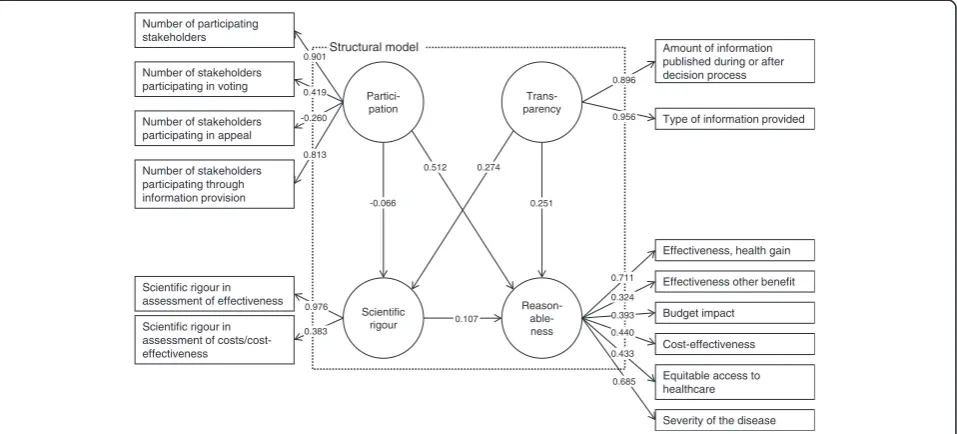
Figure 2SEM, estimation results after first estimation1.
Table 3 Frequencies of indicators for case study on NBS in Europe(Continued)
Severity of the disease 0 - Not relevant 12 21.82
1 - Relevant 15 27.27
(AVE) was considered to measure the variance of the indicators of the reflective construct relative to the total amount of variance, including the variance of the meas-urement error. To evaluate discriminant validity, two criteria were used that appraise whether the reflective constructs are sufficiently distinct from each other. First, the Fornell–Larcker criterion compares the AVE of a composite with the squared correlations between the construct and any other construct of the model. Dis-criminant validity can be stated if the AVE of the com-posite is larger than any other squared correlation. Second, the cross-loadings were compared to see whether the loadings with the corresponding construct were the highest.
Evaluation of the structural model
At the level of the structural model, the path coefficients were evaluated first in terms of sign and significance. They reflect the standardized beta coefficients for which asymptotic t-statistics were computed from the boot-strapping procedure. Second, the determination coeffi-cient R2 – analogous to multiple regression – reflects the level or share of the composites’explained variance. It was analysed for the endogenous composites. Third, the effect sizef2was computed to determine whether an exogenous construct substantially influenced an en-dogenous construct. Similar to the traditional partial F-test, the change in R2is computed if the respective ex-ogenous construct is omitted. Fourth, the predictive relevance of the structural model was evaluated to deter-mine how well the model parameters can be recon-structed using the model and the PLS parameters. For this purpose, the blindfolding procedure was performed in SmartPLS, which calculates Stone–Geisser’s Q2
(omission distance: 7). It displays the relative predictive impact of a construct. Values above zero indicate the presence of predictive relevance [40].
Model selection
As the SEM is at an early stage of development, it was assessed whether improvements in respect of model reli-ability and validity can be achieved. The model selection was based on the evaluation measures of the measure-ment models. It was suspected that, compared with other technologies, the case study of NBS inherits some peculiarities. Cost-effectiveness as decision criterion may have not been as relevant as for pharmaceuticals [41]. Besides, considered conditions are typically severe herit-able diseases which increase mortality and morbidity from infant age [42]. A modified SEM was then esti-mated and evaluated. Besides obtaining first estimations of the hypotheses for the case study of NBS, it was aimed to discuss implications for a general application of the SEM and PLS-PM as modelling technique for coverage decision-making.
Results
Results for reflective measurement models
In the first estimation, the evaluation measures of re-flective measurement models displayed some weak-nesses. Figure 2 displays the estimation results. A detailed overview of all evaluation measures is provided in Additional file 3: Evaluation measures. Reliability at construct level assesses whether the indicators consist-ently represent the same construct and the relevance of systematic errors. Accounting for the stage of develop-ment of the SEM, this was fulfilled for all constructs.
Partici-pation
Scientific rigour R2 = 0.07 Number of participating
stakeholders
Scientific rigour in assessment of effectiveness
Scientific rigour in assessment of costs/cost-effectiveness
Trans-parency
Amount of information published during or after decision process
Reason- able-ness R2 = 0.381
Type of information provided
Number of stakeholders participating through information provision Number of stakeholders participating in voting
Effectiveness, health gain
Budget impact
Cost-effectiveness
Severity of the disease Equitable access to healthcare
Structural model
0.287*
0.208*
0.089 0.486***
-0.085 0.875***
0.318
0.893***
0.957*** 0.869***
0.344 0.984***
0.523** 0.503** 0.472**
0.727*** 0.659***
Values of composite reliability were at least 0.6, which is acceptable at early stages of research [19].
Regarding indicator reliability, the factor loading, which represents the variance explained by the con-struct, was below 0.7 in five of six indicators of the‘ rea-sonableness’construct. This indicates a lack of reliability as the shared variance between the construct and the indicators is then lower than the variance of the meas-urement error. Below a value of 0.4, indicators should be eliminated [43]. The indicators ‘number of stakeholders participating in appeal’ of the ‘participation’ construct and the‘relevance of effectiveness in terms of other ben-efits in the‘reasonableness’construct were the indicators with values clearly below 0.4.
Regarding validity, the evaluation measures for conver-gent and discriminant validity also indicated a need for model modification. The average variance extracted (AVE), which describes whether the set of indicators uniquely represents the underlying construct, was less than 0.5 for the constructs ‘participation’ and ‘ reason-ableness’. This indicates that more than half the variance extracted results from the variance of the measurement error. Concerning discriminant validity to assess whether the constructs are sufficiently distinct from each other, the evaluation measures disclosed weaknesses in the
‘participation’ and ‘reasonableness’ constructs. The Fornell−Larcker criterion, which compares the AVE of a composite with the squared correlations between the construct and any other construct, revealed that at least one squared correlation with another construct was higher than the AVE for the construct ‘reasonableness’. A comparison of the loadings with the indicators’ cross-loadings with other constructs showed that values were at a maximum for all indicators except‘number of stake-holders participating in appeal’ of the ‘participation’ construct.
According to identified weaknesses, two indicators were removed because of their lack of reliability. Con-cerning the construct‘reasonableness’, the indicator that reflects the relevance of effectiveness in terms of other benefits was removed. The same applied for the indica-tor ‘number of stakeholders participating in appeal’ of the‘participation’construct.
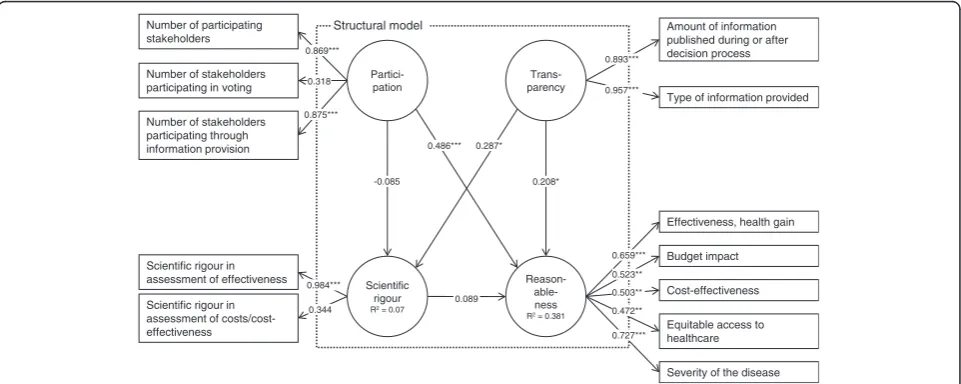
After re-estimation, criteria for reliability were fulfilled at the construct and indicator level for the reflective measurement models. The selected SEM is depicted in Figure 3, which includes the estimation results. Regard-ing reliability at indicator level, all factor loadRegard-ings were higher than 0.4 except for the indicators‘number of sta-keholders involved in voting’(loading 0.318) and‘ scien-tific rigour in assessment of effectiveness’ (loading 0.344). Convergent validity was fulfilled for all constructs except the construct‘reasonableness’. Here, the AVE has increased to a value of 0.342 but was still below 0.5.
Discriminant validity could be stated without caveat for all constructs. Both the Fornell−Larcker criterion was fulfilled and indicator loadings were at maximum at the assigned constructs. Bearing the weaknesses of indicator reliability and convergent validity in mind, the measure-ment models were considered acceptable for evaluation of the structural model.
Results for the structural model
The structural model was not rejected. The measures for
R2revealed that, for the construct ‘reasonableness’, 56%
of the share of the variance and, for the construct‘ scien-tific rigour’, 7% of the share of the variance was explained in the model. Three of the five hypotheses were supported for decision-making on NBS technolo-gies. Their path coefficients, which are interpreted as standardized beta coefficients, had the hypothesized dir-ection and were significant at least at the 90%- level. A higher degree of stakeholder participation (path coeffi-cient 0.486; p < 0.001) and transparency (0.208; p = 0.098) increased the degree of making reasonable coverage decisions. Furthermore, the degree of transpar-ency positively influenced the degree of scientific rigour (0.287; p = 0.051). The link between the constructs ‘ sci-entific rigour’and‘reasonableness’had the intended sign but was not significant (p = 0.57). It also had a very small path coefficient. A link between participation and‘ scien-tific rigour’was not supported, as the path was negative and not significant (p = 0.58). Thus, the degree of partici-pation did not influence the rigour of assessment.
The values of the effect size f2which reflect the influ-ence of the exogenous on the endogenous constructs in terms of the share of the variance, showed that the con-structs ‘participation’ and transparency’ contributed to explanation of the endogenous constructs to varying degrees. For the construct ‘participation, no effect was found for the contribution to the construct ‘scientific rigour’while a medium effect was identified for the con-tribution to the construct ‘reasonableness’. The con-struct ‘transparency’ both contributed to explanation of the endogenous constructs with a weak effect. The Stone−Geisser test, which assesses the model’s capability to predict, revealed mixed results. No predictive rele-vance was identified for the construct ‘scientific rigour’ (q2=−0.01) while a small predictive relevance was found for the reasonableness construct (q2= 0.04).
Discussion
Although the supposed links between observable indica-tors and constructs could be validated at measurement model level, further exploration is needed at the level of the structural model, especially if the tested hypotheses hold for other technologies. In spite of this, the qualita-tive interpretations of the results provide insight into whether PLS-PM produces plausible estimates and whether it is a suitable application for hypothesis testing using large data sets.
The case study reveals that the influence from the de-gree of stakeholder participation on reasonableness is about twice as influential as the degree of transparency in European NBS decisions. Besides, the degree of trans-parency significantly influences the level of methodo-logical standards for evidence assessments. Thus, the estimation results are capable of demonstrating that the process components of coverage decisions that describe elements of procedural justice and definition of substan-tive appraisal criteria influence each other. No influence was found for the path between participation and scien-tific rigour which suggests that NBS technologies were assessed independently from the influence of stake-holders. Also, the R2for the construct ‘scientific rigour’ was small which suggests that it is not well explained by the exogenous constructs of the SEM. On the contrary, considering the multiplicity of influences on coverage decision-making, the value of R2of the ‘reasonableness’ construct can be considered acceptable. Examples are in-stitutional configurations such as the level of decision-making or the implementation of the technology within the reimbursement scheme which are not described in this model [44].
Some features of NBS in comparison with other health technologies need to be kept in mind when interpreting the results. Although evaluation measures for the con-struct ‘scientific rigour’ are acceptable, the path coeffi-cient had no significant influence on the degree of
‘reasonableness’. This finding is supported in the litera-ture on evaluation of NBS technologies, which states that cost-effectiveness information have frequently not been considered for appraisal [41]. This is also in line with the small correlation between the indicator that reflects the scientific rigour of assessing costs/cost-ef-fectiveness and the construct. Compared with technolo-gies such as pharmaceuticals, coverage may not have been regulated as strictly, which is indicated by a low uptake of health technology assessment [37]. Further-more, survey respondents stated that funding of the screening tests was frequently negotiated between the payer and service providers, for which processes have not been defined (yet) or did not require disclosure of information. Thus, the degree of stakeholder participa-tion had the strongest influence of the reasonableness of decision-making and was significant. Regarding the
construct ‘reasonableness’, the effectiveness in terms of the health gain from testing and the severity of the dis-ease were the indicators that reliably reflected the con-struct in the selected model estimation. A reason why cost-related aspects were not as meaningful may be the relatively low cost of the screening technologies and, for selected disorders, the high perceived effects from screening of newborns [42]. Decisions on NBS were often made by institutions that do not typically decide on coverage of health technologies. Especially for phar-maceuticals, criteria such as cost-effectiveness and budget impact are perceived as being more relevant [1,13]. Thus, for the construct ‘reasonableness’, all cri-teria should be used at the start of the analysis if decision-making on health technologies is examined. Also, principal component or factor analysis on all observed indicators could be applied if the sample size is sufficient.
PLS-PM manages to account for the complexity be-tween the components stated in the model. As the goal of PLS-PM is to support the exploration and prediction of models under development, it provides guidance as to which link suggested for coverage decisions can be iden-tified empirically. Before the other hypotheses are ultim-ately rejected, further evaluation is needed about whether this is also true for other technological areas. The relation between scientific rigour and reasonable-ness might be significant as these components are tied more closely in other processes, e.g. the technology ap-praisal by the UK NICE [45]. Similarly, the relation be-tween the degree of participation and scientific rigour might be meaningful in other technological domains. In many countries, pharmaceutical manufacturers need to submit evidence on their products to obtain coverage [46]. Typically, this was not the case for NBS technolo-gies. Finally, the model demonstrated that PLS-PM may be applicable for contexts of decision-making where
‘soft’influences with high complexity and multiple links matter. Besides decision-analytic modelling, such approaches are demanded in healthcare, e.g. shared deci-sions between patients and physicians [47]. Nevertheless, a correct specification of the theoretical model is a cru-cial requirement to accurately interpret the empirical results. The conceptual specification of this SEM needs further elaboration through expert validation and discus-sion of the theoretical foundations. Furthermore, making confirmatory statements is limited when using PLS-PM. Instead, covariance-based SEM should be used [20].
techniques such as covariance-based SEM or multivari-ate regression analysis. However, application of these techniques is limited for the reasons for which PLS-PM was considered suitable, namely the capability to ac-count for small sample sizes and no possibility of defin-ing formative measurement models. Omittdefin-ing possible influences of the survey sample, it was not possible to split the data for the different stages of model develop-ment (i.e. model specification, test of significance) be-cause of the small sample size. A split sample design is appropriate for this purpose but was not applied.
Regarding model specification, theory dependency of the results cannot be neglected because the causal dependencies were specified without testing for other possible structures for the network of considered com-ponents. Bayesian network analysis would be suited to train and validate the model structure [48,49]. However, required data was missing for this purpose. No expert opinion about the possible causal relationships and no information about the probabilistic relationships be-tween constructs and indicators were available. By col-lection of further information, e.g. through an expert workshop, the model estimation could be used in future studies for validation. However, while theoretical con-siderations are developing, this study provides a first exploratory estimation of a SEM for coverage decision-making as well as measurement models that can be used for further analysis.
Potential unobserved heterogeneity between decisions has not been accounted for. Decision practices may dif-fer by healthcare system or technological characteristics. However, no distinct explanatory variables have been suggested for coverage decision-making in the literature. To treat heterogeneity, methods for PLS-PM are avail-able to identify plausible clusters ex post. Such techni-ques have been proved appropriate in marketing research [50], and similar approaches have been used in other contexts of health economics [51].
This study has quantitatively assessed the procedural aspects of decision-making such as stakeholder partici-pation and transparency, which have been claimed as relevant for fair and legitimate decision-making [17]. The accountability for reasonableness framework has predominantly been evaluated by qualitative approaches for which the evaluation of the effects frequently remains subject to judgements from a few case studies [52]. Furthermore, the framework neglects appraisal cri-teria and consensus on adequate assessment methods [53]. Specification of composites and several endogenous variables allows the combining of both process and ap-praisal simultaneously.
Compared with existing empirical research, the appli-cation of PLS-PM demonstrates that dependencies be-tween several constructs can be tested when using small
sample sizes. Previous work focuses on dependencies be-tween the decision outcome and selected appraisal cri-teria [10-13]. Relating to the work of Vuorenkoski et al., the estimation results have reconfirmed the relevance of transparency and stakeholder participation to ensure the quality of decision-making in the case of NBS [9].
Conclusions
This study presents a practical application of PLS-PM to a set of hypotheses for coverage decision-making on new-born screening programmes. Although PLS-PM is estab-lished in areas such as marketing and a comprehensive set of evaluation measures is available to assess model reliabil-ity and validreliabil-ity, the SEM on coverage in this study is among its early applications in healthcare. Accounting for the early stage in research, the estimates produce meas-urement models for the constructs‘transparency’,‘ partici-pation’,‘scientific rigour’and‘reasonableness’, which can be used for further model validation and hypothesis testing. The structural model results support the presence of three influences for decisions on newborn screening in Europe: (1) the influence of stakeholder participation and (2) trans-parency on the degree of making reasonable coverage decisions; and (3) the effect of transparency on the degree of scientific rigour of assessment.
PLS-PM allows the testing of hypotheses in situations where there are multidimensional interrelationships and composites that need operationalization by several ob-servable indicators. This estimation technique is thus compatible in accounting for the complexity of coverage decision-making to obtain a more realistic perspective of the influences between components of decision pro-cesses and appraisal criteria.
Additional files
Additional file 1:Systematic search.
Additional file 2:Survey questionnaire.
Additional file 3:Evaluation measures.
Abbreviations
AVE: Average variance extracted; NBS: Newborn screening; PLS-PM: Partial least square path modelling; SEM: Structural equation model.
Competing interests
This research was carried out on behalf of the Helmholtz Zentrum München, German Research Center for Environmental Health (HMGU). The HMGU is an independent organization funded by the German and Bavarian
governments. During the course of this study, the author was an employee of the HMGU and neither did nor does have a conflict of interest with regard to this study.
Author’s contribution
Acknowledgements and funding
I am deeply grateful to Reiner Leidl and Wolf Rogowski for valuable comments on a previous version of this article. I would also like to thank Marko Sarstedt and Björn Stollenwerk for commenting on the results and evaluation measures of the structural equation model as well as the manuscript.
The survey cited in this study has received funding from the European Union’s Seventh Framework Programme (FP7/2007-2013) under grant agreement no. 223533. The funding source had no role in the study design, data collection or interpretation of results.
Received: 24 October 2011 Accepted: 28 July 2012 Published: 2 August 2012
References
1. Sorenson C:Use of comparative effectiveness research in drug coverage and pricing decisions: a six-country comparison.Issue Brief (Commonw Fund)2010,91:1–14.
2. Taylor RS, Drummond MF, Salkeld G, Sullivan SD:Inclusion of cost effectiveness in licensing requirements of new drugs: the fourth hurdle. BMJ2004,329:972–975.
3. Chapman GB, Sonnenberg FA:Decision Making in Health Care. Cambridge: Cambridge University Press; 2000.
4. Rogowski WH, Hartz SC, John JH:Clearing up the hazy road from bench to bedside: a framework for integrating the fourth hurdle into translational medicine.BMC Health Serv Res2008,8:194.
5. Guasch JL, Hahn RW:The costs and benefits of regulation: implications for developing countries.World Bank Research Observer1999,14:137–158. 6. Wettermark B, Godman B, Neovius M, Hedberg N, Mellgren TO, Kahan
T:Initial effects of a reimbursement restriction to improve the cost-effectiveness of antihypertensive treatment.Health Policy2010, 94:221–229.
7. Lundkvist J, Jonsson B, Rehnberg C:The costs and benefits of regulations for reimbursement of new drugs.Health Policy2006,79:337–344. 8. Stafinski T, Menon D, Philippon DJ, McCabe CJ:Health technology funding
decision-making processes around the world: the same, yet different. PharmacoEconomics2011,29:475–495.
9. Vuorenkoski L, Toiviainen H, Hemminki E:Decision-making in priority setting for medicines–a review of empirical studies.Health Policy2008, 86:1–9.
10. Dakin HA, Devlin NJ, Odeyemi IA:'Yes', 'No' or 'Yes, but'? Multinomial modelling of NICE decision-making.Health Policy2006,77:352–367. 11. Devlin N, Parkin D:Does NICE have a cost-effectiveness threshold and
what other factors influence its decisions? A binary choice analysis. Health Econ2004,13:437–452.
12. Segal L, Dalziel K, Duncan M:Fixing the game: are between-silo differences in funding arrangements handicapping some interventions and giving others a head-start?Health Econ2009,19:449–465. 13. Harris AH, Hill SR, Chin G, Li JJ, Walkom E:The role of value for money in
public insurance coverage decisions for drugs in Australia: a retrospective analysis 1994–2004.Med Decis Making2008,28:713–722. 14. Clement FM, Harris A, Jing JL, Yong K, Lee KM, Manns BJ:Using
effectiveness and cost-effectiveness to make drug coverage decisions: A comparison of Britain, Australia, and Canada.JAMA2009,302:1437–1443. 15. Kanavos P, Nicod E, van den Aardweg S, Pomedli S:The impact of health
technology assessments: an international comparison.Euro Observer2010, 12:1–7.
16. Mason AR, Drummond MF, Ramsey S, Campbell J, Raisch D:Comparison of Anticancer Drug Coverage Decisions in the United States and United Kingdom: Does the Evidence Support the Rhetoric?J Clin Oncol2010, 28:3234–3238.
17. Daniels N, Sabin J:The ethics of accountability in managed care reform. Health Aff1998,17:50–64.
18. Erntoft S:Pharmaceutical priority setting and the use of health economic evaluations: a systematic literature review.Value Health2011,14:587–599. 19. Hair J, Ringle CM, Sarstedt M:PLS-SEM: Indeed a Silver Bullet.J Marketing
Theory Pract2011,19:139–152.
20. Henseler J, Ringle CM, Sinkovics RR:The use of partial least squares path modeling in international marketing. InAdvances in International Marketing. Volume 20th edition. Edited by Sinkovics RR, Ghauri PN. Bingley: Emerald; 2009:277–320.
21. Downey AM, Sharp DJ:Why do managers allocate resources to workplace health promotion programmes in countries with national health coverage?Health Promot Int2007,22:102–111.
22. Walter Z, Lopez MS:Physician acceptance of information technologies: role of perceived threat to professional autonomy.Decis Support Syst 2008,46:206–215.
23. Ringle CM, Wende S, Will A:SmartPLS 2.0.: ; http://www.smartpls.com. 24. Fischer KE, Leidl R, Rogowski WH:A structured tool to analyse coverage
decisions: development and feasibility test in the field of cancer screening and prevention.Health Policy2011,101:290–299.
25. Lovaglio P:Model building and estimation strategies for implementing the Balanced Scorecard in Health sector.Qual Quant2011,45:199–212. 26. Vigneau E, Qannari E:Clustering of Variables Around Latent
Components.Communications in Statistics - Simulation and Computation 2003,32:1131–1150.
27. Hutton J, McGrath C, Frybourg JM, Tremblay M, Bramley-Harker E, Henshall C:Framework for describing and classifying decision-making systems using technology assessment to determine the reimbursement of health technologies (fourth hurdle systems).Int J Technol Assess Health Care2006, 22:10–18.
28. Persad G, Wertheimer A, Emanuel EJ:Principles for allocation of scarce medical interventions.Lancet2009,373:423–431.
29. Cookson R, Dolan P:Principles of justice in health care rationing.J Med Ethics2000,26:323–329.
30. Baltussen R, Niessen L:Priority setting of health interventions: the need for multi-criteria decision analysis.Cost Eff Resour Alloc2006,4:14. 31. Sibbald SL, Singer PA, Upshur R, Martin DK:Priority setting: what
constitutes success? A conceptual framework for successful priority setting.BMC Health Serv Res2009,9:43.
32. Golan O, Hansen P, Kaplan G, Tal O:Health technology prioritization: which criteria for prioritizing new technologies and what are their relative weights?Health Policy2011,102:126–135.
33. Mitton CR, McMahon M, Morgan S, Gibson J:Centralized drug review processes: are they fair?Soc Sci Med2006,63:200–211.
34. Menon D, Stafinski T:Role of patient and public participation in health technology assessment and coverage decisions.Expert Rev Pharmacoecon Outcomes Res2011,11:75–89.
35. Abelson J, Giacomini M, Lehoux P, Gauvin FP:Bringing 'the public' into health technology assessment and coverage policy decisions: from principles to practice.Health Policy2007,82:37–50.
36. Bryan S, Williams I, McIver S:Seeing the NICE side of cost-effectiveness analysis: a qualitative investigation of the use of CEA in NICE technology appraisals.Health Econ2007,16:179–193.
37. Fischer KE, Grosse SD, Rogowski W:The Role of Health Technology Assessment in Coverage Decisions on Newborn Screening.Int J Technol Assess Health Care2011,27:305–312.
38. SAS Institute Inc:SAS version 9.2. NC, USA: Cary; 2008.
39. Götz O, Liehr-Gobbers K, Krafft M:Evaluation of structural equation models using the partial least squares (PLS) approach. InHandbook of Partial Least Squares. Edited by Esposito Vinzi V, Chin WW, Henseler J, Wang H. Springer Berlin Heidelberg: Springer Handbooks of Computational Statistics; 2010:691–711.
40. Tenenhaus M, Vinzi VE, Chatelin Y-M, Lauro C:PLS path modeling. Computational Statistics & Data Analysis2005,48:159–205.
41. Grosse SD:Economic evaluations of newborn screening. InEconomic evaluation in Child Health. Edited by Ungar WJ. New York: Oxford University Press; 2009:113–132.
42. Wilcken B, Wiley V:Newborn screening.Pathology2008,40:104–115. 43. Hulland J:Use of partial least squares (PLS) in strategic management
research: a review of four recent studies.Strateg Manag J1999, 20:195–204.
44. OECD: Chapter 4:Decision making and implementation: an analysis of survey results. InHealth Technologies and Decision Making. Edited by OECD. Paris; 2005:71–94.
45. Barbieri M, Hawkins N, Sculpher MJ:Who Does the Numbers? The Role of Third-Party Technology Assessment to Inform Health Systems' Decision-Making about the Funding of Health Technologies.Value Health2009, 12:193–201.
47. Scholl I, Koelewijn-van Loon M, Sepucha K, Elwyn G, Legare F, Harter M, Dirmaier J:Measurement of shared decision making–a review of instruments.Z Evid Fortbild Qual Gesundhwes2011,105:313–324. 48. Wu WW:Linking Bayesian networks and PLS path modeling for causal
analysis.Expert Syst Appl2010,37:134–139.
49. Jakobowicz E, Derquenne C:A modified PLS path modeling algorithm handling reflective categorical variables and a new model building strategy.Comput Stat Data An2007,51:3666–3678.
50. Rigdon EE, Ringle CM, Sarstedt M:Structural modeling of heterogeneous data with partial least squares. InReview of Marketing Research. Volume 7th edition. Edited by Malhotra NK. Armonk: Emerald Group Publishing Limited; 2010:255–296.
51. Deb P, Gallo WT, Ayyagari P, Fletcher JM, Sindelar JL:The effect of job loss on overweight and drinking.J Health Econ2011,30:317–327.
52. Sibbald SL, Gibson JL, Singer PA, Upshur R, Martin DK:Evaluating priority setting success in healthcare: a pilot study.BMC Health Serv Res2010, 10:131.
53. Rid A:Justice and procedure: how does 'accountability for
reasonableness' result in fair limit-setting decisions?J Med Ethics2009, 35:12–16.
54. Gauvin FP, Abelson J, Giacomini M, Eyles J, Lavis JN:'It all depends': conceptualizing public involvement in the context of health technology assessment agencies.Sco Sci Med2010,70:1518–1526.
55. McMahon M, Morgan S, Mitton C:The Common Drug Review: a NICE start for Canada?Health Policy2006,77:339–351.
56. Morgan SG, McMahon M, Mitton C, Roughead E, Kirk R, Kanavos P, Menon D:Centralized drug review processes in Australia, Canada, New Zealand, and the United Kingdom.Health Aff (Millwood)2006,25:337–347.
doi:10.1186/1472-6947-12-83
Cite this article as:Fischer:Decision-making in healthcare: a practical
application of partial least square path modelling to coverage of
newborn screening programmes.BMC Medical Informatics and Decision
Making201212:83.
Submit your next manuscript to BioMed Central and take full advantage of:
• Convenient online submission
• Thorough peer review
• No space constraints or color figure charges
• Immediate publication on acceptance
• Inclusion in PubMed, CAS, Scopus and Google Scholar
• Research which is freely available for redistribution