Metrics to Determine the Quality and Productivity during Software
Development
Sanjay Kumar1, Dr. Rahul Rishi2 and Dr. Rajkumar3
1 University Campus School, MDU. Rohtak, India,
2, 3
University Institute of Engineering and Technology, MDU. Rohtak, India.
1
ABSTRACT
Quality and productivity are important key factors of software development. From last two decades software product measurement paradigm improves a lot and becomes an emerging field of software engineering. Based on these programming approach, number of measureable suits are proposed in literature such as source code and design. However these are very old and need to be verified and validate. A variety of international standardized bodies such as IEEE and ISO as well as regular researches in the field, proposed a set of factors which influence the software quality and productivity attributes directly or indirectly. They provide a set of measures to evaluate it. The main aim of this paper is to define, analyze the Chidamber and Kamer measure suit with our project and provide new metrics that are beneficial to determine quality and productivity during software development.
Keywords: Software quality, Software productivity, software metrics, Chidamber and Kamer metrics, Productivity factors.
1. INTRODUCTION
Quality and productivity are important key parts of software development process. In last two decades software product measurement paradigm improves step by step and becomes an emerging field of software engineering. One of the common objectives of software engineering is to evaluate and improve the quality and productivity. Every one requires the best product, which fulfill the individual‟s requirement, must within time and budget. In recent years it becomes clear that if we want to produce quality, cost effective software then it is necessary to focus on both the products of software development and the process used for developing it.
Motivation for study
Lord Kelvin (1824-1907) stated [1] “To measure is to know” and “If you cannot measure it, you cannot improve it.” This thought motivates to develop metrics that helps to measure the quality and productivity in
easy and better way. So that, before the final delivery, the individual or the organization can measure its quality and productivity. By applying this idea it is tried to develop such metrics that is beneficial to measure the quality and productivity of the product and its attributes which have direct or indirect impact on the product. The main objective of software engineering is to improve the quality and efficiency of its engineering activities[2]. It is believed that these metrics will help to control, estimate and improve development process; consequently the organization can get benefits of these metrics to increase its quality and productivity.
2. LITERATURE REVIEW
According to Tausworthe(1982), Team productivity (P) P = Kilo Lines of Code/ Person months of effort Needed Staff size = Person months of effort / Project time duration in months
According to Banker et al.(1987), the environmental variables affecting the software team productivity are project management, personnel, user and technical environment.
According to Banker et al.(1991), Measurement model considers Function Points, SLOC, environmental variables, and any deviations from the project. Analysis/Design Activity Output measure = Function Points Coding/Testing Activity Output measure = Source Lines of Code, Input Measure = Total Labor hours
Scacchi(1995) states The major productivity improvements can result into substantial amount of savings in development costs.
volatility and complexity. α = % of Direct Development time / % of Idle time
According to Blackburn et al.(2002), project complexity increases the team size and team size decreases the team productivity significantly.
According to Chiang and Mookerjee(2004),The factors affecting the software development team productivity are the system construction time and coordination efforts.
According to Card (2006), Simple Model of Productivity considers the entities such as Product, Process or Sub-process, Requirements, Value, Cost, and Effort. Physical Productivity = Number of LOC / man hours or days or months Functional Productivity = Number of Function Points / Man hours or days or months Economic Productivity = Value / Cost Where Value = f (Price, Time, Quality, Functionality)
According to Nwelih and Amadin(2008), Software Productivity model includes Software Reuse complexity, length, functionality and effort. Productivity = Σ (ri + fi + li + ci) / ΣI Where ri = Reuse, fi = Functionality, li = Length, ci = Complexity, ΣI = Effort Gupta et al.(2010), Time-to-market pressure will affect software quality and change density.
In fact, De Aquino and De Lemos Meira, in their survey of productivity measurements, have identified four categories of output, which are; Physical Size, Design Size, Functional Size and value based metrics or use multidimensional models that assess different aspects of what is produced in a software project.
According to Vijayashree et al.(2011) proved strong teams have high productivity over all the assigned tasks where as weak teams have low productivity over all assigned tasks.
According to Wallin(2012), the effort of designing and evolving the architecture is often neglected during system development.
According to Danese and Filippini(2013), Product modularity is created by separating a product system into relative independent parts.
According to Hongyi Sun et al.(2014) Except for the time to market, quality, productivity and cost performance are all significantly better with more re-used modules.
3. SOFTWARE QUALITY
3.1 Definition
As like other definition, the definition of „Software Quality‟ is also varied and debatable. Some even say that it can‟t be defined and some says that it can be defined, but only in a particular context. Some even state confidently that „Quality is lack of bugs‟. In whatever manner we define it, it is true that quality is
something that, that we all aspire to. With changing time, requirement and growing competition, it becomes an important aspect of software development. Now software quality is the ability to control the software engineering process and methods to ensure quality. The methods are complex and may include compliance with the standards of one or more as ISO 9000 or CMMI. According to IEEE
- Quality is the degree to which a system, component or process meets specified requirement.
- It is the degree to which a system, component or process meets customer or user needs or expectations [3].
According to ISTQB
The totality of functionality and features of a software product that bear its ability to satisfy stated or implied needs.
From users point of view software quality is the customer‟s satisfaction with low level of defects and with low complexity or meeting all requirements in all the séance like cost, simplicity, service provided. So, quality is nothing but, to satisfy customer‟s functional and nonfunctional requirements of the product.
4. HOW TO INCREASE QUALITY
The main objective of software development projects is to fulfill either the stated or implied user requirements, which are commonly conceptualized in the form of software quality. From a decade, in software engineering the main focus is associated with software development. In recent years it becomes clear that if we want to produce quality software, cost effectively then it is necessary to focus on both the products of software and the process used for software development[4]. Both software and the process used for software development may be subjected to three things: development, evaluation (assessment, measurement, inspection, audit) and improvement [5].
Table 3.1 illustrates the procedure for software development.
SOFTWARE PROCESS
Software Development
Process Development
Software Evaluation Process Evaluation
Software Improvement
Table 3.2 Application of Chidamber and Kemerer metrics on project.
As the above table illustrates, the traditional focus of software engineering has been in the left-top corner rather than in other five segments. Today‟s requirement is that we raise maturity level of our knowledge, tools and practices associated with other five segments.
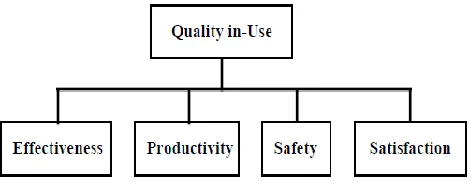
Fig. 3.1 ISO 9126 quality in-use model [13]
The ISO 9126 quality in-use model represents the attributes to be used and it is defined as “ the capability of the software product to enable users to expend appropriate amount of resources in relation to the effectiveness achieved in a specified context of use”[6].
4.1
Empirical Study
To get high quality software, it is important to measure the software and its attributes from beginning of development to the end of the product‟s lifecycle. Software quality is divided into two parts i.e. internal and external quality. Internal quality is the totality of characteristics of product from internal view.[7] It is measured and evaluated against the internal quality requirements. It can be improved during coding, reviewing and testing. External quality is the totality of characteristic from an external view.
Fig. 3.2 Relationships between types of software quality. [8]
It is measured and evaluated when software is executed and tested in a simulated Environment, with simulated data using external metrics. As previously mentioned, different views of software quality can be observed and analyzed. While measuring internal quality we use different software metrics that covers large aspects of object oriented development, such as complexity, inheritance, coupling and cohesion.
We have designed a „School Management System‟ software specially for University Campus School, keeping in mind its requirement and uses in C++ and measured the quality of software using Chidamber and Kemerer metrics.[9]
The above table illustrates the Chidamber and Kemerer metrics [9, 10] and their corresponding values for the software „School Management System‟. After successfully design of above software and study of more than 30 C++ products the following results are concluded.
Class Name CBO RFC LCOM WMC DIT NOC
Students 4 98 26 26 2 3
Employee 2 24 20 22 3 2
Admission 1 15 8 10 1 4
Load 2 8 5 5 0 2
Accounts 2 26 13 12 2 3
Library 2 15 16 15 1 6
Laboratory 0 13 13 13 2 4
Sports 1 8 5 5 2 2
Results 2 42 36 14 1 2
Canteen 0 6 6 6 0 2
Table: 3.3 Represents Chidamber and Kemerer metrics and their effects.
Chidambe
r and
Kemerer metrics
Definition Results Values
Coupling Between Object (CBO)
CBO for a class is a count of the number of non-inheritance related couples
with other
classes.
Higher CBO of a class is
Undesirable to modular
design
Leads to more faults
- Maintenance is more
difficult
- Rigorous testing is required
- Prevent reuse
< 14
Response
For a
Class (RFC)
It represents the
number of
methods of a class and the
number of
invoked
methods by
those class
methods.
Higher RFC of a class leads to,
- More faults
- More complex and harder to
understand
- Complicated testing and
debugging
- Increases the density of bugs
and decreases quality.
Vary accordi
ng to
project
Lack of
Cohesion in Methods (LCOM)
It is the number
of pairs of
methods which do not share instance variable, minus the number of
pairs of
methods that
share instance variables of the class.
The larger LCOM of a class lead to,
- more Complex
- Difficult is its
maintainability.
Vary accordi
ng to
project
Weighted Methods per Class (WMC)
It is the sum of the
complexities of all methods of a class.
If all the
complexities of all methods are
ones, then
WMC is the number of class methods
The higher CBO of a class leads to,
- More faults
- More difficult is reusing in
another application
- More complex is the testing
of that class.
10 to
50
Depth of Inheritanc
e Tree
(DIT)
DIT is a
measure of how many ancestor
classes can
potentially affect this class.
Higher DIT of a class leads to, More faults
- Greater design complexity
- Harder is the class
maintainability
- Promote reusability
≤ 5
Number of Children (NOC)
It is a measure of how many sub-classes are going to inherit the methods of the parent class.
Higher NOC of a class leads to,
- More testing is required
- Fewer faults
- More reusability
Vary accordi
ng to
The study of a number of projects shows that, as the value of CBO, RFC, WMC and DIT in a software product increases after a certain limit, it will decrease the quality of that software product. It also shows that reusability in software product increases its quality. DIT and NOC supports the reusability of software. So, while developing the software product the developer or team management should try to maintain the value of CBO, RFC, WMC and DIT low. We have studied the few attributes of quality, still many more attributes left which have direct or indirect impact on quality and productivity of software.
5. SOFTWARE PRODUCTIVITY
5.1
Definition
Productivity is a complex concept to be measured or even to define [11]. The productivity in ISO 9126 is a quality factor of the software product and is defined as “the capability of the software product to enable users to expend appropriate amount of resources in relation to the effectiveness achieved in a specified context of use”[12]. The informative Annex E of the ISO 9126-4 presents three other productivity measures [13] related to three types of resources as follows
- Human productivity = effectiveness ÷ human efforts
- Temporal productivity = effectiveness ÷ time - Economic productivity = effectiveness ÷ cost At most of time, Productivity is defined as „rate of output per unit of input‟ [14]. Output is measured by number of product we deliver. Input is the totality of efforts that is spent on product to deliver the software. Productivity = Size/Effort. From economic point of view productivity is defined as “the rate of output per unit of input used especially in measuring capital growth, assessing the effective use of labor, material and equipment”[15].
Productivity = (Size of product developed) / (labor consumed during product development)[16]. “Software engineers define productivity in terms of measure, rather than considering carefully what attribute is being captured”[17]. Moreover, software development is a human-based (“soft”) activity with extreme uncertainties from the outset. This leads to many difficulties in the reliable definition of software productivity.
5.2
How to increase productivity
Enormous growth in demand for best quality software and increased investment for software projects represents that software development is one of the major key market throughout world. With the increase in
demand and supply, its variety and complexity is also growing constantly. Rapid changing market requires software products with better reliability, more functionality and better performance. Therefore, the productivity as a quality characteristic is divided into three sub-characteristic, these are accuracy, effectiveness and completeness [13].
Fig. 4.1 High-level enhanced productivity model.[13]
To enhance the productivity, increasing the number of developer is not a solution. Infect the team or individual should have a clear actionable plan to work, deep code knowledge, reducing rework and minimize debugging [18]. Above all, in order to survive and compete in software market, Software providing organizations have to gain customers satisfaction by providing products with certain functionality must be delivered on time, within budget and to agreed level of quality.
6. EMPIRICAL STUDY
Productivity=
( ∑
∑ )*( ∑ )*(
∑ )
The results of the above proposed metric under C++ project „School management system‟ is as follows Table 4.1 illustrates reuse ratio and specialization ratio
Productivity=
( ∑
∑ )*( ∑ )*(
∑ )
= (162/191)*(3.2)*(0.304)
= 0.826
To reach the above metric, specialization ratio and reuse ratio are studied. Specialization ratio is the ratio of number of classes below the sub class to number of super class above the class. Reuse ratio is ratio of superclass above the class to the total number of class in the class hierarchy. Quality and its attributes also play an important role in the rapid growth of productivity. The productivity measurement method [23] ensures that each project has an expected productivity value of one. Productivity value between zero and one indicate lower than expected productivity whereas values greater than one indicates higher than expected productivity. There are many more attributes of quality and productivity that also must be considered and studied to get better productivity.
6.1 Comparison between productivity metrics
It is difficult to compare the metrics on the same project as every metrics use different methods. There are a number of factors that have direct or indirect impact on productivity.
Table 4.2 shows productivity metrics, their formula and corresponding values on the designed software.
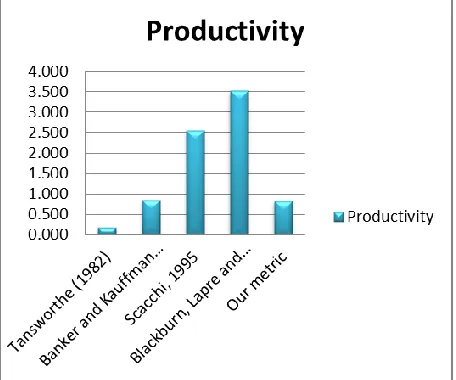
A fatty project or project with large coding does not means that the software has higher productivity. As, software reuse is an important aspect of present software development process. It plays an important role in software development, reuse software have less faults and more reliability. But Tansworthe, Banker and Kauffman, Scacchi, Blackburn has not considered reuse effect in their metric for productivity measurement. There are many other factors which also affect the quality and ultimately productivity such as CBO, RFC, WMC, NOC and DIT. So the above proposed metric is better in many ways than the metrics proposed earlier.
Fig. 4.2 Comparison between different metrics
Name of Class No. of
input modules
No. of
output modules
Reuse Ratio of the class
Specializ ation ratio
Students 24 14 0.333 2.5
Employee 23 18 0.222 4
Admission 15 10 0.200 4
Load 8 10 0.400 2
Accounts 26 18 0.222 1.5
Library 22 26 0.222 4
Laboratory 18 26 0.154 6.5
Sports 11 12 0.667 3
Results 38 18 0.222 4
Canteen 6 10 0.400 0.5
∑Input modules =191
∑Output modules =162
Average reuse Ratio = 0.304
Average Specializ ation Ratio = 3.2
S.No Developer's Name Metrics Productivity
1 Tansworthe (1982) Team Productivity=
Kilo lines of code / Person month of effort
2.537
2 Banker and
Kauffman (1991)
Productivity = (Size of Application
Developed) / (Labor
consumed during
development)
3.523
3 Scacchi, 1995 Productivity = Amount
of Output / Unit of Input Used.
0.848
4 Blackburn, Lapre
and Van
Wassenhove(2002)
Productivity = No. of function Points / Effort in man months.
0.176
5 Our metric Productivity =
(∑Output/ ∑input ) (∑ Specialization Ratio) * ∑ Reuse Ratio
6.2
Relation in Quality and Productivity
Quality gurus such as W. Edwards Deming, Philip Crosby, and J. M. Juran have long advocated the positive relationship between productivity and quality performance [24]. Deming‟s assertion is that as quality improves, costs decrease because of less rework, fewer mistakes and fewer delays. Quality and productivity can be considered as two sides of same coin. To increase the productivity, enhance the quality.
As quality increases the corresponding productivity will also increases, in last a stage comes when quality attains a saturation point, after that only productivity can be increased. A process that results in low-quality software can never be productive. To compete in rapid growing software market developers have to pay equal attention towards quality and productivity.
6.3
Factors affecting quality and productivity
The study of a number of software product shows that, as the value of CBO, RFC, WMC and DIT in a software product increases after a certain limit, it will decrease the quality of that software product. It also shows that reusability in software product increases its quality and productivity. DIT and NOC supports the reusability of software. So, while developing the software product the developer or team management should try to maintain the value of CBO, RFC, WMC and DIT low. There are a number of other factors too that effects quality and productivity. These includes programmers capability, the product, process, product setting, product characteristics, team cohesion, platform, experience, programmers programming language, tools experience, software application experience, analyst capability etc.[25] Other than these factors, there are constraint that controls programmers productivity such as time constraint, financial constraint, software specifications, corporate environment, programming methodology[26]. We have studies the few attributes of quality, still many more attributes left which have direct or indirect impact on quality and productivity of software.
7. CONCLUSION
In experiment a small projects is used. Different metrics of quality, productivity and their attributes are studied. The results are concluded and observed. One can conclude that this will also hold true for large projects which are greater and more complex. It is observed that productivity of good team is greater than individual and
SF(software factories) have good team, tools, experience and enormous environment, so they have better productivity then group or individual. A process that results in low-quality software can never be productive. Rework and debugging will undermine any gains made by delaying or discounting the role of the quality plays in fostering long term productivity. Reusability of components increases the quality and productivity. In the end, it is a long lasting process, and we are trying to get better quality and productivity but still much more can be achieved.
REFERENCES
[1] Lord Kelvin Quotations,
http://zapatopi.net/kelvin/quotes/, retrieved on 28.5.2012.
[2] C. Ebert, R. Dumke, Software Measurement, Springer, 2007
[3] Bouchaib, B., & Charboneau, R. (2005) An Evaluation of Productivity Measurements of Outsourced Software Development Projects: An Empirical Study. Proceedings of the 2nd Software Measurement European Forum, SMEF 2005, March 16-18, 2005, Rome, Italy.
[4] Anupriya et al., “Survey on Various Productivity Measures of Software Development Teams”, International Journal of Advanced Research in Computer Science and Software Engineering 4(6), June - 2014, pp. 462-464
[5] R.G. Dromey, Software Quality and Productivity Improvement Software Quality Institute, Griffith University, Nathan, QLD. 4111, Australia.
[6] ISO, ISO/IEC 9126-1: Information Technology – Product Quality - Part 1: Quality Model, Geneva, Switzerland: International Organization for Standardization, 2001
[7] N. Fenton, S. L. Pfleeger, "Software Metrics: A Rigorous and Practical Approach", second edition, International Thomson Computer Press, London, UK, 1997.
[8] ISO/IEC 9126. Software Product Evaluation – Quality Characteristics and Guidelines for the User, International Organization for Standardization, Geneva, 2001.
[9] Laila Cheikhi, Rafa E. Al-Qutaish, Ali Idri1 and Asma Sellami Chidamber and Kemerer Object-Oriented Measures: Analysis of their Design from the Metrology Perspective International Journal of Software Engineering and Its Applications Vol.8, No.2 (2014), pp.359-374
[10]S. R. Chidamber and C. F. Kemerer, “A Metrics Suite for Object- Oriented Design”, IEEE Transaction on Software Engineering, vol. 20, no. 6, (1994), pp. 476-493.
[11] ernandez-Lopez, A. ; Dept. Inf., Univ. Carlos III de Madrid, Legan s, Spain ; Colomo-Palacios, R. ; Garcia-Crespo, A. Productivity in software engineering: A study of its meanings for practitioners:
Understanding the concept under their standpoint Information Systems and Technologies (CISTI), 2012 7th Iberian Conference on 20-23 June 2012.
[12]ISO, ISO/IEC TR 9126-4: Information Technology - Product Quality - Part 4: Quality in Use Metrics, Geneva, Switzerland: International Organization for Standardization, 2004.
[13]Laila Cheikhi, Rafa E. Al-Qutaish, Ali Idri Software Productivity: Harmonization in ISO/IEEE Software Engineering Standards Journal of software, Vol. 7, No. 2, Februrary 2012.
[14]Capers Jones, VP and CTO; Namcook Analytics LLC Evaluating Software metrices and software measurement Practices March 14, 2014
[15]Oxford English Dictionary, 2nd edition, Oxford, UK: Oxford University Press, 2010.
[16]Krishnan, M.S., Kriebel, C.H., Kekre, S., & Mukhopadhyay, T. (2000) An Empirical Analysis of Productivity and Quality in Software Products. Management Science, 46(6):745-759.
[17]N. E. Fenton and S. L. Pfleeger, Software Metrics: ARigorous and Practical Approach, 2nd ed. Boston, MA. USA: PWS Publishing Company, 1997.
[18]Adam Kolawa, Parasoft Co-Founder and CEO. Increase Software Development Productivity: Equations for Efficiency 2012.
[19]C. Archer and M. Stinson, “Object-Oriented Software Measures, Technical Report”, Software Engineering Institute, Carnegie Mellon University, Pittsburgh, PA, USA, (1995).
[20] A. Abran, Software Metrics and software Metrology, IEEE Computer Society and John Wiley & Sons, Inc., New York, USA, (2010).
[21] J.-P. Jacquet and A. Abran, “From Software Metrics to Software Measurement Methods: A Process Model”, Proceedings of the 3rd International Symposium and Forum on Software Engineering Standards (ISESS'97), June 1-6, Creek, CA, USA, (1997), pp. 128-135. [22] ISO/IEC, Guide 99: International Vocabulary of
Metrology - Basic and General Concepts and Associated Terms (VIM), International Organization for Standardization, Geneva, Switzerland, (2007). [23]Kitchenham, B. ; Nat. ICT Australia, Alexandria,
NSW, Australia ; Mendes, E. Software productivity measurement using multiple size measures Software Engineering, IEEE Transactions on (Volume:30 , Issue: 12 ) Dec 2014.
[24]Izzah Azimah Binti Noh, “Relationship between Quality and Productivity” Furniture Technology, University Technology Mara Jengka Pahang. March 2014.
[25]Goparaju Purna Sudhakara, Ayesha Farooqband Sanghamitra Patnaikc, Measuring productivity of software development teams, Serbian Journal of Management 7 (1) (2012) 65 – 75
![Fig. 4.1 High-level enhanced productivity model.[13]](https://thumb-us.123doks.com/thumbv2/123dok_us/1327917.1640983/5.612.326.546.161.275/fig-high-level-enhanced-productivity-model.webp)