1176 | 2017 | ISSUE 4 | VOLUME 12 © 2017 University of Alicante
Default
and
individual
comparison
of
physiological responses and time-motion analysis
in male and female soccer players during
small-sided games
ZBIGNIEW JASTRZĘBSKI 1 , ŁUKASZ RADZIMIŃSKI
Gdansk University of Physical Education and Sport, Poland
ABSTRACT
The main purpose of this study was to report sex differences in the distances covered in the respective speed zones during small-sided games using default and individualized time–motion analyses. Eight male and 8 female soccer players performed small-sided games (4vs4, 4x4 min, 3 minutes of active recovery). Time-motion analysis was calculated in two ways. The first analysis was based on default speed zones, whereas the second was performed according to individual potential of each player (velocity at lactate threshold - V/LT and maximal running speed - Smax). The mean Smax and V/LT values in male soccer players were significantly higher (p=0.0002) than that in female soccer players (Smax: 8.38 vs 7.60 m∙s-1, p=0.0002; V/LT: 3.88 vs 3.12 m∙s-1, p=0.0000). The results of the default time-motion analysis demonstrated that men covered a significantly longer distance than women in standing and walking; p=0.0024; running, p=0.0141; high-intensity running (HIR), p=0.0052. In contrast, the results of the individual analysis showed that the distance covered in the HIR was significantly shorter in male soccer players (391.4 vs 590.63 m, p=0.0024). The results of this study show that using the default criteria may result in an underestimation of the distance covered by female soccer players in high-intensity running and sprinting. Key words: INDIVIDUALIZATION, GPS TECHNOLOGY, INTERVAL TRAINING, GENDER DIFFERENCES.
1Corresponding author. Gdansk University of Physical Education and Sport, K. Górskiego 1, 80-336 Gdansk, Poland
E-mail: [email protected]
Submitted for publication September 2016 Accepted for publication September 2017 Published December 2017
JOURNAL OF HUMAN SPORT & EXERCISE ISSN 1988-5202 © Faculty of Education. University of Alicante
doi:10.14198/jhse.2017.124.04 Cite this article as:
VOLUME 12 | ISSUE 4 | 2017 | 1177 INTRODUCTION
Small-sided games are one of the most popular training forms used for comprehensive development of soccer players (Hill-Haas et al., 2011). A previous study showed that small-sided games improve aerobic capacity, the level of soccer-specific skills (Radziminski et al., 2013), the ability to perform repeated sprints (Safania et al., 2011), and the player’s physical enjoyment (Los Arcos et al., 2015). Due to the specificity of the physical effort (numerous accelerations, run direction changes, number of contacts with the ball), small-sided games can be considered a training drill that effectively replicates the demands of a soccer match. Previous research has shown that the intensity of small-sided games is determined by factors such as pitch size (Casamichana and Castellano, 2010; Hodgson et al., 2014), number of players (Hill-Haas et al., 2011), playing time (Casamichana, et al., 2014), game rules (Halouani et al., 2014), and encouragement from a coach (Rampinini et al., 2007).
The available technology enables measurements of heart rate (HR) and the distance that a player covers during a match or training session. The activity profiles of male and female soccer players during matches have been described by many authors (Andersson et al.,, 2010; Di Salvo et al., 2007; Mohr et al., 2008; Mohr et al., 2003; Vescovi and Favero, 2014). Most of these studies showed that the distance a player covers on a full-sized pitch during a match is dependent on the playing position. Currently, coaches search for training drills that closely replicate the demands of match play. Small-sided games are one of the most popular training drills that meet these criteria. The basic task for the players performing small-sided games is usually to reach an intensity that is close to that in match conditions. Therefore, an accurate assessment of the internal and external training loads seems to be valuable.
Time-motion analyses of male soccer players during small-sided games have been previously described (Dellal et al., 2011; Hodgson et al., 2014). In contrast, there are considerably fewer publications that have examined the locomotion of female players (Gabett and Mulvey, 2008). Such analyses evaluating external load might be conducted using video cameras in conjunction with the appropriate software or with GPS micro-devices. The internal load is usually monitored by coaches using the data provided by heart rate monitors. Although the HR zone divisions consider individual capabilities (e.g., according to % HRmax), the divisions for speed zones are usually determined according to default values without considering the players’ individual capabilities. These divisions usually include five or six zones.
Monitoring a player’s HR and the distance he or she covers in a match provides objective data about the total load of the applied efforts. Using the obligatory and default speed zone divisions in the time-motion analyses of small-sided games may result in an inappropriate interpretation of the data, especially during high-intensity running (Bradley and Vescovi, 2015). Therefore, solutions for determining the speed zones for each player according to his or her potential are desired (Abt and Lovell, 2009; Jastrzębski and Radzimiński, 2015).
1178 | 2017 | ISSUE 4 | VOLUME 12 © 2017 University of Alicante MATERIALS AND METHODS
Study design
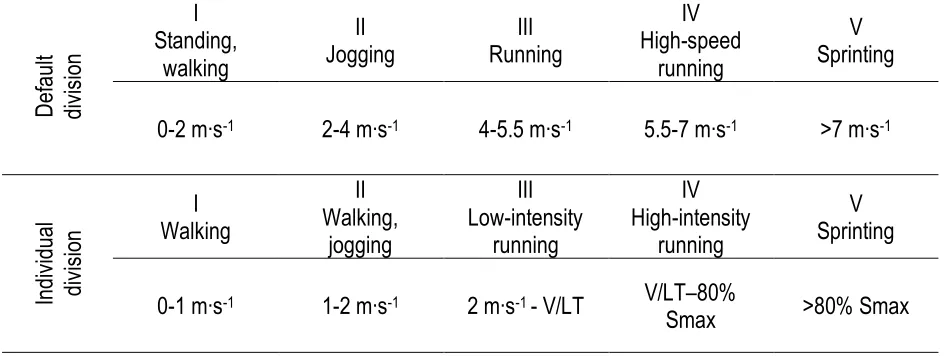
The study was performed during the competitive season. All players were participating in the same level of competition and had played for 90 minutes in the last two games for their club teams. A valid time-motion analysis that considers the potential of each player individually is possible when values such as running velocity, lactate threshold (V/LT), and maximal running speed (Smax) are known. To determine the V/LT, both male and female participants performed an incremental running test. The training session involving small-sided games was then implemented in the following week. To determine the maximal running velocity, all players performed two 40-meter sprints at maximum speed at the end of the warm-up during the small-sided games training session. The time-motion analysis was performed in two steps. In the first step, the players performed the following tasks according to the default speed zones: standing, walking: 0-2 m∙s-1, jogging: 2-4 m∙s-1, running: 4-5.5 m∙s-1, high-speed running: 5.5-7 m∙s-1, sprinting: >7 m∙s-1 (Rampinini et al.,
2007a). In the second step, the following speed zones were determined for each player according to the V/LT and S max: walking: 0-1 m∙s-1, walking, jogging: 1-2 m∙s-1, low-intensity running: 2 m∙s-1-V/LT, high-intensity running: V/LT-80% Smax, sprinting: >80% Smax (Jastrzębski and Radzimiński, 2015).
Participants
Sixteen professional male and female soccer players (members of the teams competing in the Polish First Division) took part in the study. Eight male (mean ± SD: age, 27.5 ± 5.14 y; stature, 180.5 ± 7.89 cm; body mass, 79.1 ± 9.67 kg) and 8 female (age, 19.1 ± 3.14 y; stature, 165.1 ± 7.59 cm; body mass, 58.0 ± 5.53 kg) players completed the tests and the experimental training session. All participants passed their pre-season medical examinations and had their sportsmen medical cards. The typical weekly training schedule for the tested players included 5-7 training sessions and 1 league game. The research was approved by the Ethical Committee of the Regional Medical Chamber.
Procedures
Lactate Threshold Determination
Individual lactate threshold values of the players were determined using the progressive test as previously described (Radzimiński et al., 2010). The test was performed 72 hours after the matchon a synthetic soccer pitch and 1 week before the small-sided game training session. The test protocol included 3.5–5 min running stages separated by a 1-min rest, during which a capillary blood sample was taken from the fingertip. The initial speed was set at 2.8 m∙s-1 and increased by 0.4 m∙s-1 after each stage until exhaustion. The running velocity at lactate threshold (V/LT) was determined using the Dmax method (Cheng et al., 1992). Blood samples were analyzed for lactate concentration using an A-15 analyzer (Biosystems SA, Costa-Brava, Barcelona, Spain, 2012). The samples were analyzed for lactate using an enzymatic method (Randox lactate analyzer) at 37°C with a spectrophotometer (EPOLL 200, Serw-med s.c., Poland, 2006). In addition, the maximal heart rate (HRmax) was determined during the test.
Monitoring Small-Sided Games
VOLUME 12 | ISSUE 4 | 2017 | 1179 speed in adult athletes. The games were played on a natural grass soccer field for 4 4-minute periods with 3 minutes of active recovery. Applied small-sided games were played with 4 players and a goalkeeper per team on a 40 x 30 m pitch (playing area per player = 120 m2). There were no modifications or limits to the rules (e.g., the number of contacts with a ball per possession). During the games, coaches motivated the players to increase their effectiveness. The HR responses were recorded in 5-s intervals using telemetry devices (Polar Team Sport System; Polar Electro OY, Kempele, Finland, 2013). Additionally, the capillary blood lactate samples were collected after each bout during the 3-minute recovery.
The time-motion analysis within the small-sided games was performed using previously validated (Castellano et al., 2011; Varley et al., 2012) portable GPS devices (minimaX 4.0, Catapult Innovations, Melbourne, Australia, 2013) with a frequency of 10 Hz. Data were analyzed using specialized software (Catapult Sprint 5.0, Catapult Innovations, 2010). During the experimental training session, the players wore vests placed on the upper back with GPS devices. As recommended, the GPS receivers were activated 15 min before starting the warm-up session.
The speed zones were divided in two ways. First, the zones were set according to Rampinini et al. (2007a). Next, the zones were assigned individually in compliance with the proposal of Jastrzębski and Radzimiński (2015). First, an analysis was performed using homogenous criteria for all players (male and female). In a second analysis, individual calculations were performed for values such as V/LT and Smax (Tab. 1).
Table 1. The default and individual division of the speed zones used in time-motion analyses.
D
ef
au
lt
div
is
ion
I Standing,
walking
II
Jogging Running III
IV High-speed
running
V Sprinting
0-2 m∙s-1 2-4 m∙s-1 4-5.5 m∙s-1 5.5-7 m∙s-1 >7 m∙s-1
In
div
idu
al
div
is
ion
I Walking
II Walking,
jogging
III Low-intensity
running
IV High-intensity
running
V Sprinting
0-1 m∙s-1 1-2 m∙s-1 2 m∙s-1 - V/LT V/LT–80%
Smax >80% Smax
Statistical Analyses
All results are presented as the mean ± SD. The data sets were assessed for normal distributions using the Shapiro-Wilk test. A t-test for independent variables was used to evaluate the differences between male and female players. When the data were not normally distributed, the Wilcoxon signed rank test was conducted. A repeated measures analysis of variance (ANOVA) was applied to assess the differences between bouts. All statistical analyses were performed using STATISTICA version 9.0 software (Statsoft Inc., Tulsa, OK). The level of significance was set at p < 0.05.
RESULTS
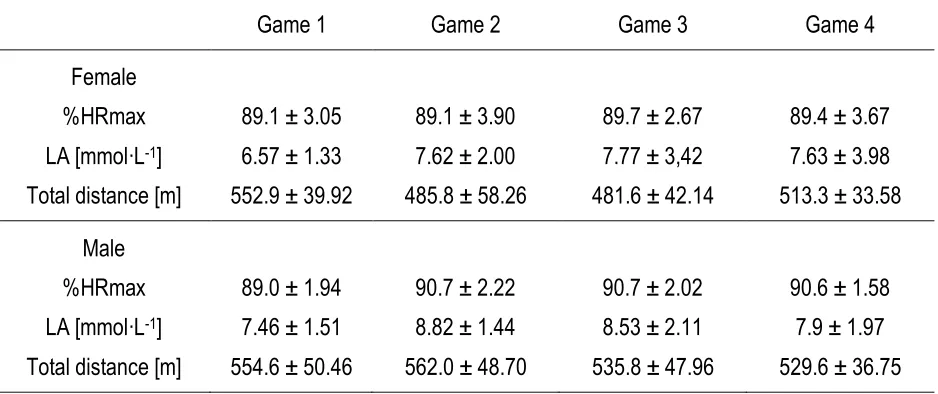
1180 | 2017 | ISSUE 4 | VOLUME 12 © 2017 University of Alicante There was no significant difference between the sexes in heart rate at lactate threshold (Tab. 2). Moreover, the intensity (%HRmax) during the small-sided games was comparable in both groups. The blood lactate concentration was higher in male players after each of the small-sided games. However, these differences did not reach statistical significance (Tab. 3). The total distance covered by male soccer players during the 16 minutes of the game was 148.5 m longer than that for female players (Tab. 4). The results of the default time-motion analysis demonstrated that men covered a significantly longer distance than women in the first (standing and walking; p=0.0024), third (running, p=0.0141), and fourth (HIR, p=0.0052) zones. Interestingly, no sprints were noted in female soccer players. Similarly, the individual time-motion analysis showed that the distance covered by male soccer players was significantly longer in the first (standing + walking, p=0.0001) and third (LIR, p=0.0147) zone. In contrast to the results of the default analysis, the distance covered in the HIR was significantly shorter in male soccer players (391.4 vs 590.63 m, p=0.0024). The repeated measures ANOVA showed that there were no significant differences in the players’ intensity or locomotion among the four SSG bouts.
Table 2. Physiological characteristic of the tested soccer players.
HRmax [b∙min-1]
HR/LT [b∙min-1]
HRLT/ HRmax
[%]
Smax [m∙s-1]
80 % Smax [m∙s-1]
V/LT [m∙s-1]
Female 199.4 ± 8.73* 176.3 ± 10.57 88.4 ± 3.38 7.6 ± 0.35* 6.1 ± 0.28* 3.12 ± 0.16*
Male 189.8 ± 8.15 173.0 ± 12.12 91.1 ± 3.01 8.38 ± 0.24 6.7 ± 0.19 3.88 ± 0.23
* Significantly different from male players at p < 0.05
Table 3. The intensity (%HRmax and LA) and total distance covered by female and male soccer players during applied small-sided games.
Game 1 Game 2 Game 3 Game 4
Female %HRmax LA [mmol∙L-1] Total distance [m]
89.1 ± 3.05 6.57 ± 1.33 552.9 ± 39.92
89.1 ± 3.90 7.62 ± 2.00 485.8 ± 58.26
89.7 ± 2.67 7.77 ± 3,42 481.6 ± 42.14
89.4 ± 3.67 7.63 ± 3.98 513.3 ± 33.58
Male %HRmax LA [mmol∙L-1] Total distance [m]
89.0 ± 1.94 7.46 ± 1.51 554.6 ± 50.46
90.7 ± 2.22 8.82 ± 1.44 562.0 ± 48.70
90.7 ± 2.02 8.53 ± 2.11 535.8 ± 47.96
VOLUME 12 | ISSUE 4 | 2017 | 1181 Table 4. A comparison of distances covered by male and female soccer players during small-sided games according to different approaches of time-motion analysis.
Default
Standing +
Walking Jogging Running
High-speed
running Sprint Total
Female 715.8 ± 5.32 1076.5 ± 188.63 213.3 ± 55.27 28.0 ± 40.07 - 2033.5 ± 135.04
Male 811.4 ± 47.87* 997.5 ± 139.01 282.6 ± 42.94* 84.9 ± 27.55* 5.6 ± 6.23* 2182.0 ± 152.27
Individual
Walking Jogging intensity Low-running
High-intensity
running Sprint Total
Female 132.3 ± 25.50 583.6 ± 54.56 717.6 ± 167.91 590.6 ± 84.33* 9.4 ± 20.8 2033.5 ± 135.04
Male 202.8 ± 26.33* 608.6 ± 45.00 956.6 ± 179.17* 391.4 ± 78.59 22.6 ± 20.63 2182.0 ± 152.27
*significant differences between the sexes at p <0.05
DISCUSSION
The main purpose of our study was to compare the intensity and locomotion of male and female soccer players during 4 vs 4 small-sided games. The players’ locomotion was analyzed in two steps. The first analysis was based on default speed zones, whereas the second was performed according to individual potential of each player (V/LT, Smax). The results of our study suggest that using the default criteria in the time-motion analysis may have led to an underestimation of the distance covered by the female soccer players in the HIR and sprint. Therefore, we believe that the evaluation of the training loads by coaches may be inappropriate.
Bradley et al., (2014) compared the locomotion of male and female soccer players participating in the UEFA Champions League competition. They observed that the total distance covered by men was significantly longer than that covered by women. These differences were evident particularly when the players were running at higher speeds. Because of such disproportionate differences in locomotion in match performance, the authors propounded that setting gender-specific speed thresholds is necessary.
1182 | 2017 | ISSUE 4 | VOLUME 12 © 2017 University of Alicante thresholds. This statement is confirmed by the results of the individual time-motion analysis, where the distance covered by male soccer players in the HIR and sprint (above V/LT) was 19% of the total distance. In female soccer players, the distance covered with speeds exceeding V/LT was 29.5%. However, it should be mentioned that there were significant differences (p<0.05) between men and women in the mean running velocity at lactate threshold (3.88 vs 3.12 m∙s-1,respectively). Thus, it seems that using homogenous speed thresholds for both male and female players may lead to an invalid data interpretation by coaches. The best example confirming this hypothesis is a lack of sprints in the small-sided games performed by female players when the sprint threshold was over 7 m∙s-1.
Previous studies provided different schemes for setting the high-intensity running thresholds. These values were between 13 and 18 km∙h-1 (3.61 – 5 m∙s-1) in females (3, 22) and between 13 and 20.9 km∙h-1 (3.61 – 5.8 m∙s-1) in males (11, 17). In our opinion, most of the papers include a lower limit for high-intensity running for women players that is too high.
A similar situation was observed while setting the running speed that is considered a sprint. According to the available publications, sprint values range between 4.72 and 8.33 m∙s-1 (Dellal et al., 2011, Mohr et al., 2003). The second of these values is even higher than the maximal running speed of the female players participating in our study. Using such criteria would result in not recording sprints during matches and small-sided games played in limited areas. Casamichana et al. (2014) reported that the highest speed reached by the players during a 6 vs 6 game that was played on a field of 60 x 49 m was 19.4 km∙h-1 (5.39 m∙s-1). Thus, according to the criteria used in most studies (including ours), the players involved in this game were not sprinting at all. However, this could have been affected by the rules of the game. Casamichana et al. (2014) used a possession game in their study in which the movement patterns could vary due to a lack of classical offensive and defensive actions, counterattacks, etc. The distance covered in sprinting by male and female players in our study was 1% and 0.5% of the total distance, respectively. However, due to unequal criteria, it is difficult to compare the present results with those reported by other authors.
It is widely known that the maximal oxygen uptake (Chamari et al., 2015; Ingebrigtsen et al., 2011; Miller et al., 2007; Reilly et al., 2000; Stølen et al., 2005) and maximal aerobic velocity (Dillern et al., 2012; Tonnessen et al., 2013) of female soccer players are lower than those of males. The limited aerobic potential reported in female players is an argument to search for solutions focused on determining the sex-specific speed thresholds in time-motion analyses. A similar situation is observed with young soccer players.
VOLUME 12 | ISSUE 4 | 2017 | 1183 The results of our study were obtained with the participation of two groups of 8 players each. We are aware that the low number of participants may be a limitation of this study. However, such small groups were dictated by the assumption that only players who played for 90 minutes in the last two league games could take part in the study. It was important for us to engage players with equal levels of fatigue. To the best of our knowledge, this is the first study comparing the locomotion of male and female soccer players in small-sided games according to individually set speed thresholds. The present results confirm that using default speed zones in time-motion analyses for males and females may underestimate the distance covered by women in HIR and sprinting. Moreover, our unpublished data show that similar dependences were observed in young soccer players and semi-professional players. Therefore, we assume that further research in this area may significantly improve the usefulness of the time-motion analyses in the training process.
PRACTICAL APPLICATION
The results of our paper confirm the validity of identifying individualized criteria for dividing the speed zones for soccer players to optimize the time-motion analyses during matches and training sessions. The need for such criteria is further confirmed by a growing number of clubs and federations using GPS technologies for monitoring the training loads of players. Along with micro-technology development, these tools will likely be as popular as heart rate monitors. Therefore, sport scientists should supply coaches with knowledge about proper exploitation of the GPS devices in their daily work. As reported in our study, using the default criteria may result in an underestimation of the distance covered by female soccer players in high-intensity running and sprinting. Thus, we suggest determining the running velocity at lactate threshold and maximal running speed and using these values to set the speed zones separately for each player. Such solutions will surely allow for an objective evaluation of the players’ locomotion, regardless of sex and age.
REFERENCES
1. Abt, G., and Lovell, R. (2009). The use of individualized speed and intensity thresholds for determining the distance run at high-intensity in professional soccer. J Sports Sci, 27(9), 893-898. https://doi.org/10.1080/02640410902998239
2. Andersson, H.A., Randers, M.B., Heiner-Moller, A., Krustrup, P., Mohr, M. (2010). Elite female soccer players perform more high-intensity running when playing in international games compared with domestic league games. J Strength Cond Res, 24(4), 912-919. https://doi.org/10.1519/JSC.0b013e3181d09f21
3. Bradley, P.S., Dellal, A., Mohr, M., Castellano, J. and Wilkie, A. (2014). Gender differences in match performance characteristics of soccer players competing in the UEFA Champions League. Hum Mov Sci, 33, 159-171. https://doi.org/10.1016/j.humov.2013.07.024
4. Bradley, P.S. and Vescovi, J.D. (2015). Velocity thresholds for women's soccer matches: sex specifity dictates high-speed running and sprinting thresholds – Female Athletes in Motion (FAiM). Int J Sports Physiol Perf, 10, 112-115. https://doi.org/10.1123/ijspp.2014-0212
5. Buchheit, M., Simpson, B.M., Peltola, E. and Mendez-Villanueva, A. (2012). Assesing maximal sprinting speed in highly trained young soccer players. Int J Sports Physiol Perf, 7, 76-78. https://doi.org/10.1123/ijspp.7.1.76
1184 | 2017 | ISSUE 4 | VOLUME 12 © 2017 University of Alicante 7. Casamichana, D., Suarez-Arrones, L., Castellano, J., Roman-Quintana, J.S. (2014). Effect of
number of touches and exercise duration on the kinematic profile and heart rate response during small-sided games in soccer. J Hum Kin, 41, 113-123. https://doi.org/10.2478/hukin-2014-0039 8. Castellano, J., Casamichana, D., Calleja-Gonzalez, J., San Roman, J., Ostojic S.M. (2011).
Reliability and accuracy of 10 Hz GPS devices for short-distance exercise. J Sports Sci Med, 10, 233-234.
9. Chamari, K., Hachana, Y., Kaouech, F., Jeddi, R., Moussa-Chamari, I., Wisløff, U. (2005). Endurance training and testing with the ball in young elite soccer players. Br J Sports Med, 39, 24–28. https://doi.org/10.1136/bjsm.2003.009985
10. Cheng, B., Kuipers, H., Snyder, A.C., Keizer, H.A., Jeukendrup, A., Hesselink M. (1992). A new approach to the determination of ventilatory and lactate thresholds. Int J Sports Sci Med, 13, 518-522. https://doi.org/10.1055/s-2007-1021309
11. Dellal, A., Lago-Penas, C., Wong, D.P., Chamari, K. (2011). Effect of the number of ball contacts within bouts of 4 vs. 4 small-sided soccer games. Int J Sports Physiol Perf, 6, 322-333. https://doi.org/10.1123/ijspp.6.3.322
12. Di Salvo, V., Baron, R., Tschan, H., Calderon Montero, F.J., Bachl, N. and Pigozzi, F. (2007). Performance characteristics according to playing position in elite soccer. Int J Sports Physiol Perf, 28, 222-227. https://doi.org/10.1055/s-2006-924294
13. Dillern, T., Ingebritsen, J., Shalfawi, S.A. (2012). Aerobic capacity and anthropometric characteristics of elite-recruit female soccer players. Serb J Sports Sci, 6, 43-49.
14. Gabett, T.J. and Mulvey, M.J. (2008). Time-motion analysis of small-sided training games and competition in elite women soccer players. J Strength Cond Res, 22, 543-553. https://doi.org/10.1519/JSC.0b013e3181635597
15. Halouani, J., Chtourou, H., Dellal, A., Chaouachi, A., & Chamari, K. (2014). Physiological responses according to rules changes during 3 vs. 3 small-sided games in youth soccer players: stop-ball vs. small-goals rules. Journal of Sports Sciences, 32(15), 1485–1490. https://doi.org/10.1080/02640414.2014.899707
16. Hill-Haas, S.V., Dawson, B., Impellizzeri, F.M., Coutts, A.J. (2011). Physiology of small-sided games training in football. Sports Med, 41, 199-220. https://doi.org/10.2165/11539740-000000000-00000 17. Hodgson, C., Akenhead, R., Thomas, K. (2014). Time-motion analysis of acceleration demands of
4v4 small-sided soccer games played on different pitch sizes. Hum Mov Sci, 33, 25-32. https://doi.org/10.1016/j.humov.2013.12.002
18. Ingebrigtsen, J., Dillern, T., Shalafi, S.A.I. (2011). Aerobic capacities and anthropometric characteristics of elite female soccer players. J Strength Cond Res, 25, 3352-3357. https://doi.org/10.1519/JSC.0b013e318215f763
19. Jastrzębski, Z. and Radzimiński, Ł. (2015). Individual vs general time-motion analysis and physiological response in 4 vs 4 and 5 vs 5 small-sided games. Int J Sports Physiol Perf, 15, 397-410. https://doi.org/10.1080/24748668.2015.11868801
20. Los Arcos, A., Vázquez, J.S., Martín, J., Lerga, J., Sánchez, F., Villagra, F., Zulueta, J.J. (2015). Effects of small-sided games vs. interval training in aerobic fitness and physical enjoyment in young elite soccer players. PLoS ONE, 10(9). https://doi.org/10.1371/journal.pone.0137224
21. Lovell, R. and Abt, G. (2013). Individualization of time-motion analysis: a case cohort example. Int J Sports Physiol Perf, 8, 456-458. https://doi.org/10.1123/ijspp.8.4.456
VOLUME 12 | ISSUE 4 | 2017 | 1185 23. Miller, T.A., Thierry-Aguilera, R., Congleton, J.J., Amendola, A.A., Clark, M.J., Crouse, S.F., Martin,
S.M., Jenkins, O.C. (2007). Seasonal changes in VO2max among Division 1A collegiate women soccer players. J Strength Cond Res, 21, 48-51. https://doi.org/10.1519/00124278-200702000-00009
24. Mohr, M., Krustrup, P., Andersson, H., Kirkendal, D., Bangsbo, J. (2008). Match activities of elite women soccer players at different performance levels. J Strength Cond Res, 22(2), 341-349. https://doi.org/10.1519/JSC.0b013e318165fef6
25. Mohr, M., Krustrup, P., Bangsbo, J. (2003). Match performance of high-standard soccer players with special reference to development of fatigue. J Sports Sci, 21, 519-528. https://doi.org/10.1080/0264041031000071182
26. Radziminski, Ł., Rompa, P., Barnat, W., Dargiewicz, R., Jastrzębski, Z. (2013). A comparison of the physiological and technical effects of high-intensity running and small-sided games in young soccer players. Int J Sports Sci Coach, 8, 455-465. https://doi.org/10.1260/1747-9541.8.3.455
27. Radzimiński, Ł., Rompa, P., Dargiewicz, R., Ignatiuk, W., Jastrzębski, Z. (2010). An application of incremental running test results to train professional soccer players. Balt J Health Phys Act, 2, 67-74. https://doi.org/10.2478/v10131-010-0007-8
28. Rampinini, E., Coutts, A.J., Castagna, C., Sassi, R., Impellizzeri, F.M. (2007a). Variation in top level soccer match performance. Int J Sports Physiol Perf, 28, 1018-24. https://doi.org/10.1055/s-2007-965158
29. Rampinini, E., Impellizzeri, F.M., Castagna, C., Abt, G., Chamari, K., Sassi, A., Marcora, S.M. (2007). Factors influencing physiological responses to small-sided soccer games. J Sports Sci, 25, 659-666. https://doi.org/10.1080/02640410600811858
30. Reilly, T., Bangsbo, J., Franks, A. (2000). Anthropometric and physiological predispositions for elite soccer. J Sports Sci, 18, 669-683. https://doi.org/10.1080/02640410050120050
31. Safania, A. M., Alizadeh, R., Nourshahi, M. (2011). A comparison small-side games and interval training on same selected physical fitness factors in amateur soccer players. J Soc Sci, 7, 349-353. https://doi.org/10.3844/jssp.2011.349.353
32. Stølen, T., Chamari, K., Castagna, C., Wisløff, U. (2005). Physiology of Soccer An Update. Sports Med, 35, 501-536. https://doi.org/10.2165/00007256-200535060-00004
33. Tonnessen, E., Hem, E., Leirstein, S., Haugen, T., Seiler, S. (2013). Maximal aerobic power characteristics of male professional soccer players, 1989–2012. Int J Sports Physiol Perf, 8, 323– 329. https://doi.org/10.1123/ijspp.8.3.323
34. Varley, M.C., Fairweather, I. H., Aughey, R.J. (2012). Validity and reliability of GPS for measuring instantaneous velocity during acceleration, deceleration, and constant motion. J Sports Sci, 30, 121-127. https://doi.org/10.1080/02640414.2011.627941
35. Vescovi, J. and Favero, T. (2014). Motion characteristics of women's college soccer matches: Female Athletes in Motion (FAiM) study. Int J Sports Physiol Perf, 9, 405-414. https://doi.org/10.1123/ijspp.2013-0526