Experimental Study of Nanofluids Flow in a Micromodel
as Porous Medium
A. H. Meghdadi Isfahani
1, M. M. Heyhat
2*1- Department of Mechanical Engineering, Najafabad Branch, Islamic Azad University, Isfahan, I. R. Iran
2- Faculty of Mechanical Engineering, K. N. Toosi University of Technology, Tehran, I. R. Iran
(*) Corresponding author: [email protected]
(Received:02 Apr. 2013 and Accepted: 23 May 2013)
Abstract:
For better understanding the effect of nanofluid flow in a porous medium, a set of experiments were conducted on a horizontal glass micromodel for Al2O3-water nanofluids. To characterize the flow of nanofluids the same experiment was done by pure water. The glass micromodel was constructed by a photolithography technique. The Al2O3-water nanofluids were produced by a two-step method and no surfactant or PH changes were used. The nanofluids were made in different volume fractions of 0.1%, 0.5%, and 1%. The experimental results show that the pressure drop of nanofluids through the micromodel increases up to 43% at volume concentration of 0.01. Moreover, the Al2O3-water nanofluids behave like a Newtonian fluid and follow Darcy’s law at low Reynolds numbers. The permeability of the porous medium has been evaluated in different volume fraction of nanofluids and pure water. The results reveal that the assessed permeability doesn’t change significantly in various volume concentrations of nanoparticles in the constructed micromodel. A semi analytical correlation was proposed for calculating the permeability of such porous medium.
Keywords: Nanofluid, Micromodel, Porous Medium, Permeability, Experiment.
Int. J. Nanosci. Nanotechnol., Vol. 9, No. 2, June 2013, pp. 77-84
1. INTRODUCTION
Recent developments in nanotechnology and related manufacturing techniques have made possible the production of distant nanoparticles (i.e. particles typically smaller than 100 nm). By dispersing such particles into traditional fluids such as water, ethylene glycol, and engine oil a new class of nanotechnology based fluids are produced called nanofluids. Nanofluids become attractive due to their potential benefits and applications in important fields such as energy generation, medical, transportation, micro and nano electromechanical
systems (MEMS & NEMS), etc [1]. Due to small sizes of nanoparticles, nanofluids can flow through the micro and nano scale throats. Therefore one of the interesting applications of nanofluids is using them as working fluid in the porous media. Fluid flow through porous media has considered scientific and technological interest [2-4].
standard photolithography technique on a silicon, polymer or glass substrate. Glass network models are one of the most important tools for research and study about the flow in complicated geometries such as filters and oil reservoirs. One of the most important preferences of these models is that they can be made with pores which are comparable in shape and size to actual pore geometries. In real rocks, on the other hand, they can accept all of the arbitrary patterns. Network model techniques have been used to visualize a wide range of processes in porous media [5-6].
A number of researches have been dedicated to nanofluids as part of nanotechnology application in enhanced oil recovery (EOR) nowadays. Nanoparticles have been speculated as good in-situ agents for solving reservoir engineering problems. Suspensions based on materials and nano-particles (nanofluids) are used in oilfields to enhance injection processes by changing wettability of porous media, increasing the viscosity of injecting fluid and decreasing the interfacial tension between injection fluid and reservoir fluid [7]. One of the challenges for this novel approaches includes propagating these suspensions through a porous media. Nanoparticles are small enough to pass through pore throats in typical reservoirs, but they nevertheless can be retained by the rock.
The ability to predict retention with distance traveled, and to predict the effect of different surface treatments on retention, is essential for developing field applications of such particles [8]. Compared to the emulsions stabilized by colloidal particles, nanofluids have better specifics. Nanoparticles are one hundred times smaller and emulsions stabilized by them can travel a longer distance through the pore throats. Some selected types of nanoparticles that are likely to be used include oxides of Aluminum, Zinc, Magnesium, Iron, Zirconium, Nickel, Tin and Silicon. It is therefore imperative to find out the effect of these nanoparticle oxides on oil recovery since this is the primary objective of the oil industry [9].
Binshan et al. [10] mentioned that Nanofluids based on polysilicon materials could change the wettability of porous surfaces. They used one kind
of polysilicon with sizes ranging from 10~500nm in oilfields to enhance water injection by changing wettability of porous media. The mechanism of enhancing water injection is through improving relative permeability of the water-phase by changing wettability induced by adsorption of polysilicon on the porous surface of sandstone.
On the other hand, the adsorption on the porous surface and plugging at the small pore throats of the polysilicon may lead to reduction in porosity and absolute permeability (K) of porous media. Thus the degree of success in well treatment is determined by the improvement of effective permeability of the water-phase. Yu et al. [11] showed that Silica nanoparticles could easily pass through the sandstone core without changing the core’s permeability.
A little adsorption was noted as silica nanoparticles flooded limestone core, but the core permeability was not changed. Therefore, deposition and adsorption of nanoparticles at surface pores causes the blockage in pore throat of porous media and reduces the permeability.
Hendraningrat et al. [12] investigated the deposition and pore-blockage of nanoparticles in glass micromodel. Hydrophilic nanoparticles and synthetic seawater (brine, NaCl 3 wt. %) as base fluid were chosen in their study.
To obviate the challenge of the flow behavior of nanofluids in porous media, more studies are needed, especially in experiment. The aim of this article is to examine flow behavior of alumina-water nanofluids in a porous medium experimentally. For simulating flow and transport in porous medium a small-scale artificial model of porous medium which is called micromodel has been constructed. Several experiments have been conducted on horizontal glass micromodel at several fixed flow rate conditions.
2. MATERIALS AND METHODS
2.1. Theory
For a fluid moving with a slow steady velocity (Re<1) the pressure drop (Δp) through medium and the volumetric flow rate per unit cross-sectional area of porous medium (U) are related through the empirical Darcy law:
k p U
L
µ
∆
= (1)
where k is the permeability, μ is the dynamic viscosity of the fluid and L is the thickness of the porous medium.
By measuring U for different pressure drops and using equation (1), one can derive the permeability k.
2.2. Preparation and properties of nanofluids
In the present work, a two-step method was used to produce uniform and stable nanofluids by adding the spherical Al2O3 nanoparticles (PlasmaChem GmbH) with a nominal average particle diameter of 40nm and the density 3.9 g/cm3 to distilled water. The process of preparation of Al2O3-water nanofluids is as follows: (1) weigh the mass of Al2O3 nanoparticles by a digital electronic balance; (2) put Al2O3 nanoparticles into the weighed distilled water gradually and agitate the Al2O3-water mixture; (3) sonicate the mixture continuously for 1h with an ultrasonic probe (UP400S, Hielscher GmbH) at 400 W and 24 kHz to produce uniform dispersion of nanoparticles in distilled water.
The nanofluids were made in different volume fractions (0.1%, 0.5%, and 1%) and no surfactant or pH changes were used.
Figure 1 shows the field emission scanning electron microscope (FESEM) image of the nanoparticles after dispersing in water.
The density of nanofluids can be calculated from the mixing theory as follows [13]:
(1
)
nf n bf
ρ
=
ϕρ
+ −
ϕ ρ
(2)The kinematic viscosity of the nanofluids was measured using a U-tube (reverse-flow) capillary viscometer (Petrotest ® Instruments GmbH & Co. KG) and then converted to the dynamic viscosity by multiplying the measured kinematic viscosity by the density of the nanofluid.
Figure 1: FESEM image of dispersed Al2O3 nanoparticles
The density and measured dynamic viscosity of nanofluids with 0.1%, 0.5% and 1% nanoparticle volume concentrations at room temperature are shown in table 1.
Table 1: The density and measured dynamic viscosity of working fluids at room temperature Property
Material Density (kg/m
3) (Eq. (2)) Dynamic viscosity (Pa.s)
2.3. Micromodel construction
The model used in this work consists of a glass substrate in which patterns, i.e. arrays of rectangular capillaries, have been etched. The dimension of the main pore network is (length × width) L×W= 96mm × 48mm. Corel-Draw software was used to draw network pattern. The matrix network consists of a pattern which has been reproduced by repetition of the cell shown in Figure 2. In this figure the black areas are the pores and white areas are the solid blocks.
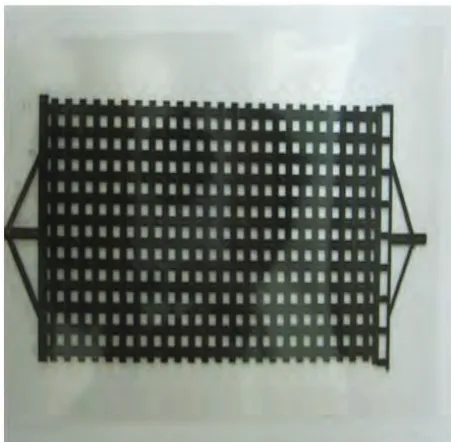
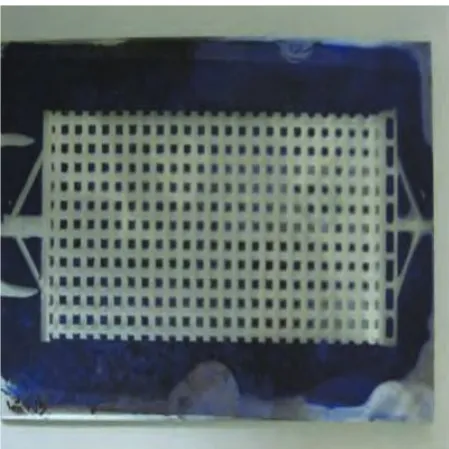
Glass model can be created using standard photolithography technique. The pattern was printed on a mask (see Figure 3). Glass substrate was coated with a photo resist (PR) polymer and selectively exposed to UV light by placing the mask directly above the glass. The areas of PR which were exposed to UV light were weakened and were removed utilizing a developer acid. Exposed areas of glass (e.g. areas not covered by PR) were etched using hydrofluoric acid. The Etched pattern on the glass substrate is shown in Figure 4. The etch depth, C, depends on the reaction time of the acid and is more difficult to control. The average depth of the model capillaries, measured using a confocal microscope, was 0.1 mm. The etched glass was then
fused to an unetched glass plate in a furnace. Two holes drilled at the end of flow distributors serve as inlet and outlet pores.
2.4. Experimental setup
The main parts of experimental setup are a syringe pump (JMS-SP500), a differential pressure transmitter (Smar-LD 301) and the constructed micromodel as porous medium. The schematic of the experimental setup is shown in Figure 5. In all experiments, the model was saturated with working fluid carefully to be assured that there wasn’t any trapped air bubbles in the micromodel. The accuracy of the volumetric flow rate produced by the syringe pump is ±0.1 mlit/hr, while that is ±50 Pa for the differential pressure transmitter. Thus the relative uncertainty of the permeability was obtained 0.03. This uncertainty is shown as error bar in Figure 9.
3. RESULTS AND DISCUSSION
3.1. Experimental results
Steady-flow tests were performed for pure water and
nanofluids with various volume fractions. Filling the micromodel with testing fluid and making certain no trapped bubble existence, it was connected to the filled small tube linking to the syringe pump. The syringe pump was set on a specified volumetric flow rate value. The steady state condition can be guaranteed when the pressure drop through the micromodel doesn’t change. The flow became steady after approximately 30 minutes. This time was also needed between two experiments.
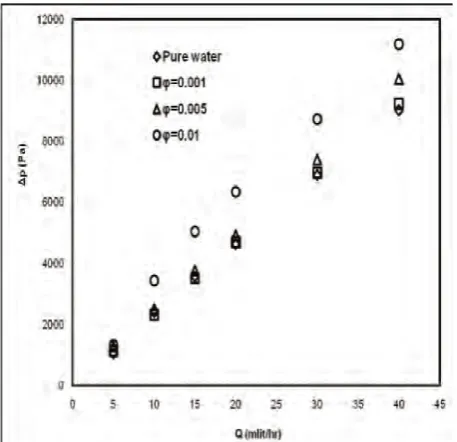
In each flow rate the associated pressure drop through the micromodel was recorded. Figure 6 displays the pressure drop of pure water and alumina-water nanofluids at the different volume fractions through the micromodel. As can be seen, with increasing the nanoparticles concentration, the pressure drop increases. These results are in agreement with the results of Aminzadeh et al. [14]. The pressure drop ratio of nanofluids to that of pure water at different volume fractions has been shown in Figure 7. The pressure drop augmentation is about 43% at volume fraction of 0.01. Moreover, the pressure drop increases with increasing the particle volume concentrations insignificantly.
The property of a porous medium, which allows a fluid to flow through it, is called permeability.
This parameter is determined entirely by the pore structure (i.e. porosity, pore shape, pore size and distribution among others) [2].
Measurement of permeability can be performed with recording various flow rates of the fluid as a function of pressure drop. Therefore, permeability is obtained by fitting a straight line to the data points and applying equation (1).
The mean velocity of fluid versus the pressure drop through the micromodel has been depicted for water and alumina-water nanofluids at various volume fractions in Figure 8. One can observe that achieved experimental results place on a straight line by a reasonable precision and the slopes of the linear fitting lines for different sets of data are very close to each others. This means that the Al2O3-water nanofluids follow Darcy’s law (eq. (1)) and behave like a Newtonian fluid. Moreover, the permeability of the porous medium has been evaluated by applying equation (1) and experimental data. Obtained results have been represented in Figure 9. It is obvious that the permeability is approximately constant. This result is in contrast with that obtained by Hendraningrat et al. [12] and Binshan et al. [10]. Their results showed that using nanofluids causes the blockage in pore throat
of porous media and reduction of the permeability. This discrepancy can be interpreted by considering the geometry of the porous medium. While the geometry of the porous medium is complicated the nanoparticles may deposit and clog the throats of the porous medium. Moreover, possible chemical reaction of nanoparticles with porous material may cause blockage and reduction in the permeability of the porous domain. The structured pattern of the pore network in the present study leads to have no significant change in the permeability by using nanofluids in different volume concentrations. Obviously the permeability depends on geometry and size of pores, especially for low Knudsen number, (Kn≤0.001), which the continuum flow assumption is confirmed [15].
3.2. The permeability evaluating of such porous medium
Consider steady and low Reynolds number flow of an incompressible fluid of viscosity µ in a capillary of rectangular cross section with width b=2mm and depth c=0.1mm. The flow is governed by the Poisson equation, with no-slip boundary conditions,
which leads to a symmetrical velocity profile, with respect to the two axes of the rectangular cross section of the capillary. The total volumetric flow rate, Q, is then given by the expression [16]:
(
)
3
5 1
tanh /
6 1 12
m m m
b c
b c P
Q c
b L
a
µ a
∞
=
∆
= − −
∑
(3)
where (2 1)
2
m m π
a = − . Therefore, in a single
capillary, the permeability k can be estimated using the equation below:
(
)
2
5 1
tanh /
1 6
1 12
m m m
b c c
k c
b
a
µ a
∞
=
= − −
∑
(4)
For a network of capillaries, fluids flow through the network at a total flow rate, net
Q , under the effect of total differential pressure applied across the network, ∆Pnet. Let Qi j, be the volume flow
rate through the bond (i-j) connecting nodes i and j. Then, at node i, the volume balance is:
, 0
i j
Q =
∑
(5) Figure 6: Pressure drop of pure water and Al2O3
-water nanofluids through the micromodel at different volume concentrations
Figure 7: The ratio of pressure drop of Al2O3 -water nanofluids to that of pure -water through the micromodel versus volumetric flow rate at different
where Qi j, can be calculated as bellow:
, , ,
,
i j i j i j
i j k bc P Q
L µ
∆ =
(6)
where Δpi,j, ki,j and Li,j=2mm are the pressure difference, permeability and length of the bond (i-j), respectively.
The boundary conditions for the whole network are a uniform and constant pressure at the inlet and at the outlet, Pin and Pout respectively. The total pressure drop across the network is:
net
in out
P P P
∆ = − (7)
Inserting Eq. 6 into Eq. 5 gives rise to a linear system in pressure with one unknown pressure for each node in the network. This can be solved to calculate the total flow rate, net
Q , and then the total permeability using the Darcy’s low [17]:
net net
net
Q L
k
bc P
µ
=
∆
(8)
where Lnet is the total length of the network. By translating these equations into a MATLAB
pro-gram, a numerical solution was done for calculating the permeability of the porous medium. The obtained numerical result is equal to 0.842×10⁻¹¹ m2. Quan -titative agreement is seen between the numerical and experimental results. The difference between these results can be related to the flow behavior and pressure drop at the inlet and at the outlet of the micromodel. Thus, an empirical coefficient β is introduced to match the numerical result with ex-perimental results. This coefficient was found to be 2.91 in our work. Therefore, the total permeability of the porous medium can be evaluated using the following equation:
net net
e net
Q L
k
bc P
µ
β
=
∆
(9)
4. CONCLUSION
Micromodel is small-scale artificial model of porous medium which is applied for simulating flow and transport in porous media. For better understanding the effect of nanofluid flow in a porous medium, a set of experiments have been conducted on a horizontal Figure 8: Mean velocity of fluids versus the
glass micromodel for Al2O3-water nanofluids at low volume fractions. To characterize the flow of nanofluids the same experiment was repeated using pure water. In each test the micromodel were initially saturated with the fluid and then placed in line. The main findings of this work can be summarized as follow:
•
The pressure drop of nanofluids increases up to 43% at volume concentration of 0.01. Moreover, the pressure drop in lower volume fractions, i.e. φ<0.005 increases slightly.•
The rate of changes in pressure drop as a function of flow rate for Al2O3-water nanofluids is linear. Thus the Al2O3-water nanofluids behave like a Newtonian fluid and follow Darcy’s law at low Reynolds numbers (creeping flow).•
The permeability of the porous medium doesn’t change in nanofluid flow, especially by changing the volume fraction of nanoparticles. For low Knudsen number, (Kn≤0.001), whichthe continuum flow assumption is confirmed the permeability depends on geometry and size of pores. This statement may not be satisfied in porous media with complicated geometries and smaller throat sizes.
•
An analytical study was performed to evaluate the permeability of the porous medium. It was found that it is possible to evaluate the permeability of such porous media successfully by introducing a correction factor.This experimental work enables us to better understanding of nanofluids flow in a porous medium. More experimental studies should be done for the future in various kinds of nanofluids. The numerical simulation of nanofluid flow in a porous medium is going to do as the next step of the present study.
ACKNOWLEDGMENT
This work has been financially supported by Najafabad branch, Islamic Azad University of Iran.
REFERENCES
1. R. Saidur, K.Y. Leong, and H.A. Mohammad, Renew Sust Energ Rev, Vol. 15, (2011), pp. 1646-1668.
2. D.A. Nield, and A. Bejan, convection in porous media, 3rd edition, New York, Springer, (2006).
3. A. J. Pelley, and N. Tufenkji, J Colloid and Interf Sci, Vol. 321, (2008), pp. 74-83.
4. F. He, M. Zhang, T. Qian, and D. Zhao, J Colloid and Interf Sci, Vol. 334, (2009), pp. 96-102.
5. Q. Wang, J.H. Lee, S. W. Jeong, A. Jang, S. Lee, and H. Choi, J Hazard Mater, Vol. 192, (2011) 1466-1475.
6. A. Maghzi, S. Mohammadi, M. H. Ghazanfari, R. Kharrat, and M. Masihi, Exp Therm Fluid Sci, Vol. 40, (2012), pp. 168-176.
7. A. Heydarian, R. Kharrat, and A. Hashemi, J Am Sci, Vol. 8, No 11, (2012), pp. 379-384.
8. E. Rodriguez, MR. Roberts, H. Yu, C. Huh, and SL. Bryant, SPE, (2009), 124418.
9. N. A. Ogolo, O. A. Olafuyi, and M. O. Onyekonwu, SPE, (2012), 160847.
10. J. Binshan, D. Shugao, L. Zhian, Z. Tiangao, S.
Xiantao, and Q. Xiaofeng, SPE, (2002), 77938.
11. J. Yu, C. An, D. Mo, N. Liu, and R. Lee, SPE, (2012), 153337.
12. L. Hendraningrat, L. Shdong, SPE conference (2012) Russia.
13. M.M. Heyhat, and F. Kowsary, ASME J Heat Trans, Vol. 132, (2010), 062401.
14. B. Aminzadeh, D.A. DiCarlo, M. Roberts, D.H. Chung, S.L. Bryant, and C. Huh, SPE, 2012, 154248.
15. A. F. Miguel, and A. Serrenho, J. Phys. D: Appl. Phys., Vol 40, (2007), pp. 6824-6828.
16. T.C. Papanastasiou, G.C. Georgiou, and A.N. Alexandrou, Viscous Fluid Flow, CRC Press, Bosa Raton, FL, (2000).