IJSRSET511822 | IRCT18 |March-April-2018 [(5)1 : 113-117]
National Conference on 'Innovative Research on Robotics, Circuits and Technology' (IRCT 2018) Organized By : CIrcuit Branches of SCSVMV, (EEE, ECE, EIE & Mechatronics) , Kanchipuram, Tamil Nadu, India
In Assotiation with International Journal of Scientific Research in Science, Engineering and Technology © 2018 IJSRSET | Volume 5 | Issue 1 | | Print ISSN: 2395-1990 | Online ISSN : 2394-4099
113
Application of LabVIEW in Digital System Design and Image
Processing
Janani R
Department of Electronics and Instrumentation Engineering, Sri Chandrasekharendra Saraswathi Viswa Maha Vidyalaya, Kanchipuram, India
ABSTRACT
The main objective of this article is to simulate the experiment of digital logic using LabVIEW. This article explains the application of LabVIEW in digital logic experimental teaching, and completed design of the assembly logic circuit output system and extinguished zero function of 12 digital display system and displayed the result by digital display. The actual experimental results verify the correctness of the simulation system, enrich the digital logic experiment teaching method and means, and enhance the students learning interest and enthusiasm.
Keywords: LabVIEW, Digital Logic Experiment, Seven Segment Display.
I.
INTRODUCTIONLabVIEW [1] is a graphical programming language that uses icons instead of lines of text to create applications. In contrast to text-based programming languages, where instructions determine program execution, LabVIEW uses dataflow programming, where the flow of data determines execution order. LabVIEW also includes several wizards to help you quickly configure your DAQ devices and computer-based instruments and build applications. In LabVIEW, you build a user interface by using a set of tools and objects. The user interface is known as the front panel. You then add code using graphical representations of functions to control the front panel objects. The block diagram contains this code. In some ways, the block diagram resembles a flowchart. Users interact with the Front Panel when the program is running. Users can control the program, change inputs, and see data updated in real time. Every front panel control or indicator has a corresponding terminal on the block diagram. When
a VI is run, values from controls flow through the block diagram, where they are used in the functions on the diagram, and the results are passed into other functions or indicators through wires.
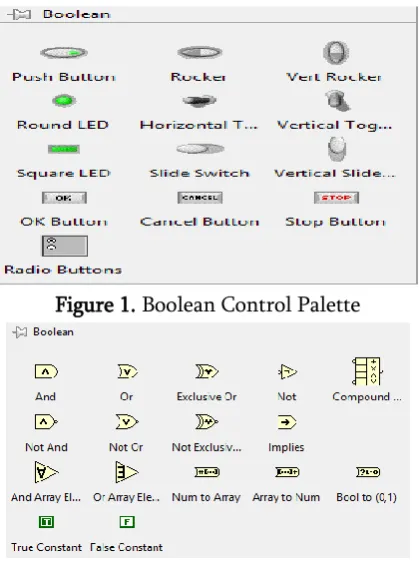
Figure 1. Boolean Control Palette
Figure 2. Boolean Functions Palette
II.
TYPES OF DIGITAL DISPLAY:The Common Cathode Display (CCD) – In the common cathode display, all the cathode connections of the LED‟s are joined together to logic “0” or ground. The individual segments are illuminated by application of a “HIGH”, logic “1” signal to the individual Anode terminals.
The Common Anode Display (CAD) – In the common anode display, all the anode connections of the LED‟s are joined together to logic “1” and the individual segments are illuminated by connecting the individual Cathode terminals to a “LOW”, logic “0” signal.
Figure 3. (a) Common cathode display Figure 3. (b) Common anode display
TRUTH TABLE FOR DISPLAY:
The Segment which is to be glow has given “High” as input.
Table 1. Truth Table for Hexadecimal Display
Individual Segments Display
a B c D e F g
1 1 1 1 1 1 0 0
0 1 1 0 0 0 0 1
1 1 0 1 1 0 1 2
1 1 1 1 0 0 1 3
0 1 1 0 0 1 1 4
1 0 1 1 0 1 1 5
1 0 1 1 1 1 1 6
1 1 1 0 0 0 0 7
1 1 1 1 1 1 1 8
1 1 1 1 0 1 1 9
1 1 1 0 1 1 1 A
0 0 1 1 1 1 1 b
1 0 0 1 1 1 0 C
0 1 1 1 1 0 1 d
1 1 0 1 1 1 1 e
1 0 0 0 1 1 1 F
Table 2. Boolean Expression SEGMENT EXPRESSION
„a‟ ̅ ̅ ̅ ̅ ̅ ̅ ̅
„b‟ ̅ ( ̅̅̅̅̅̅̅̅̅) ( ) ̅ ̅
̅ ̅
„c‟ ̅ ̅ ̅ ̅ ̅ ̅ „d‟ ̅ ̅ ̅ ̅ ̅ ̅ ̅ ̅
̅
„e‟ ̅ ̅ ̅ „f‟ ̅ ̅ ̅ ̅ ̅ ̅ „g‟ ̅ ̅ ̅ ̅ ̅
III.
IMAGE PROCESSINGapplications of image processing include: astronomy, ultrasonic imaging, remote sensing, video communications and microscopy, among in- numerable others. In this paper, we discuss teaching visualization tools developed for Digital Image Processing. An image may be defined as a two-dimensional function f(x ,y), where x and y are spatial coordinates and the amplitude of f at any pair of coordinates is called the intensity of the image at that point. The term gray level is used often to refer to the intensity of monochrome images. Color images are formed by a combination of individual images. For example, in the RGB color system a color image consists of three individual monochrome images, referred to as the red (R), green (G), and blue (B) primary (or component) images. For this reason, many of the techniques developed for monochrome images can be extended to color images by processing the three component images individually. An image may be continuous with respect to the x and y coordinates, and also in amplitude. Converting such an image to digital form requires that the coordinates as well as the amplitude be digitized. Digitizing the coordinate values is called sampling; digitizing the amplitude values is called quantization. [4][5] Thus when x, y and the amplitude values of f are all finite, discrete quantities, we call the image a digital image.
IV.
RESULTS AND SIMULATIONThe following are the steps required to design Seven Segment LED Hexadecimal display using NI
LabVIEW:
STEP 1: Open LabVIEW and press Ctrl + N followed by Ctrl + T keys to open new Front Panel and Block Diagram Window.
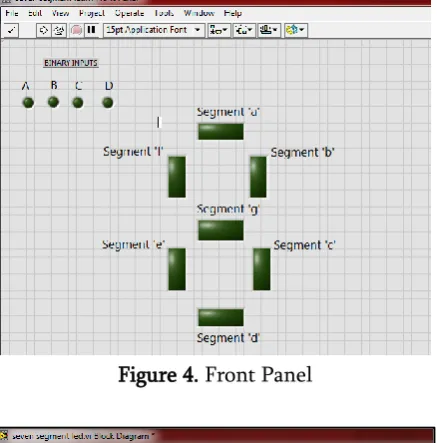
STEP 2: In Front Panel and from the menu select View Control Modern Boolean Round LED, drag and drop it on the front panel and Label as A (Input A), similarly select 3 more inputs and name it as B, C and D respectively. Arrange them as shown in Figure 4.
STEP 3: Similarly, In Front Panel and from the menu select View Control Modern Boolean Square LED, drag and drop it on the front panel and arrange them in Seven Segment LED Display and name each as individual segment “Segment a, Segment b, Segment c, Segment d, Segment e,
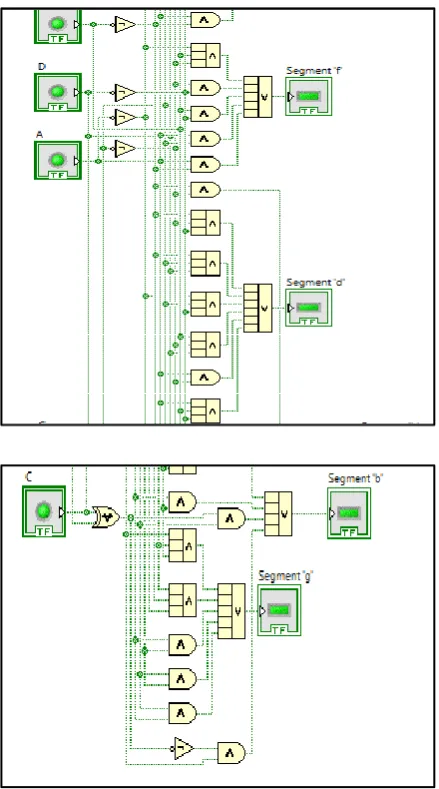
Figure 5. Block Diagram for Display
Segment f, Segment g. Arrange them as shown in Fig. 4.
STEP 4: Go to Block Diagram Workspace (Fig. 2) from the menu select Programming Boolean NOT gate, drag and drop it on the workspace for each and every input as shown in Fig. 5
STEP 5: From the menu select Programming Numeric Compound Arithmetic, drag and drop it on the workspace. Right Click the Compound Arithmetic, Select the option Change Mode choose which logic gate operation needed (OR, AND). This compound Arithmetic is used to do Logical and Arithmetic Operations for more than two inputs. STEP 6: Similarly select the suitable logic gates for the corresponding Boolean Expression for each segment as given in Table.2.
STEP 7: Connect each output of the Boolean expression to each of the indicator (Segments) as shown in Figure 3.
STEP 8: Return to Front Panel. Save the VI and press Run Continuously button to check the operation of seven segment display. Given different Binary Inputs and check the outputs from 0 to f.
Figure 6 shows the result of Seven Segment LED (Hexadecimal Display). The decimal values from 0 to 9 are obtained for the corresponding binary inputs as shown in Table 1. And also hexadecimal outputs such as „A‟, „b‟, „C‟, „d‟, „e‟, „F‟. Certain characters appear in lowercase because „B‟ looks similar to „8‟ in LED display and „D‟ looks similar to „0‟ in LED display.
Figure 6. Decimal/Hexadecimal Display from (0 to 9, A, b, C, d, e)
a) IMAGE HISTOGRAM:
display 256 numbers showing the distribution of pixels versus the grayscale values.
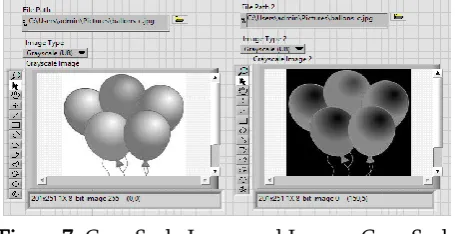
b) IMAGE INVERSE:
This function creates a new image that is the inverse of the input image, like the negative of a photo, this function is useful with images generates by absorption of radiation, that is the case of medical image processing. For a gray scale image with values from 0 to 255, this function is defined as: q= 255-p.
Figure 7. Gray Scale Image and Inverse Gray Scale Image
V.
CONCLUSIONLabVIEW software used in digital logic experiment teaching in another field application fields except of in the test of virtual instrument system. The introduction of digital logic experiment teaching LabVIEW software can give full play to visualization and operability of virtual instrument system, which enable the teaching process to become more intuitive and make the experiment process can fully reflect and strengthen the design of practice of self-created experiment. Thus Image processing can be enhanced further by Pattern Matching etc in LABVIEW software. This process of Image Acquisition and Processing can be extended to the real time application of object detection and diagnosis of faulty objects in process industries.
VI.
REFERENCES[1].Christopher G. Relf,"Image Acquistion and Processing with Labview",2004
[2].Ruben Posada-Gomez, "Digital Image Processing using Labview", Mexico
[3].Jovitha Jerome, "Virtual Instrumentation using LABVIEW"
[4].R. Gonzalez, R. Woods, "Digital Image Processing", 3rd Edition.
[5].Jayaraman,," Digtial Image Processing"