www.orientjchem.org Est. 1984
An International Open Free Access, Peer Reviewed Research Journal CODEN: OJCHEG
2012, Vol. 28, No. (2): Pg. 887-893
Development and Validation of RP- HPLC Method for
Simultaneous Determination of Niacin (Extended
Release) and Lovastatin in Oral Solid Dosage Form
G.S. DEVIKA
1*, M. SUDHAKAR
1and J. VENKATESHWARA RAO
21Department of Pharmaceutical Chemistry, Malla Reddy College of Pharmacy,
Maissamaguda Dullapally, Secunderabad -14 (India).
2Department of Pharmaceutical Chemistry,Sultan UlUloom College of Pharmacy,
Road No 3, BanjaraHills, Secunderabad - 500 034 (India). *Corresponding author E-mail: [email protected]
(Received: April 20, 2012; Accepted: May 29, 2012)
ABSTRACT
A simple, precise and rapid HPLC method has been developed and validated for the estimation of Lovastatin and niacin simultaneously in combined dosage form. Chromatographic separation of the two drugs was performed on a Purospher BDSC8 column (150mm×4.6mmid, 5µm particlesize).The mobile phase used was a mixture of 0.1% v/v triethylamine (pH 5.0), containing 20 mM of ammonium acetate buffer: methanol (30:70% v/v).Detection was performed at 237nm and sharp peaks were obtained forniacin and Lovastatin at retention times of 3.2±0.01 min and.6.4±0.01 min respectively.The calibration curve was linear in the concentration range 100-700µg/ml for niacin 3-18µg/ml for Lovastatin; the correlation coefficients were 0.9991 and 0.9992, respectively. The optimized method showed good performance in terms of specificity, linearity, detection and quantitationlimits, precision and accuracy in accordance with the International Conference on Harmonization (ICH) Q2 (R1) guidelines.This assay was demonstrated to be applicable for routine quantitation of Lovastatin and niacin in tablet dosage form.
Key words: Lovastatin, Niacin, Validation, Ion Pair RP-HPLC.
INTRODUCTION
Hyperlipidemia(HLP) isa group of lipid metabolism disorders with various pathogenesis. Its characteristicfeatureisan increaseincholesterol level,especially the low density lipoprote infraction (LDL) level or triglyceride level inblood. An increase in total and LDL cholesterollevelisrelated to the increased risk of is chemic heart diseaseas wellas
cerebral, coronary and peripheral circulation disorders1-2.
Lovastatin (LS) is a HMG-COA reductaseinhibitor 1 used in the treatment
-naphthalenyl 2-methylbutanoate3. The combination
of astatin with Niacin(NI) canbean attractive option because both have excellent records of improving cardiovascular outcomes and caneffectively correct all abnormalities of atherogenicdyslipidemia in patients with diabetes4.
Literature survey revealed spectrophotometric5, capillary electrophoresis6-7
and chromatographic methods8-11reported forest
imation of LS and NI individually or in combination with other drugs.One derivative spectrophotometric method12 method reported for this combination
However,thereisnoanalytical method reported for thesimultaneous determination of these drugs in a pharmaceutical formulation. Present work describes simple, rapid, accurate and precise High Performance Thin Layer Chromato graphic method for simultaneous determination of ATS and MET incapsules.Theproposedmethodwas validated as per ICH guidelines13.
Reagents and chemicals
HPLC grade methanol and water were procured from E.Merck, Mumbai,India. Triethylamine, Ammonium acetate AR grade were procured from Qualigens Fine Chemicals, Mumbai. A standard bulk drug sample niacin was provided by Madras pharmaceuticals, Chennai and of Lovastatin was kindly supplied by Cadila Health care pvt Ltd., Ahamedabad, India. Advicor® containing 500 mg of niacin and 20 mg of Lovastatin was obtained as a commercial source.
Instrumentation
Analysis was performed on Alliance HPLC System (Water’s Corporation, USA) consisting of 2695 separation module and 2998 Photo Diode Array (PDA) detector. Chromatogrpahic data was acquired using waters empower software.
HPLC Condition
HPLC was performed on an ODS C 8 column (250× 4.6 mm i.d.; 5 ìm particle size). The mobile phase consisted of 0.1% v/v triethylamine (pH 3.0), containing 1 mM ofSodium 1-hexanesulfonate: methanol (30:70% v/v).The mobile phase was filtered through a nylon 0.45 ìm, membrane filter and was degassed before use. The flow rate was 1.0 ml/min. The determination was
carried out at 237 nm, and the injection volume was 20 µL. The total run time was 10 min. The data were analyzed by waters empower software.
METHODS
Preparation ofstandard solutions and calibration curve
Standard stock solutions of NI and LS were prepared separately by dissolving 100mg of eachdrugin 100ml volumetric flask with 10ml of mobile phase and the solutions were sonicated for about 15 min.Then the volume was made up to the mark with mobile phase to get 1mg/ml standard stock solution. Several aliquots of these standard stock solutions were taken in different 10ml volumetric flask and diluted up to the mark with mobile phase such that the final linearity concentrations of niacin and lovastatin were 100-700 µg/ml and 3-18 µg/ml, respectively.
Assay standard solution preparation
A working standard solution containing 500 µg/ml of NI and 10µg/ml of LS were prepared from the above standard stock solution.
Analysis of tablet formulation
Twenty tablets of the formulation were weighed and the average weight of one tablet was calculated. All 20 tablets were crushed and grounded to a fine powder. Powder equivalent to 1000 mg of niacin and 20 mg of lovastatin was transferred into a 100 ml of volumetric flask and diluted up to the mark with the mobile phase and mixed well, then the solution was filtered through a 0.45 ìm filter to obtain a clear filtrate. This solution was suitably diluted and used for analysis. After setting the chromatographic conditions and stabilizing the instrument to obtain a steady baseline, a fixed volume of 20 ìl of the sample solution was loaded by an automatic sampler. The solution was injected, and chromatograms were recorded. The injections were repeated six times, and the peak area were recorded
Method validation
Quantification (LOQ), robustness, ruggedness studies in accordance with ICH guideline Q2(R1). The system suitability was assessed by five replicate analysis of the drug at a concentration as per standard preparation. System suitability of the method was evaluated by analyzing the repeatability, peak symmetry (symmetry factor), theoretical plates of the column, resolution between the peaks, capacity factor, and relative retention. Specificity was tested against standard compounds and against potential interferences inthe presence of placebo.
The linearity of the calibration curve was checked over the range of niacin and lovastatin were 100-700 µg/ml and 3-18 µg/ml.LOD and LOQ were calculated using ó (standard deviation of the response) and b (slope of the calibration curve) using the following formulae: LOD = (3.3 x ó) / b and LOQ = (10 x ó) / b.
The accuracy of the method was determined by recovery experiments. It wasconfirmedbyspiking known amount of working standard with placebo at three concentration levels
(50%, 100%, and 150%) and analyzed and theanalysisbeing done inreplicate.The results obtained were compared with the expected results. The precision of the method was demonstrated by repeatability, intra-day and inter-day variation studies at three different concentration level of analytes covering the concentration range. In the intra-day studies, three repeated measurements of standard and sample solutions were made in a day and three repeated measurements of standard and sample solutions were made on three consecutive days for inter-day variation studies. Percentages Relative Standard Deviation (RSD) were calculated for intra-day and inter day variation.
The ruggedness of the method was determined by carrying out the experiment on different instrument like Waters HPLC and Shimadzu HPLC by different operators using different columns of similar type likePhenomenex C8,HypersilC8. Robustness studies were performed on method precision by making slight variations in flow rate, amount of the mobile phase and pH changes.
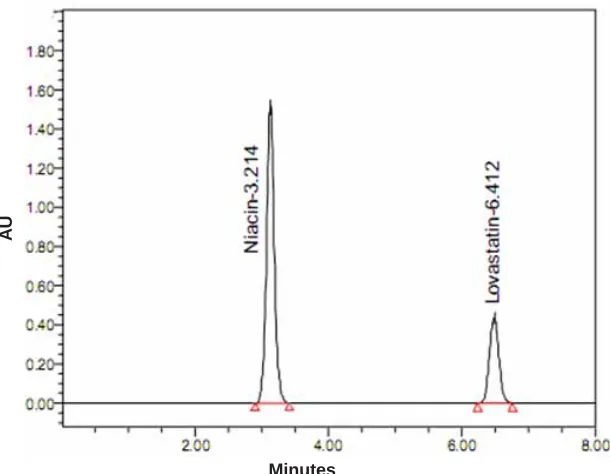
Fig. 1: Standard chromatogram of Sample Minutes
RESULTS AND DISCUSSION
Optimization of solvent system and chromatographic condition
The primary target in developing this method is to achieve simultaneous determination ofNI and LS in the tablet formulation under common conditions that will be applicable for routine quality control of the product in laboratories.Various development trials were taken for the development of a chromato graphic system for the estimation of LS and NI in their fixed dosage form. On the basis of their structural formula, the reversed - phase liquid chromato graphy was selected. Tr ials were performe dusing C18 stationary phase (4.6 mm,5 ìm) with varying column lengths from 250 to 150 mm and various brands (Thermo Hypersil C18, YMC-PackPro C18, Phenomenex C18 gemini, Waters XTerra RP18). Chromato graphic separation using Purospher C 8, 250 ×4.6 mm,5-ìm column gave higher retention time of 4.6 min for NI and 8.6 min for LS. The shorter column length (150mm ×4.6 mm ,5 ìm)of the same brand reduced the retention time to 3.2 min for NI and 6.4 min for LS with better resolution. The trial using Ammonium acetate buffer pH 5 with methanolintheratio of 30:70 (v/v) gave desirable chromato graphic separation with better
peak shape, tailing factor, plate count, and resolution. As the UV spectrum showed good response at 237 nm for both components, this wavelength was found suitable for simultaneous determination of both components.The standard chromatogram of sample was shown in Fig 1.
System suitability studies
System suitabilty testing is used to verify that the proposed method was able to produce good resolution between the peak of interest with high reproucibilty.The system suitability was determined by making six replicate injections from freshly prepared standard solutions of assay and dissolution method and analyzing each solute for their retention time ,theoretical plates,resolution,capacity factor and tailing factor and the results are shown in Table.1
Linearity
Linearity of the method was studied by spotting seven concentrations of the drug prepared in the mobile phase in the range of 100-700 forµg/ ml and NI and 3-18 µg/ml, for LS. The correlation coefficient (r) values were >0.999 (n = 7). Typically, the regression equations for the calibration curve were found to be Y = 1550 + 19.46 * X for NI and Y = 654.5 + 21.01 * X for LS and results were shown in Table.2.
Tablet studies
The proposed method was successfully applied to the analysis of marketed products (Advicor®) containing NI and LS. Three replicate determinations were performed on accurately weighed amounts of the tablets Table.2
Table.2: Regression analysis of calibration curves, sensitivity and formulation analysis
S.No Parameters Niacin Lovastatin
1 Linearity range 100-700 µg/mL 3-18 µg/mL
2 Slope 199.1 369.1
3 Intercept 1373 26.8
4 Correlation coefficient(r2) 0.999 0.999
5 Limit of Detection 5µg/mL 0.42 µg/mL
6 Limit of Quantification 20µg/mL 1µg/mL
7 Formulation analyzed (assay,%RSD) 100.49,0.45 99.97,0.28
Table.1:System suitability studies
Parameters Niacin Lovastatin
Theoretical plates 6135 5148
USP tailing 0.92 1.24
Resolution 5.36
Capacity factor 4.15 1.16
Precision and accuracy
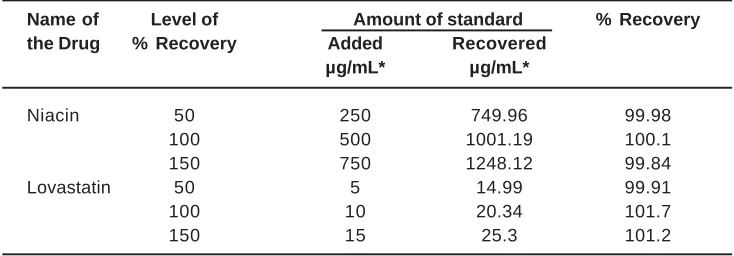
The method was found to be precise, as indicated by % RSD not more than 2. Intra-day and inter-day studies [Table 3] support the precision of the method. The proposed method when used for estimation of NI and LS from the pharmaceutical dosage form after spiking with the working standard afforded recovery of 99-101% Table.4
Sensitivity of the method
The limit of detection was found to be 5 µg/mL and 20µg/mL, while the limit of quantitation was found to be 0.42 µg/mL and 1 µg/mL for NI and LS, respectively. The low value of LOD and LOQ indicates that the method is sensitive.
Ruggedness
The ruggedness of an analytical method is the degree of reproducibility of the test results
obtainedby the samples under a variety of conditions, such as different laboratories, different analysts, different instruments, different lots of reagents, and different days. The %RSD of below 2% indicated that the method was accurate with high precision.
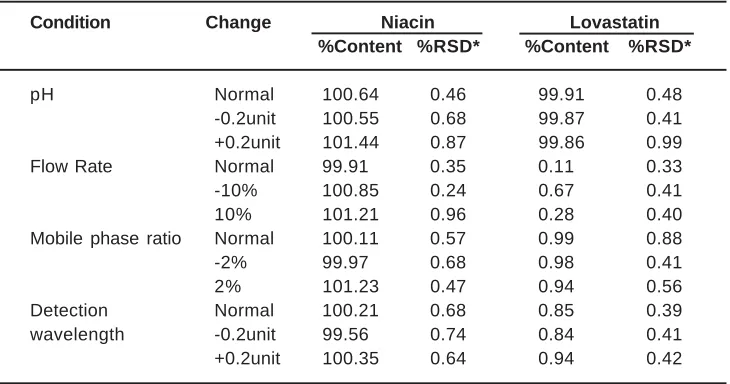
Robustness
Robustness is a measure of the performance of a method when small deliberate changes are made to the conditions of the method. The results of the robust ness study are summarized in Table 5.
Specificity
There is nointerferencewas detectedattheretentiontimeof niacin and lovastatinin samplesolution confirms the specificity of the method.
Table. 4: Robustness data for tablet analysis
Condition Change Niacin Lovastatin
%Content %RSD* %Content %RSD*
pH Normal 100.64 0.46 99.91 0.48
-0.2unit 100.55 0.68 99.87 0.41
+0.2unit 101.44 0.87 99.86 0.99
Flow Rate Normal 99.91 0.35 0.11 0.33
-10% 100.85 0.24 0.67 0.41
10% 101.21 0.96 0.28 0.40
Mobile phase ratio Normal 100.11 0.57 0.99 0.88
-2% 99.97 0.68 0.98 0.41
2% 101.23 0.47 0.94 0.56
Detection Normal 100.21 0.68 0.85 0.39
wavelength -0.2unit 99.56 0.74 0.84 0.41
+0.2unit 100.35 0.64 0.94 0.42
*Averageof sixdeterminations
Table. 3: Intra-day and inter-day precision (n=3)
Drug name Concentation Measured concentation µg/mL,RSD%
µg/mL Intra-day Inter-day
Niacin 400 µg/mL 399.68,0.24 400.11,0.65
700 µg/mL 701.23,0.14 699.23,0.38
900 µg/mL 899.04,0.89 900.12,0.58
Lovastatin 6 µg/mL 6.04,0.41 5.98,0.21
18 µg/mL 18.01,0.24 17.99,0.29
CONCLUSION
The proposed method gave good resolution between NI and LT with in short analysis time(<8.0min). Ruggedness of the method was confirmed as no significant changes were observed on analysis using different instrument. High percentage recovery of drug shows the method is
free from inference of excipients present in the formulation. The proposed method was found suitable forsimultaneousanalysisofNIandLTcanbe usedfor routine qualitycontroloftheir bulk drug mixtureandtheir combined dosageform. Its advantages are low costs reagents, speed and simplicity of sample treatment, satisfactory precision and accuracy.
Table. 5: Recovery studies for spiked concentration of Niacin and Lovastatin
Name of Level of Amount of standard % Recovery
the Drug % Recovery Added Recovered
µg/mL* µg/mL*
Niacin 50 250 749.96 99.98
100 500 1001.19 100.1
150 750 1248.12 99.84
Lovastatin 50 5 14.99 99.91
100 10 20.34 101.7
150 15 25.3 101.2
*Averageof sixdeterminations
1. Goodman and Gilman. The pharmacological basisoftherapeutics. 11, 933-60.
2. RangHP, DaleMM, RitterJM, Moore PK.
5,306-13.
3. TheMerckIndex,13thed.,MerckResearch laboratories,Merckand Co., INC.,White HouseStation,NJ, 5610(2001).
4. Moon Y.S, KashyapM.L.Niacin extended release-Lovastatin combination theraphy of lipid disorers.ExpertOpin Pharmacother.
3(12):1762-71 (2002).
5. SharafEl-Din MMK, AttiaKAM, NassarMWI, KaddahMMY. Colorimetric determination of simvastatin andlovastatin in pure form and inpharmaceutical formulations. Spectrochim Acta A: Mol Biomol Spectrosc., 76: 423-428 (2010).
6. Li M, Fan L-Y, Zhang W, Sun J, CaoC-X.Quantitativeanalysis of lovastatin in capsuleof Chinese medicine Monascusby
REFERENCES
capillary zone electrophoresis with UV-visdetector. J PharmBiomedAnal.; 43:387-392 (2007).
7. WindahlKL, TrenerryVC, Ward CM.The determination of niacin in selected foodsby capillary electrophoresis and high performance liquid chromato graphy: acid extraction. Food Chem., 65: 263-270 (1999). 8. Sirnivasu MK, Narasa RA, Roa
DS. Determination of Lovastatin and Simvastatin in pharmaceutical dosage forms by HPLC. Indian Drugs; 41(3): 156-159 (2004).
9. PillaiAD,RavishankarMN,HandralRD.High Performance Thin Layer Chromatographic method for estimation of Lovastatin tablets. Ind J Pharm Sci, 201: 420-422.
plasma. J Pharm Biomed Anal. 36:1045-1052 (2005).
11. Yuan H, Wang F, TuJ, PengW, LiH.Determinationof lovastatin in human plasma byultra-performance liquid chromatography-electrospray ionization tandem mass spectrometry and its application in a pharmacokinetic study. J Pharm BiomedAnal., 46: 808-813 (2008). 12. M.Kazemipour,M.Ansari,H.Ramezaniand
M . M o r a d a l i z a d e h , S i m u l t a n e o u s determination of lovastatin and niacin in tablet by first and third derivative spectrophotometry and H-point standard addition methods. Research in Pharmaceutical Sciences ;7(2): 95-102 (2012).