3290 IJSTR©2020
www.ijstr.org
Weight Based- Artificial Neural Network (W-Ann)
For Predicting Dengue Using Machine Learning
Approach With Indian Perspective.
Rajeev Kapoor, Variender Kadyan, Sachin Ahuja
Abstract: Dengue is a rising vector borne disease in India. It becomes a burden for whole community residing in India. Unfortunately, still there is no vaccine discovered. Prevention and control of Dengue is still challenge for developing countries like India. The goal of this study is to investigate the influence, symptoms and clinical test parameters that belong to Dengue disease with an Indian perspective. This main aim is to develop a prediction model for early detection of Dengue. The propose prediction model is divided in to the following phases i.e. data preprocessing, training of ANN network with weights of symptoms & signs as well as evaluation function. Machine learning models namely decision tree, random forest and support vector machine is used to detect high priority symptoms. The experimental results show that support vector machine approach is more suitable for propose prediction model with in Indian environment. The future scope of this paper can be extended in to with other diseases like malaria, Chikungunya and Zika etc.
Index Terms: Artificial Neural Network, Dataset, Decision Tree, Dengue, Machine Learning, Random Forest, Support Vector Machine, Vector Borne Diseases
1
INTRODUCTION
Vector-borne diseases are a major challenge worldwide. A number of people are suffering due to spread of these vector borne diseases. There are five common vector borne disease namely Malaria, Dengue fever, Chikungunya, Kala Azar and Zika which are found in India. Dengue and Malaria both are found in every changing season. Dengue is considered to be the most challenging vector borne disease due to climate change in India. Prevention and control of dengue is a big challenge in this large country due to diversity of climate, geographical and living standard of countrymen. In the rural area, this job is more complex due to lack of proper medical infrastructure in comparison to an urban area. There is a gap between rural and urban area in terms of medical facilities. This section provides a brief overview regarding dengue, dengue types, symptoms, clinical phases and statistics of dengue with help of the previous history.
1.1. Dengue
Dengue is a mosquito-borne viral infection, causing severe flu- like illness and sometimes causes a potentially lethal complication called severe dengue. The only cause of this fever is a bite of Ades Aegyptus and Aedes Albopictus mosquitos. The larvae of Ades Aegyptus are commonly found in waste containers like tires, buckets, flowerpots, wading pools and blocked gutters, tree holes, waste coconut shells. These species are commonly found in dark indoor sites like walls corners, beneath of beds and sofas. These species are day active, fly up to 3 feet and bite during day time and late afternoon.
These mosquitos are infected when they bite viraemic person. After 10-12 days period mosquito is also infected with the virus. When female mosquito bites for getting blood meal, virus is also transferred from mosquito to human body. On the other hand, Ades Albopictus mosquitoes are found inside garden grass, tree gaps and crops. These species are daytime feeder. A female aegypti bites human in the early morning and evening before sunset. They bite multiple persons to fulfil each blood feed meal. Four serotypes of this virus, there are DEN-1, DEN-2, DEN-3 and DEN4.
1.2. Symptoms of Dengue disease
Dengue is a simple flu-like illness that affects newborns, children and adults. There is no specific treatment for dengue fever. Further, Dengue is classified into DF (Dengue Fever), DHF (Dengue Hemorrhagic Fever) and DSS (Dengue Shock Syndrome). The common symptoms of DF include sudden onset of high fever, severe headache, pain behind the eyes, body aches, joint pains, nausea and/or vomiting etc. DHF commonly starts with sudden mild, moderate, or high fever and other symptoms like headaches, nausea, vomiting, pain in the muscles, bones, or joints and rashes on the skin. DSS is the next stage of DHF with additional symptoms like weak rapid pulse, narrow pulse pressure (less than 20 mm Hg), cold, clammy skin and restlessness.
1.3. Clinical phases and tests for dengue
Dengue is classified into two Asymptomatic and Symptomatic clinical phases. Asymptomatic dengue infection has no clinical signs or symptom of diseases. In November 2018, many cases of Asymptomatic dengue infection were found in the districts namely Amritsar, Kotkapura, Patiala and Ludhiana in the North Indian State of Punjab. People are infected with dengue infection but no clinical symptoms similar with WHO guidelines appeared during the trails. The only symptom found in clinical report showed the low level of platelets in the blood of patients. Further Symptomatic dengue infection has clinical signs or symptom of dengue diseases fever, vomiting, rashes, joint pain and pain behind eyes etc. Symptomatic dengue is further classified in to undifferentiated, dengue fever syndrome and dengue homeomorphic fever. The undifferentiated fever is the first clinical stage of Symptomatic dengue where the patient experiences fever with mild nonspecific symptoms, but these symptoms do not meet the ————————————————
• Rajeev Kapoor is currently pursuing Doctorate degree program in Computer Science and Engineering in Chitkara University, Punjab, India E-mail: [email protected]
• Variender Kadyan is currently Assistant Professor in Computer Science and Engineering, Chitkara University, India, E-mail: [email protected]
• Sachin Ahuja is currently Associate Professor in Computer Science and
Engineering, Chitkara University, India, Email:
3291 conditions of DF. The life of dengue infection is of 0-9-days.
In this period, this infection is passed in three clinical phases namely febrile, critical and recovery stage. The first stage is only febrile which becomes active and infection comes in 2 to 4-day period of fever. The next stage is a critical phase that comes in 3-6 day of infection. Last stage is the recovery stage of 7-10 days. The most common clinical tests Dengue Antigen-NS1, Dengue- IgM and Dengue – IgG are conducted for detection of dengue infection in the human body in India. NS1 test is recommended in the first 5 days of dengue infection. After 7-10 days of the fever, the recommended test is dengue fever antibodies IgG and IgM by Elisa. The NS1 test is positive in the 1-7 days of dengue. IgG & IgM is positive in the 4-9 days. When both IgG & IgM is positive and NS1 is negative, this shows recovery stage. IgG & IgM is positive. (Data Source: Tuli medico Lab, Amritsar, Punjab)
1.4.Statistics of dengue in India.
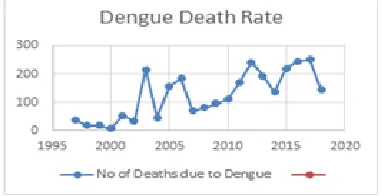
India has the largest share of the population in the world. It has a lot of difference due to geographical level, climate level, cultural level and living standard of people in the different – difference region in the country. Dengue is such vector borne disease which comes within country in two or three years. That country suffers extra economic burden. The number of people are losing living due to dengue. The statistics of dengue data is given in Table 1 and graphical representation is also given figure 1 & 2. In 1956, first confirms dengue outbreak is found in Vellore, Tamilnadu. The first large Outbreak is discovered in 1963 in Calcutta. Two hundred people have lost their lives. India has faced the two largest epidemics due to this disease in 1993 and 1996.
Fig. 1. Number of Dengue Cases Data source: NVBDC
Fig 2. Number of Deaths Cases (Data source: NVBDCP, Govt. of India
TABLE 1
STATISTICS OF DENGUE IN INDIA
Year No of Cases No of Deaths
1997 1177 36
1998 707 18
1999 994 17
2000 650 7
2001 3306 53
2002 1926 33
2003 12754 215
2004 11985 45
2005 11985 157
2006 12317 184
2007 5534 69
2008 12561 80
2009 15535 96
2010 28292 110
2011 18689 169
2012 50222 242
2013 75808 193
2014 40571 137
2015 99913 220
2016 129166 245
2017 157220 250
2018 89974 144
2.
RELATED
WORK
3292 IJSTR©2020
www.ijstr.org
melena 26.5 %, hematemesis 22.4% and ecchymosis 20% are common symptoms are found. Nerada [11], the author study 175 sample of patient’s sample of south India area. The study reveals fever, rash, thrombocytopenia, leucopenia, vomiting, headache, bleeding, myalgia, hypotension, Altered sensorium are common symptoms for detecting Dengue disease at an early stage. Chaudhary [12], the author study 245 patients with various categories of Dengue infection. The author study reveals a majority of patients 155/245 are infected with Dengue Fever Category (DF) and 27 % of patients with Dengue Shock Syndrome. The author finds fever, Headache, abdominal pain are common symptoms in his study which can be used to detect the dengue disease at an early stage. Guzman [13], author sturdy found main symptoms are found namely fever, vomiting, hepatomegaly, abdominal pain, shock, hemorrhagic, Manifestations, Hemorrhagic. Gambhir [14]., the author proposes PSO-ANN based on diagnosis model for early detection of dengue disease. The author takes fever, vomit, abdominal pain, chills, body ache, headache and weakness are main symptoms in his dataset to detect dengue at an early stage. Shuakat [15], the author’s objective is predicting the dengue using Weka data mining tool. For this purpose, the author takes four symptoms fever, Bleeding, myalgia, flu and fatigue are common symptoms to detect dengue disease at early stage. Neeraja [16], the author takes 713 suspected cases of Dengue are collated August and December 2007. The author found major symptoms namely fever, thrombocytopenia, elevated liver enzymes, vomiting and headache to detect dengue at early stages. Gupta [17], the author applied the WHO classification of Dengue to assesses its usability in Northern India. The author study includes 145 clinically suspected cases of dengue infection of all age. The author finds fever, vomiting, retro orbital pain, myalgia, rash, hepatomegaly and hepatosplenomegaly as major symptoms to detect dengue at early stages. Mukherjee [18], the author study shows that the maximum numbers of cases are found in September, October and November in North India. For this purpose, the author takes 82 sample of dengue infected patients to study common symptoms in distribution of DF, DHF and DSS. The author finds fever, chills, body ache, vomiting, nausea, joint pain and conjunctival congestion are common symptoms to detect the dengue at early stages. Kaur [19], the study coinfection of chikungunya and dengue viruses in north west region of Punjab. For this purpose, the author takes 3160 samples from suspected patients for dengue infection. The study shows that fever, arthralgia and thrombocytopenia as common symptoms to detect the dengue at early stages. Savargaonkar [20], tested 5536 dengue and chikungunya patients with NS1 and IgM clinical test during 2012-2015 and prepares demographic dataset which includes myalgia, headache, vomiting, itching, abdominal pain, rash and bleeding from gum & node as common symptoms.
3.
ANALYTICAL
STUDY
OF
FINDING
COMMON
PARAMETERS
STATISTICALLY
IN
INDIA.
The section focuses on finding the common parameter for detecting dengue early stage with an Indian perspective. The author studies twenty research papers of different researchers working on same domain. Due to different geographical and climate change in India, the author takes research studies from different regions to find the common symptoms to detect dengue disease in the early stages. For this purpose, an analytical study is performed to find common parameters thatare actually extracts of those repetitive symptoms from previous research of early detection this disease. The author prepares Table 2 which contain each symptom for finding in each research paper belong to Indian regions. Each symptom which is repeated in each research paper is recorded in this table. The frequency of each symptom is calculated. The weight of each symptom is given in percentile with ranking is described in Table 3.
TABLE 3
RANKINGOFSYMPTOMSWEIGHTWITHSTATISTICAL STUDY
Rank Symptoms
1 (70- 100 %) High Fever 75%, Rash 70%,
2( 50- 69 %) Middle Headache 60%, Vomiting 55%
3 (20-49 %) Low-Middle
Abdominal Pain 35%, Myalgia 35 %, Bleeding from Nose and Gum 35%, Nausea 35 % Ascites,25%, Fatigue 25%, Shock 20%, Arthralgia 20%, Body Pain 20 %, Pleural Effusion 20%,
3( 10-19 %) Low
Joint Pain 15%, Retro-orbital pain 15%,
Thrombocytopenia 15%, Chills 10%,
Hematemesis 10%, Hypotension 10%,
Hepatomegaly 10%, Conjunctival congestion 10%, Melena 10%, Renal Failure 10%, Splenomegaly 10%
5 (1-9 %) Rear
Diarrhea 1%,Cough 1%, Pruritus 1%, Purpura 1%, Aches and pains 15, Leukopenia 1%, Edema 1%,Joint Swelling 1%,Muscle pain 1%,
Iching,1%,Weakness 1%,Bodycardia 1%,
Retrobullor Pain 1%,Repitatory Complaints1%, Facial Puffiness 1%, Ascites 1%, Pleural effusion 1%, Petechial 1%, Respiratory distress 1%, Coma 1%, Dizziness 1%,Ache & pains
1%,Swelling 1%,Encephalopathy 1%,
Splenomegaly 1%,Flu 1%, Pleural effusion 1%,Skin Bleeding 1%, Mucosal bleed 1%,
Swelling 1%, Hematuria 1%, Convulsions
1%,Retroorbital puffiness 1%,
Lymphadenopathy Ecchymosis 1%.
4.
ANALYTICAL
STUDY
OF
DENGUE
SYMPTOMS
WITH
MACHINE
LEARNING
MODELS
The author studies 100 samples of dengue patients and applies different machine learning models to detect the highest weight parameters from 55 parameters which are found in patients in different regions in India. The author performs this analytical study with three Machine Learning models. The result of these models are given below:
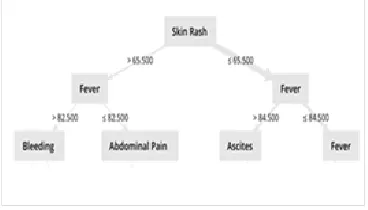
3293 Fig 3. Analytical study with Decision Tree)
The author performs a study with a decision tree. Figure 3 shows priority of symptom detects with Decision Tree technique of Machine Learning approach. The result shows skin rash, fever, bleeding, abdominal pain, and ascites are important symptoms which are used for early detection of dengue.
4.2 Result of analytical study with Random Forest
Fig 4. Analytical study with Random Forest.
The author performs the second study with Random Forest. Figure 4 shows priority of symptom detects with Random Forest technique of Machine Learning approach. The result shows fever, skin rash, Pleural effusion, Chills, Fatigue Ascites and Bleeding are important symptoms which are used for early detection of dengue.
4.3. Result of Analytical study using Support Vector Machine
The author performs third study with the Support Vector
Machine approach. The figure 5 shows priority of symptom detects with Random Forest technique of Machine Learning approach. The result shows fever, skin rash, Pleural effusion, Chills, Fatigue Ascites and Bleeding as important symptoms which are used for early detection of dengue.
TABLE 2
ANALYTICALSTUDYOFCLINICALSYMPTOM FREQUENCYOFDENGUEDISEASEININDIA
F e ve r R a sh H e a d a ch e V o m iti n g A b d o m in a l P ia n M ya lg ia B le e d in g f ro m No se a n d G u m N a u se a A sci te s A b d o m in a l p a in F a tig u e F a tig u e S h co k A rth ra lg ia B o d y P a in P le u ra l E ff u si o n Jo in t P a in R e tr o -o rb ita l p a in T h ro m b o cyt o p e n ia S o re T h ro a t C h ills H e p a to m e g a ly H e a m a te m e si s H yp o te n si o n H e p a to m e g a ly C o n ju n ct iv a l co n g e st io n M a le a n a R e n a l F a ilu re S p le n o m e g a ly M a le a n a It ch in g D ia rr h o e a C o u g h P ru itu s P u rp u ra A ch e s a n d p ia n s L e u ko p e n ia E d e m a Jo in t S w e llin g M u scl e p ia n Ic h in g W e a kn e ss B o d yca rd ia R e tr o b u llo r P a in
S.No Author
1 Sahana[1]. √ √ √ √ √ √ √ √
2 Srivastava [2]. √ √ √ √ √ √
3 Parsad[3]. √ √ √ √ √ √
4 Pal [4]. √ √ √ √ √ √ √
5 Mukherjee[5]. √ √ √ √ √ √ √ √
6 Kabilan[6]. √ √ √ √ √ √ √ √
7 Priyadarshini[7]. √ √ √ √ √ √ √ √ √ √ √
8 Jeelani[8]. √ √ √ √ √
9 Daniel[9]. √ √ √ √ √ √ √ √ √ √ √ √ √
10 Sharma[10]. √ √ √ √ √ √ √ √
11 Chadudary[11]. √ √ √ √ √ √ √ √
12 Guzman[12]. √ √ √ √ √ √ √ √ √ √
13 Gambhir S[13]. √ √ √ √ √ √ √
14 Sood S [14]. √ √ √ √ √ √ √ √ √ √ √ √
15 Shukat K[15]. √ √ √ √ √
16 Singh P [16]. √ √ √ √ √ √ √ √
17 Nareraja M [17]. √ √ √ √ √ √ √ √ √
18 Gupta P [18]. √ √ √ √ √ √
19 Mukerjee S[19]. √ √ √ √ √ √ √ √ √ √ √ √ √ √ √ √
20 Kaur M [20]. √ √ √ √ √
FREQUENCY 15 14 12 11 7 7 7 5 5 5 5 5 4 4 4 4 3 3 3 2 2 2 2 2 2 2 2 2 2 2 1 1 1 1 1 1 1 1 1 1 1 1 1 1
After experimentation, the results of three Machine Learning techniques shows that author finds commons symptoms to detect dengue at early stages. These symptoms are revealed in Table 4.
TABLE 4
RANKINGOFSYMPTOMSWITHMACHINE LEARNING
MODELS.
Rank Symptoms
1. Fever, Skin rash
2. Headache, Pleural Effusion, Shock
3. Bleeding, Chills, Fatigue, Ascites
,Abdominal Pain
Total number of Support Vectors: 101
Bias (offset): 31.807
w[Fever] = 209.564 w[Headache] = 84.145 w [Skin Rash] = 178.140 w[Abdominal Pain ] = 52.034 w[Myalgia ] = 36.211 w[Bleeding ] = 51.579 w[Ascites] = 39.856 w[Fatigue] = 51.849 w[Shock] = 70.544 w[Arthralgia ] = 68.905 w[Body Pain] = 54.364 w[Pleural Effusion] = 71.297 w[Joint Pain] = 25.433 w[Retro-orbital pain] = 27.370 w[Thrombocytopenia] = 14.776 w[Chills ] = 40.840
3294 IJSTR©2020
www.ijstr.org
In the final stage, the author finds the common parameters with the help of comparative analysis by using statistical technique and Machine Learning Technique. These symptoms are revealed in Table 5.
TABLE 5
IMPORTANTFACTORSFOREARLYDETECTIONOF DENGUE.
Statistical Technique Machine Learning
Fever, Rash, Headache, Vomiting
Abdominal Pain , Myalgia , Bleeding from Nose and Gum , Nausea ,Ascites, Fatigue, Shock
Fever, Skin rash
Headache, Pleural Effusion, Shock
Bleeding, Chills, Fatigue, Ascites
In the end, the author detects fever, skin rash, Headache, Abdominal Pain and Shock are four important factors for early detection of Dengue. These factors may be used for developing Weight Based Artificial Neural Network. These factors are used to develop a prediction model to detect Dengue at early stages. The propose W-ANN Network and Prediction Model are given in the next sections.
5.
DATASET
DESCRIPTIONS
This section describes details of dengue dataset which is helpful for early detection of dengue disease. The dataset holds three sections namely: demographics, sing & symptoms and Laboratory: The first demographics section holds variables of personal information of patient namely: Patient Id, Age, Sex and Height. The second sing & symptoms holds variable namely fever, skin rash, headache, Abdominal pain, vomiting, myalgia, bleeding, nausea, fatigue, ascites, shock, pleural effusion shock, joint pain and body pain. The third clinical test report section consists of clinical test information of patient namely NS1 Elisa, IgM, IgG, Platelet Count and Hemoglobin(HB). This dataset is revealed in Table 6.
TABLE 6
DENGUEDATASETFORW-ANNPREDICTIONMODEL
Demographic
Patient Id Numeric
Age Numeric
Gender Male/ Female/Third gender
Height Numeric
Signs and Symptoms
Fever Numeric
Headache High, Medium, Low , NIL
Skin Rash High, Medium, Low, NIL
Abdominal Pain Yes/No
Myalgia Yes/No
Bleeding Yes/No
Ascites Yes/No
Fatigue Yes/No
Shock Yes/No
Arthralgia Yes/No
Body Pain Yes/No
Joint Pain Yes/No
Pleural Effusion Yes/No
Chills High, Medium, Low, NIL
Retro-Orbital Pain Yes/No
Clinical Test Reports
NS1 Negative (<0.9), Equivocal (0.9- 1.1), Positive (>1.1)
IgM
Negative (<0.9), Equivocal (0.9- 1.1), Positive (>1.1)
IgG
Negative (<1.8), Equivocal (1.8- 2.2), Positive (>2.2)
Platelet Counts 170-450
Hemoglobin 11.5-15.5
The author prepares this dataset based on the analytical study is done in the previous section. The author effort to include those important factors are helpful to detect the dengue at early stage. These important factors are based to build a weight based artificial neural network to develop an intelligent predictive model to detect the dengue disease at an early stage.
6.
WEIGHT
BASED
ARTIFICIAL
NEURAL
NETWORK
(W-ANN)
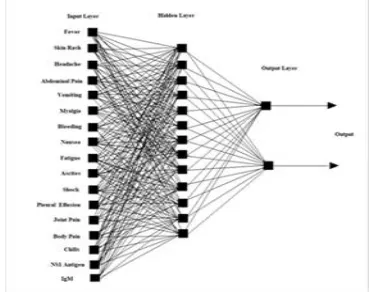
This section describes Weight based Artificial Network Neural Network for detecting Dengue disease at early stages. ANN is a collection of multiple nodes. ANN is a collection of multiple nodes. Nodes are connected by links and interact with each other. W-ANN acts as a rational agent for the prediction model for Dengue detection. In figure 6, the mechanism of the ANN is like human brain, which precepts
3295 the information from the environment through sensors and
processes internally in neural in the like human mind and acts action through body actions and reactions. The propose W- ANN precepts the symptoms and sings through the sensors, mobile applications and web applications from the Input Layer. This propose model is revealed in figure 6. The hidden layer represents the attributes which are not linearly separated from each other. The hidden layer attributes are dependent variables. Therefore, a summation of them is necessary for process function. The process is defined as Eq. (1)
∑ (1)
Where Pj is the summation of inputs and . the activation function. When activation function is called, then it processes inputs and its result defines a problem statement. Next step is of searching solution in the knowledge bank in Hidden Layer. In the final stage, the action function is for calculating the results. The output of W-ANN passes through the output layer and is sent to the environment through effectors like SMS, Email and other print mediums.
7.
PROPOSE
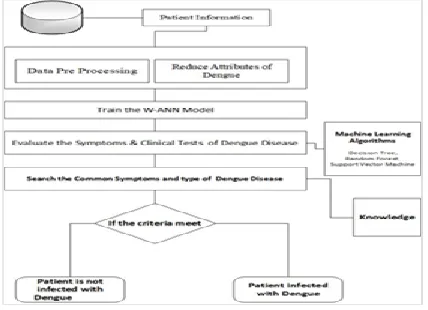
MODEL
This section introduces propose W-ANN based a prediction model to detect dengue at an early stage. The propose model has five phases namely Data Preprocessing, Train Weight based Artificial Neural Network, Evaluation of Symptom & Clinical Tests, searching solution for Problem and Decision
Fig 5. W-ANN prediction model to detect dengue at early stage.
Making. Figure 4: describes W-ANN prediction model to detect dengue at an early stage. The first phase is responsible for producing the quality of the result. For this purpose, this phase gets raw data from a database or other mediums and does the process of cleaning of noisy, useless, inconsistent and missing data from received data. The author proposes for preprocessing of patient information. Prepossessing algorithm is revealed in figure 7.
PRE-PIINFO
Prepossessing of Patient Information
Input: Current Symptoms of Patient information Output: Record of dataset Dengue Patient
Step
1. Calculate the weight of the symptoms and clinical test attributes. Step
2. Find the missing value and Replace with average value and reduce attributes. Step
3. Convert all the value of attributes in Numerical values. Step
4: Calculate predictor attribute for machine Learning Models Step
5:
Grouping attributes with feature selection with Minimum distance using K-mean clustering.
Step
6: Prepares patient record for dataset. Step
7: Exit.
Fig. 7. PRE-PIINFO Algorithm
The next phase creates an artificial neural network which is trained by weight of symptoms and Signs which are described in figure 8.
TRAIN-WANN
Train W-ANN Network and find common attributes with Machine Learning Model
Input: Current Symptoms of Patient information and predictor attribute
Output: Record of dataset Dengue Patient
Step 1: Create symptom and sings based an artificial neural network.
Step 2: Train ANN with weights of symptoms and clinical test of dengue infected patient Step 3: Select predictor variable for Decision Tree Step 4: Apply Decision tree, Random forest , Support
vector machine
Step 5: Store the results of Machine learning models
Fig 8. TRAIN-WANN Algorithm
Third phase is of the valuation phase where evaluation function search accurate results are from knowledge bank and is described in figure 9.
CFACTOR-LOCATOR
Evaluate function for finding common factors Input: Current Symptoms of Patient information and predictor attribute
Output: Decision statement of Dengue.
Step 1: Read the results of Machine Learning Models
Step 2: Read the symptom of WHO guideline and previous study results from Knowledge Bank
3296 IJSTR©2020
www.ijstr.org
Step 4: If symptom & clinical result meets the criteria:
Output: Patient is infected with dengue and show stage of Dengue
Else
Output: Patient is not infected with Dengue
End if Step 5: Exit
Fig 9. CFACTOR-LOCATOR Algorithm
The propose model describe in figure10.
W-ANN
Input: Record of dataset Dengue patient Output: Decision statement of Dengue
Step 1: P= Get data (Patient information) Step 2: R= PRE-PIINFO(P)
Step 3: TRAIN-WANN ( R)
Step 4: CV= CFACTOR-LOCATOR (R) Step6: Output
Step 8: Exit
Fig 10. W-ANN-PREDITION MODEL
8.
EXPERIMENTAL
SETUP
In the experiment section, the author conducts experiments Namely Experiment I, II, and III. The VISUALIZATION OF ALL SYMPTOMS IS VISUALIZED IN FIGURE 11.
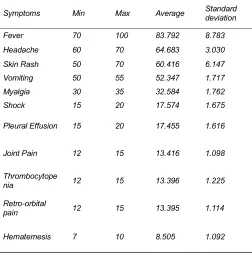
TABLE 7
VARIABLEDISTRIBUTIONOFDENGUEDATASET
Symptoms Min Max Average Standard deviation
Fever 70 100 83.792 8.783
Headache 60 70 64.683 3.030
Skin Rash 50 70 60.416 6.147
Vomiting 50 55 52.347 1.717
Myalgia 30 35 32.584 1.762
Shock 15 20 17.574 1.675
Pleural Effusion 15 20 17.455 1.616
Joint Pain 12 15 13.416 1.098
Thrombocytope
nia 12 15 13.396 1.225
Retro-orbital
pain 12 15 13.395 1.114
Hematemesis 7 10 8.505 1.092
The visualization results show that each variable’s minimum value, maximum value and mean value is according to the dataset provided. Each symptom variable has minimum and maximum frequency, where each variable value is used to design propose algorithms. In experiment I, a standard classification procedure is followed by creating a decision tree with Rapid Miners tool. The result of the decision tree is shown in figure 1. The evaluation process of Decision Tree is conducted with Weka 3.9 tool. Result of this process is given in figure 12.
8.1. Results
Fig 11: Visualization of symptoms of dengue data set
Test mode: evaluate on training data === Classifier model (full training set) ===
Decision Table:
Number of training instances: 101 Number of Rules: 31
Non matches covered by Majority class. Best first.
Start set: no attributes Search direction: forward
Stale search after 5 node expansions Total number of subsets evaluated: 108 Merit of best subset found: 1.01
Evaluation (for feature selection): CV (leave one out) Feature set: 11,12,19
Time taken to build model: 0.08 seconds
=== Evaluation on training set ===
Time taken to test model on training data: 0.02 seconds
=== Summary ===
3297 Fig 12. Results of decision tree on training data
The second experiment is conducted with the help of Random forest classification rule with Rapid Miner Tool. The result of the Radom Forest Classification rule is shown in figure 2. The evaluation process of Support Vector conducted with Weka 3.9 tool. The result of this process is given in figure 13.
Test mode: evaluate on training data
=== Classifier model (full training set) ===
Random Forest
Bagging with 100 iterations and base learner
weka. classifiers. trees. Random Tree -K 0 -M 1.0 -V 0.001 -S 1 -do-not-check-capabilities
Time taken to build model: 0.06 seconds
=== Evaluation on training set ===
Time taken to test model on training data: 0.03 seconds
=== Summary ===
Correlation coefficient 0.981 Mean absolute error 0.3434 Root mean squared error 0.3984 Relative absolute error 35.5819 % Root relative squared error 36.6672 % Total Number of Instances 101
Fig 13. Results of random forest on training data
The third experiment is conducted with the help of Support Vector Machine is shown in figure 13. Based on the results of three experiments, the next section measures the performance of the three machine learning model.
8.2. Performances
Performance of the proposed model is evaluated with the help of dengue infected patient’s dataset in terms of accuracy, error rate and overall performance. For performance evaluation, the proposed model with the clinical dataset is examined with three machine learning models namely Decision tree, Random Forest and Support Vector machines. The results of accuracy, Error rate and overall performance implementation of the proposed model is described in Table 9.
TABLE 9
PERFORMANCERESULTSOFEXPERIMENTS
Machine Learning
Methods Accuracy Error Rate Performance
Decision Tree 99% 1% 65.7%
Random Forest 98 % 2% 76.7%
Support Vector
Machine 100% 0% 100%
Further, the results of the execution performance of the proposed model are shown through decision tree, Random
forest and support vector machine are given in Table 10 in terms of training time, scoring time and total time.
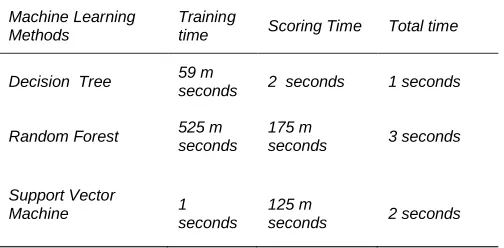
TABLE 10
EXECUTIONPERFORMANCERESULTSOFEXPERIMENTS
Machine Learning Methods
Training
time Scoring Time Total time
Decision Tree 59 m
seconds 2 seconds 1 seconds
Random Forest 525 m
seconds 175 m
seconds 3 seconds
Support Vector
Machine 1
seconds
125 m
seconds 2 seconds
In the end, implementation of the proposed model with SVM archives 100 per cent performance, but the decision tree has taken less time than SVM. The author suggests use to the decision tree with the nonlinear dataset and SVM with a linear dataset.
9.
DISCUSSION
Dengue is a major vector-borne disease in different locations in India. Every year several people are suffering from this disease. Due to diversity in geographical areas, climate and living style, timely detection and control of Dengue disease is still a challenging job. Many steps are taken by the Government of India regarding detection, prevention and control this disease. There is a huge difference in living medical facilities between urban and rural areas. In the rural area, there are not sufficient medical facilities available. Information technology may fill the gap using machine learning-based devices for early detection of Dengue disease. There is no specific medical treatment or medicine /vaccine available. It is become necessary to detect Dengue at early stages. The author effort is to develop WANN prediction model to detect Dengue disease at an early stage. The author has tested the propose model with data mining tools namely Weka and Rapid Miner. This research can also be applied on other vector borne diseases.
10.
CONCLUSION
3298 IJSTR©2020
www.ijstr.org
research is that it can be used for further detecting other vector-borne diseases like Malaria, Chikungunya, Zika and Kala Azar etc.
REFERENCES
[1] Sahana , K. & Sujatha, R., “Clinical Profile of dengue among children according to revised WHO Classification: Analysis of a 2012 Outbreak from Southern India", Indian J Pediatr, 2015 82(2) 109-113.
[2] Srivastava, V., Suri , S, Bhasin , A. , Srivastava, L. & Bhardwaj, M., “An epidemic of dengue hemorrhagic fever and dengue syndrome in Delhi: a clinical study”, Annals of Tropical Pediatrics,1990,10,329-334. [3] Parsad, D., Kumar, C. , Jain, A. & Kumar, R., “
Accuracy and applicability of the revised WHO classification (2009) of dengue in children seen at tertiary healthcare facility in northern India.”, Infection , 2013 (41), 775-782.
[4] Pal T, Dutta , S., Mandal, S., Saha, B. & Tripathi, “Differential clinical symptoms among phase Indian patients revealed significant association with dengue viral load and serum IFN-gamma level”, Journal of Clinical Virology, 2014(61), 365-370,.
[5] Mukherjee, S. , Dutta, S., Senupta, S., & Tripathi, A., “Evidence of dengue and chikungunya serotypes in a recent Indian Outbreak”, European Journal of Clinical microbiology & Infectious diseases, 2017(36)(11),2273-2279.
[6] Kabilan , L., Balasubramanian, S., Keshava , S., Thenmozhi, V.,Sekar, G.,Tewari, S., Arunnachalam, N., Rajaendran , R. , & Stayanarayana , K., “Dengue Disease Spectrum among Infants in 2001 Dengue Epidemic in Chennai, Tamil Nadu, India”, Journal of Clinical Microbiology, 2003 (8), 3919-3921.
[7] Priyadarshini, D. , Gadia, R., Tripathy, Gurukumar, K., Bhagat, A., Patwardhan, S., Mokashi, N., Vaidya D., Shah, P & Cecilla, “ Clinical finding and Pro-Inflammatory Cytokines in Dengue patients in Western India: A Facility-Based Study”, Plos One, 2010 (5)(1), e8709.
[8] Jeelani, S.,Sabesan, S. & Subramanian, “Community Knowledge regarding, awareness and preventive practices regarding dengue fever in Puducherry-South India.”, Public Health, 2015, 229 (6), 790-796. [9] Daniel, R, Raja Mohan. , & Philp, A. “A study of
Clinical Profile of Dengue Fever in Kollan, Kerala, India”, Dengue Bulletian,2005, (29).
[10]Sharma, S., Sharma, K., Wadhwa , J., Dar, L., Thulkar, S. and Pande, J., “Clinical Profile of Dengue Hemorrhagic Fever in Adults 1996-Outbreak in Delhi, India”, Dengue Bulletin,1998, (22), 20-30.
[11]Neeraja, M., Lakshmi, V., Teja, V., Lavanya, Priyanka, E., Subhada, K., Prarida, M., Dash, P., Sharma, S., Rao, P. & Reddy, G., “Unusual and rare manifestations of dengue during a dengue outbreak in tertiary care hospital in South India”, Archives of Virology 2014, (159)(7) 1567-1573.
[12]Chaudhary, R., Khetan, D., Sinha, S., Sinha, P., Sonkar, A., Pandey, P., Das, S., Agarwal, P. & Rai, V., “Transfusion Support to dengue patients in hospital based blood transfusion service in North India”, Transfusion and Apheresis Science, 2006, (35), 239-244.
[13]Guzman, M., & Kaouri, “Dengue : Update”, The Lancet infectious Diseases, 2002, (2), 33-41.
[14]Gambhir, S., Malik, S. & Kumar, Y., “PSO-ANN based diagnostic model for the early detection of dengue disease”, New Horizons in Translation Medicine”, 2017 (4), 1-8.
[15]Sood, S., & Mahajan , I. , “Wearable IoT based healthcare system for identifying and controlling Chikungunya”, Computer in Industry, 2017 (91),33-44.
[16]Shaukat, K., Masood, N., Mehreen, S. & Azmeen, U., “Dengue Fever Prediction: A Data Mining Problem”, J Data Mining Genomics Protemics, 2015, (6),1-5. [17]Neeraja, M., Laskhmi, V., Dash, P., Prida, M., & Rao,
P., “The Clinical, Serological and Molecular Diagnosis of Emerging Dengue infection at a Tertiary Care Institute in Southern, India”, Journal of Clinical and Diagnostic Research, 2013, (7),451-461.
[18]Singh, P., Mittal, V., Rizvi, M., Chhabra, M. , Sharma, P. , Rawat, D., Bhattacharya, D., Chuhan, L., & Rai, A., “The first dominant co-circulation of both dengue and chikungunya viruses during the post –monsoon period of 2010 in Delhi”, Epidemiol Infect. (2012),140, 1337-1342.
[19]Gupta, P., Khare, V. , Tripathi, S., Nag, V., Kumar, R., Khan, M. , & Dhole, T., “ Assessment of World Health Organization of definition of dengue hemorrhagic fever in North India”, The Journal of Infection in Developing Countries, 2016 (4), 1-6. [20]Mukherjee, S., Manna, K., Chatterjee, P.,
Pramathanath, D., & Datta, S., “Dengue fever and its epidemiological characteristics: a study from Eastern India.”, International Journal of Community Medicine and Public Health, 2016, 3(12), 3588-3594.