149 | P a g e
COMPUTER-AIDED DETECTION AND
CLASSIFICATION OF CAVITARY
TUBERCULOSIS FROM CT SCANS
1
Anbarasu.A ,
2R.Poovendran
1
PG scholar, Communication Systems, Adhiyamaan College of Engineeing,Hosur,(India)
2
Asst. Prof., Electronics and Communication Engg., Adhiyamaan College of Engg., Hosur,(India)
ABSTRACT
With a fast development of computed tomography technology, CT scan images has become one among the most
economical examination technique to notice respiratory organ diseases in clinical. By using lung CT image,
automatic segmentation is finished so as to help the surgeons to get rid of the portion of respiratory organ for
the treatment of health problem malady such as lung cancer, and infectious disease. The target of this paper is
characteristic all nodules from the chest CT respiratory organ pictures and classifying these nodules into
cancerous (Malignant) and non-cancerous (Benign) nodules, to cut back the false positive rate using Image
process techniques and Neural Network techniques. First, noise is off from the image and so regenerate image
to binary format. Then morphological operations are performed to extract there spiratory organ field. Features
are extracted and these are fed to the neuro-fuzzy system for identifying true nodules.
Keywords-
Computed Tomography (CT), Lobe segmentation, Adaptive threshold, Neural network,Classification
I.
INTRODUCTION
The lung cancer is that the second most typically diagnosed cancer and also the respiratory organ could be a
most frequent site of metastasis from different cancers that manifest as pneumonic nodules. The Chest CT (CT)
is that the most sensitive diagnostic imaging modality for the detection of lung cancer and therefore the
resolution of any equivocal abnormalities detected on chest radiographs. Recently, CT techniques are applied to
screening for the detection of the lung cancer in insecure populations and are shown to be promising for
detection of early lung cancers. Thin-section three-dimensional CT of the thorax might enable us to judge little
lung nodules automatically at early stages. With sequential follow-up CT scans, early changes in nodule size
150 | P a g e
lung cancer carcinoma, T.B., pneumonia, and respiratory disorder. A survey result reveal the truth that over nine
million individuals worldwide die annually from chest diseases [1]. Apparently CT scans are used for detection
of lung cancer [2] as a result of there's some proof suggesting that early recognition of lung cancer could permit
a good diagnosing [3].
Fig.1 Lung Lobes
The human lungs are divided into 5 lobes that are separated by pleura known as pneumonic fissure. There are 3
lobes within the right respiratory organ, specifically higher, middle, and lower lobe. The proper higher and right
middle lobe are divided by the proper minor fissure whereas the proper major fissure delimits the lower lobe
from the remainder of the lung. within the left lung there are only 2 lobes, the higher and therefore the lower
lobe, that are divided by the left major fissure [see Fig. 1].
II.
LUNG DISEASES
Lung diseases [4] are a number of the foremost common medical conditions worldwide. Tens of several people
suffer from lung disease worldwide. Smoking, infections, and genetic science are chargeable for most lung
diseases [5]. A number of the common lung disease may be divided in these groups:
Lung Diseases Affecting the Airways;
Lung Diseases Affecting the Air Sacs (Alveoli); Lung Diseases Affecting the Interstitium; Lung Diseases Affecting Blood Vessels; Lung Diseases Affecting the Pleura; Lung Diseases Affecting the Chest Wall.
Most occurred ones are: bronchial asthma, acute bronchitis, cystic fibrosis, emphysema, pneumonia, T.B.,
151 | P a g e 2.1 Computed Tomography (CT)
Computer tomography (CT), generally referred to as a CAT scan, uses special X-ray instrumentation to get
image information from completely different angles around the body, and so uses computer process of the data
to indicate a cross section of body tissues and organs. CT imaging will show many types of tissue—lung, bone,
soft tissue, and blood vessels—with nice clarity using specialised instrumentation and expertise to create and
interpret CT scans of the body, radiologists will additional simply diagnose cancer issues. The image permits a
physician to verify the presence of a T.B. and to measure its size, precise location, and therefore the extent of
the tumor's involvement with different close to by tissue. The CT scan will reveal some soft-tissue and different
structures that can't even be seen in standard X rays. Using a similar indefinite quantity of radiation as that of a
normal X-ray machine, a CT scan will increase the clarity by concerning a hundred times for an entire slice of
the body. The CT scan is usually performed once a chest X-ray.
2.2 Computer Aided Diagnostic (CAD)
Early detection of lung cancer is vital for rising survival of this disease as a result of only 15% of lung cancers
are found once they are localized. Since there are few or no symptoms within the early stages of the disease, the
bulk of lung cancers are diagnosed within the late stages of the disease. Symptoms of later-stage disease might
embrace a persistent cough, humour streaky with blood, chest pain, voice modification, and repeated respiratory
disease or respiratory disorder. The goal of a screening program is to search out cancer at an early stage once
there are fewer symptoms. Treatment at early stages of cancer can cause additional treatment choices, less
invasive surgery, and a better survival rate.
Improving the power to identify early-stage tumors is a very important goal for physicians, because early
detection of lung cancer could be a key consider manufacturing successful treatments. Computer-aided
diagnosis (CAD) involves the employment of computers to bring suspicious areas on a medical image to a radiologist’s attention. CAD for cancer detection in medical pictures starts with a digital image. Here CT lung
image is employed to notice the lung cancer nodules. CAD System consists of the following stages:
i. Image Pre-processing – It not only removes the unwanted noise and background information but also
enhances the image quality.
ii. Image Segmentation – Segmentation is the process of separating the lung lobes from CT image and it
classifies the suspicious regions.
iii. Feature Extraction – After segregating lung lobes from lung CT image, based on the features such as
area, perimeter, shape, size, color, etc. positive region will be extracted.
152 | P a g e
III.
EXISTING SYSTEMS
Many authors explored the segmentation techniques in medical imaging depending on the region of interest till
now [6]. Some of them use a semi-automatic algorithm and still need some user interaction, while others are
fully automatic and the user has only a verification role. Various algorithms from different authors can be found
for medical image segmentation such as region growing [7], thresholding [8]. A. Hoffman [9] have developed
an automatic method for identifying lungs in 3D X-ray CT images. Zhang and Valentino [10] have suggested
using artificial neural networks to classify each pixel in the CT slice into different anatomical structure. Some
authors have proposed systems for nodule detection and classification using FIS, Neural network, Bayesian
classifier.
IV.
PROPOSED SYSTEM
4.1 Introduction
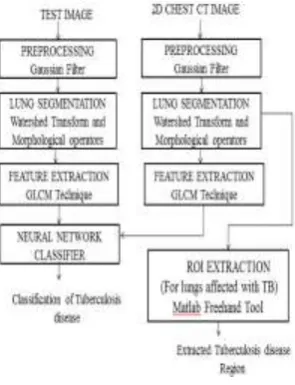
Here new system is proposed for lung segmentation and tuberculosis disease from chest CT scan images. Below
figure shows the block diagram of the proposed system. It consists of following steps:
4.1.1 Input image
Here, the input images are chest CT scan images in JPEG format that contain tumors. First image selected from
the file specified by the string filename. The user has to select the required lung CT scan image for further
processing. Then each image is resized to 256*256.
4.1.2 Gaussian filtering
The input image is in RGB format. So it is first converted into gray scale image for further processing. Then
Gaussian filter of mask size 3*3 is used to remove noise because it is one of the best methods to remove the
noise from the CT images; since these images usually contain artifacts or noise due to patient movements.
153 | P a g e 4.2 Post Processing
Post-processing includes following steps:
4.2.1 Lung Segmentation
In this module we have a tendency to segment left and right lung from the CT image. First we've got chosen the
seed point within the CT image. From the purpose we have a tendency to found intensity value of the image. We
have a tendency to compare the intensity value between the neighboring pixels and current pixel. If the neighbor
pixels values are associated with the seed value, it'll segment lungs from the original image. These similarity
pixels are going to be segmented from the CT image [14]. This process is sustained till reach the last pixel.
Finally the lungs are going to be segmented. Threshold value between zero and 180 is selected.
4.2.2 Lobe Segmentation
Watershed transformation is a common technique for image segmentation. However, its use for automatic
medical image segmentation has been limited significantly because of over segmentation and sensitivity to noise
[15]. Prior previous shape information has demonstrated strong enhancements to medical image segmentation
algorithms. we have a tendency to propose a completely unique methodology for enhancing watershed
segmentation by utilizing previous shape and appearance information. In watershed, internal markers to get
watershed lines of the gradient of the image to be segmented. Use the obtained watershed lines as external
markers. Each region defined by the external markers contains one internal marker and a part of the background.
In watershed, regions without markers are allowed to be merged.
154 | P a g e 4.2.3 Feature Extraction
In this process, total 12 textural features of all images in the database are extracted using GLCM (Gray level
co-occurrence matrix).GLCM are partition image into NxN blocks of pixels. For each block, compute a feature
vector to represent all pixels contained within that block.The features extracted for the segmented normal image
and the abnormal image are given below.
For normal image,
Difference Entropy = 4.947241e-01
Information Measure of Correlation 1= -3.977496e+00
Information measure of correlation 2 = 9.910078e-01
Difference Variance = 4.947241e-01
Sum Entropy = 5.216228e-01
Entropy = -1.000000e+000
For abnormal image,
Difference Entropy = 2.300659e-02
Information Measure of Correlation 1= -4.503941e+00
Information measure of correlation 2= 9.862086e-01
Difference Variance = 4.964593e-01
Sum Entropy = 4.104816e-01
Entropy = -1
V.
CLASSIFICATION RESULTS AND ANALYSIS
After extracting GLCM features of pictures, tuberculosis classification is disbursed. For this, we've used neural
network classifier. a complete input data set consisting of thirty pictures is employed. This information set
includes of both normal and abnormal chest CT pictures. The dataset consists of twelve abnormal pictures and
eighteen normal pictures. Initialize the bias and group value supported the types of classification. These are
classify the disease by comparison neural network with sample pictures. The Parameters derived to check the
classifier performance is shown within the TABLE 1.The output value of the neural network confusion matrix
155 | P a g e
Table.1 Neural network classifier performance
Matlab freehanded tool is to form a draggable to create region, h = imfreehand creates a freehanded ROI,
specifying parameters and corresponding values that control the behaviour of the tool. The input image are
produce a binary image(mask) from the ROI object using imfreehand function. this can be burn mask image into
the input image using between boundaries function. Therefore to get the masked outside region and therefore the
masked within region using NOT operation. The results of an image is only crop the TB disease region. The
Figure shows the (T.B.) infectious disease} disease region marked with matlab free hand tool.
Fig.4 Disease region marked with matlab freehand tool
VI.
CONCLUSIONS
This paper presents and discusses the results of the method applied to computed-tomography (CT) examinations
performed in a screening program for early detection of lung cancer. To determine whether the patients are
affected by cavitary TB, the lung region is segmented from the chest CT images. The segmentation is performed
using Watershed Transform. Morphological operations such as dilation and erosion have been used. With the
help of neural network classifier the lungs affected with TB disease has been detected. The results achieved by
applying the system to a database, which is the information collected from a real time environment of hospital,
of CT scans for digital images have been judged definitely well by experienced chest radiologists. Finally, the
TB disease affected region is extracted from the lung separately using matlab freehand sketch tool and the
disease spread area has been determined.
REFERENCES
156 | P a g e
[2] C. I. Henschke, O. S. Miettinen, D. F. Yankelevitz, D. M. Libby, and J. P. Smith, ―Radiographic
screening for cancer. Proposed paradigm for requisite research,‖ Clinical Imaging vol. 18, no. 1, pp. 16–
20, 1994.
[3] B. J. Flehinger, M. Kimmel, and M. R. Melamed, ―The effect of surgical treatment on survival from early
lung cancer. Implications for screening,‖ Chest, vol. 101, no. 4, pp. 1013–1018, 1992.
[4] R. Mason, F. Murray, J. Nadel, ―Mason, R. Murray & Nadel's Textbook of Respiratory Medicine 4th
Edition‖, Elsevier, 2005.
[5] Nihad Mesanovic , Mislav Grgic , Haris Huseinagic , Matija Males , Emir Skejic , Muamer Smajlovic,
―Automatic CT Image Segmentation of the Lungs with Region Growing Algorithm‖IEEE Transactions on medical imaging,‖ vol. 25, no. 4, pp. 406-416, 2006.
[6] P. Croisille, M. Souto, M. Cova, S. Wood, Y. Afework, J. E. Kuhlman, E. A. Zerhouni, "Pulmonary
nodules: improved detection with vascular segmentation and extraction with spiral CT", Radiology, Vol.
197, pp. 397-401, 1995.
[7] D. L. Phan, C. Xu, J. Price, "A survey of current methods in medical image segmentation", Annual
Review of Biomedical Engineering, 1998.
[8] M. S. Brown, M. F. McNitt-Gray, J. G. Goldin, R. D. Suh, J. W. Sayre, D. R. Aberle, "Patient-specific
models for lung nodule detection and surveillance in CT images", IEEE Transactions on Medical
Imaging, Vol. 20, pp. 1242-1250, 2001.
[9] E. A. Hoffmann, J. M. Reinhardt, "Automatic Lung Segmentation for Accurate Quantitation of
Volumetric X-Ray CT Images", IEEE Transactions on Medical Imaging, Vol. 20, pp. 490-498, 2001.
[10] D. Zhang, D. J. Valentino, ―Segmentation of anatomical structure in X-Ray computed tomography
images using artificial neural network‖, Proc. of SPIE, vol. 4684, pp. 1640-1652, 2005.
[11] Atiyeh Hashemi, Abdol Hamid Pilevar, Reza Rafeh, ―Mass Detection in Lung CT Images Using Region
Growing Segmentation and Decision Making Based on Fuzzy Inference System and Artificial Neural Network‖, International journal on Image, Graphics and Signal Processing, vol. 6, pp. 16-24, May 2013.
[12] Ada, Rajneet Kaur, ―Early Detection and Prediction of Lung Cancer Survival using Neural Network
Classifier‖, International journal of application or innovation in engineering and management, vol. 2,
Issue 6, pp. 375-383, June 2013.
[13] Anil M. Yametkar, R. D. Patane, ―Lung Cancer Detection And Classification By Using Bayesian
Classifier‖, Proceedings of IRF International Conference, Feb. 2014.
[14] T. Manikandan, D.Kesavaraja, ―A study of different chest ct scan image segmentation for pulmonary lobes‖, International Journal of Research in Engineering & Advanced Technology, Vol. 1, Issue 5, pp.
157 | P a g e
[15] Bianca Lassen, Eva M. van Rikxoort, Michael Schmidt, Sjoerd Kerkstra, Bram van Ginneken, and