Experimental Investigation of the Compressor Cascade under an Active
Flow Control
Z. Trávníček1, V. Cyrus2, D. Šimurda1, M. Luxa1, J. Lukáč1, J. Kordík1 1Institute of Thermomechanics, AS, CR, v.v.i., Dolejskova 5, Prague 8 2AHT - Energetika, s.r.o., Podnikatelska 550, Prague-Bechovice
Abstract The paper is concerned with flow past compressor blade cascade (NACA 65 with thickened trailing edge) at off-design regimes, which are characteristic by partial or complete flow separation on the suction surface of the blades. An attempt has been made to moderate the flow separation using continuous or periodic blowing from the sidewalls. The flow field was visualized using schlieren technique and surface paint visualization. The visualizations were complemented by measurement of the static pressure distribution on the suction surface of the blades. In agreement with the literature, the visualizations confirmed a complexity of the 3-dimensional flow separation, which was intensified by influence of the sidewall boundary layers developing from upstream parts of the test section. Furthermore, it was found out that the effect of both continuous and periodic blowing was rather minor. Finally, the results agree with the available literature showing that it is highly difficult to considerably control the complex 3-dimensional flow separation in the compressor cascade by control jets issuing (only) from the sidewalls.
1. Introduction
Flow through compressor blade cascades, under higher loading at higher angle of attack, tends to separate. There are many methods of an active flow control, aiming to the prevention of flow separation. A very promising strategy consists in an implementation of flow oscillation. Various locations of the actuation were suggested by Culley et al. [1]. Well feasible design uses an actuation from channel sidewalls, as was investigated with the two-dimensional blade cascades, e.g. by Matějka et al. [2] and, more recently, by Zander et al. [3]. A very efficient location was found at the suction side of the blade, at a vicinity of the flow separation, namely at 14.5% of the suction side length from the leading edge – Zander et al. [3]. The present investigation uses approximately the same location, as is describe below.
Despite highly three-dimensional designs of the late turbomachinery blading, aerodynamic tests of profile blade cascades are still widely used not only to verify complete profile designs but also to gather information during the design process, e.g. [4] [5]. Ideally, flow past the profile cascade is two-dimensional. In reality, however, this is true to some extent only since the flow may be influenced by a boundary layer developing on the sidewalls. This problem is crucial namely in the case of compressor blade cascades where the sidewall boundary layer development may promote flow separation in the
interblade channel. Yet in the case of root profiles, this ailment of the profile cascade testing poses certain advantage as the limiting sidewall boundary layer may have similar effect on the flow as the boundary layer developing on the hub of a real machine. Thus flow past profile compressor blade cascades poses a perfect example of possible application of flow control both active and passive.
2. Experimental setup
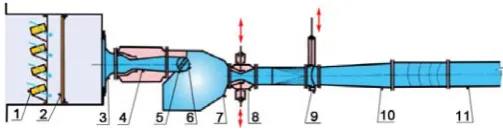
Fig. 1: Scheme of the suction type high-speed wind tunnel. 1silicagel dryer, 2filters, 3entrance nozzle, 4inlet nozzle, 5transient insert, 6rotable test section, 7settling chamber, 8control nozzle, 9quick-acting valve, 10diffuser, 11main duct
Table 1: Investigated regimes
i [°] cu = U/U1 f [Hz] Method
0, 1.37, 1.52, 1.66 0 Sc, Pr
0.76, 1.01, 1.59 20 Pr
0, 2.00 0 Vi
0.76, 0.98, 1.24, 1.53,
1.79, 2.03 20 Sc, Pr
9.8
0, 1.01, 1.59 20 Vi
0, 1.39 0 Vi
8.3 0.93, 1.30 20 Vi
0 0 Sc, Pr, Vi
6.8 1.30 0 Vi
3.8 0 0 Vi
0 0 0 Vi
2.1 Two-dimensional compressor blade cascade
The two-dimensional blade cascade was design by Cyrus [6]. The geometry follows a typical geometry of stator cascades in highly loaded axial compressors, the profile is NACA 65 with thickened trailing edge. The parameters of the blade cascade are summarized in Table 2. Model of the blade cascade consisted of eight profiles. Figure 2 shows the geometry of the investigated blade cascade, i.e. the first four profiles, their arrangement and a location of the actuation orifices from sidewalls.
Fig. 2. Geometry of the investigated blade cascade - lower profiles.
Table 2: Characteristic dimensions of the two-dimensional compressor blade cascade
Chord c 100 mm
Pitch/Chord s/c 0.50
Max. Thickness/Chord t/c 0.08
Aspect Ratio AR 1.6
Stagger Angle γ 17.0°
Trailing Edge Radius/Chord rTE/c 0.008
Leading Edge Radius/Chord rLE/c 0.0044
Inlet Metal Angle βL1 42.0°
Design Incidence Angle i1ref 3.8°
Design Outlet Flow Angle α2ref 1.4°
The active flow control system is designed using
continuous or pulsatile control jets, issuing from the channel sidewalls, similarly as one of the methods tested by Zander et al. [3]. One profile (of the eight profiles cascade) was equipped with the active flow control. Totally four control jets are used, i.e. two from both side of the profile. The control jets issue from the orifices of diameter 4.5 mm, which are installed at the distance of 5 mm and 15 mm from the leading edge, i.e. at 5% and 15% of the suction side length from the leading edge (see figure 1). It is known fact that a downstream inclination of the control jets enhances their efficiency (Zander et al., [3]). Therefore, axes of the orifices are angled downstream along the suction side of the blade; the angle from the perpendicular to the sidewall is 30°.
2.2 Experimental methods
Flow past the blade cascade under various conditions was documented using classical schlieren method (set-up with the Toepler knife) and surface flow visualization. These "qualitative" measurements were complemented by measurements of the static pressure distribution on the controlled suction surface.
Schlieren pictures capture instantaneous filed of the density gradient in the flow field. Although this method is principally suitable for 2D flows, it can to some extent capture also origin of a 3D flow separation. Taking schlieren pictures as well as taking pictures and videos of surface paint movement were enabled by Plexiglas sidewalls to which the blade cascade was mounted. Surface flow visualization was realized using mixture of oil and Sudan orange pigment.
Static pressure distributions were measured by eight pressure tappings on the controlled suction surface. Locations of individual taps are shown in figure 2. Static pressures on the blade surface as well as pressures determining inlet flow conditions were connected to a 16 channel pressure transducer PSI9116.
single-sensor wire probe (55P16). The sampling frequency is 1 kHz and the number of samples is 2048. For the present experiments, the anemometer is calibrated in the velocity range from 0.21 m/s to 71.5 m/s. The linearization error of the calibration (using a five-degree polynomial) is within 2.3%.
The phase averaging of the velocity during one cycle is carried out using the velocity decomposition
u=U +UP+u’, where U is the time-mean velocity, UP is the periodic phase-locked component, and u’ is the fluctuating component. Data were processed in MatLab.
Fig. 3. Scheme of the pulsatile flow control system
3. Results
3.1 Pulsatile flow control system
Figure 3 shows the pulsatile flow control system. The air flow is supplied by a compressor and kept constant by a pressure regulator (not shown here). Further, the air is piped through the volumetric and pressure measurement points (manometers 1, 2, 4 and rotameter 3). The time-mean mass flow rate is evaluated from the volume flow rate and pressure measurements in the supply pipe. Finally, the air flows through a pair of solenoid valves (5) to the four control nozzles (6–9). An electronic control system was built to open and close these valves at a chosen phase shift. The maximum operating frequency, f, is approximately 20 Hz. This frequency was used in the present study. Based on the auxiliary tests, the duty cycle
was chosen 24%.
To find appropriate driven parameters, the pulsatile flow control system was tested before installation into the wind tunnel. For this reason, the outlet orifices were replaced by two slots with cross sections of 1.1mm x 50mm (i.e. the total outlet cross section was 1.7 times larger relative to four control orifices). The outlet centerline jet flow velocity was measured approximately 1.0 mm downstream the slot lips. Figure 4 shows the results of CTA measurement behind both slots as the periodic phase-locked component and the fluctuating component. The time mean velocity was evaluated 32.3 m/s and 43.5 from slot 1 and 2, respectively. The average of these two measurements is shown in figure 4 too. The time mean velocity from both measurements is 38 m/s.
0 20 40 60 80 100
0.00 0.01 0.02 0.03 0.04 0.05 U
U, slot 1 U, slot 2 u' u', slot 1 u', slot 2
U+UP, u' (m/s)
t (s)
Fig. 4. Centerline velocity during one cycle of the actuation at
f = 20 Hz and duty cycle 24%.
3.2 Wind tunnel experiments
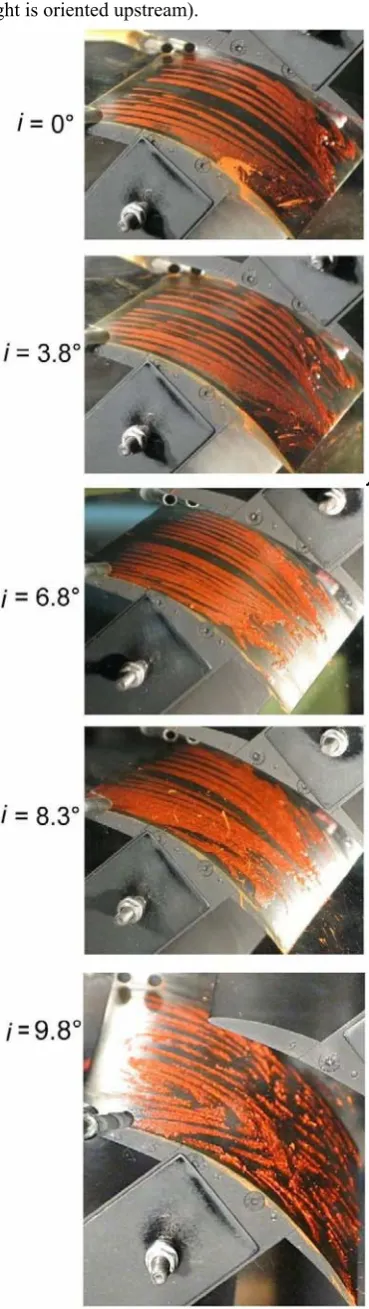
Figure 5 demonstrates a typical result of the surface streamline visualization. The experiments were made without flow control, and the flow direction is from the left to the right. A lengthwise strip in the middle of blade height lacks colour because a pressure tap array is located there and colour would make the taps sticky. The parameter of the sequence is the angle of incidence, which was adjusted from i = 0° to i = 9.8°, as is marked in figure 5. Note that the nominal design value of the incidence angle, according to Cyrus [4], is 3.8° – see Table 2 above.
pair of the counter-rotating vortices on each half of the blade height (surface streamline in the middle of the height is oriented upstream).
Fig. 5.Surface visualization for various incidence angles
i = 0° to i = 9.8°.
Fig. 6.Surface visualization for i = 8.3°, for various control jets: (a) no control, (b) steady control jets at cu = 1.39,
(c) pulsatile control jets at f = 20 Hz, cu = 0.93, (d) pulsatile
control jets at f = 20 Hz, cu = 1.30.
The described occurrence of the corner vortices and regions of separated flow agrees well with the literature, e.g. with the results by Zander et al. [3]. However, another significant feature of the surface visualization has not been observed in the present experiments. A laminar separation bubble, which was found by Zander et al. [3] at approximately 20% – 25% of the blade length (by means of an accumulation of their visualization colour). This fact is meaningful, because the present sidewall actuation is designed to influence this extremely sensitive boundary layer area with the corner vortex origin. Figure 5 indicates that the laminar separation bubble probably did not occur at the present experiments.
sidewall jets. Figure 6 (a) shows the flow pattern without flow control and figure 6 (b) the pattern with steady control jets. Figures 6 (c, d) show the patterns with pulsatile control jets. Following the above description, an effect of the control jets is difficult to affirm. In other words, the control mediator (i.e. laminar separation bubble) has not been as yet matched. The reason of this fact can be a governing role of the sidewall boundary layers in the present particular case with extremely robust
corner vortices (as is discussed above, figure 5).
Obviously, very robust corner vortices cannot be controlled by means of a delicate mechanism of the (possible) laminar separation bubble control.
0.45 0.55 0.65 0.75 0.85
0 0.1 0.2 0.3 0.4 0.5 0.6 0.7 0.8 0.9 n/c
Mis
i = 3.8° i = 6.8° i = 9.8°
Fig. 7. Isentropic Mach number distribution on the controlled suction side - uncontrolled cases
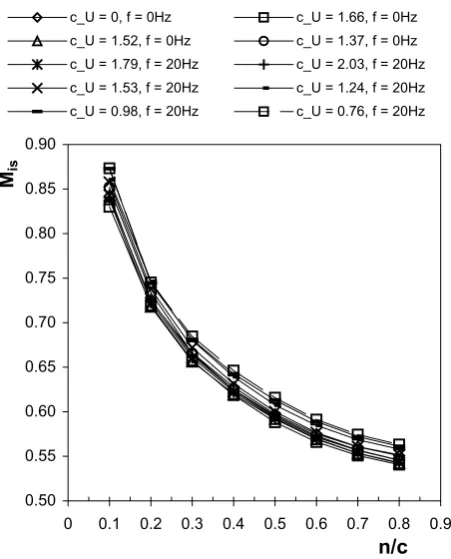
0.50 0.55 0.60 0.65 0.70 0.75 0.80 0.85 0.90
0 0.1 0.2 0.3 0.4 0.5 0.6 0.7 0.8 0.9 n/c
Mis
c_U = 0, f = 0Hz c_U = 1.66, f = 0Hz c_U = 1.52, f = 0Hz c_U = 1.37, f = 0Hz c_U = 1.79, f = 20Hz c_U = 2.03, f = 20Hz c_U = 1.53, f = 20Hz c_U = 1.24, f = 20Hz c_U = 0.98, f = 20Hz c_U = 0.76, f = 20Hz
Fig. 8. Isentropic Mach number distribution on the controlled suction side - controlled cases i = 9.8° (see legend)
Flow field development at uncontrolled regimes described above was also confirmed by distributions of isentropic Mach number on the suction surface (figure 7). In cases of incidence angles i = 3.8° and i = 6.8°, there is a noticeable change in the course of these curves starting at location n/c = 0.6, where n is the distance from the leading edge. This is in agreement with results of surface flow visualization of uncontrolled cases (figure 5), where we can observe onset of flow separation at location corresponding to the location of the 6th pressure tapping, i.e. n/c = 0.6. Although the wedge-like flow separation regions are located at the sidewalls and do not extend over the whole blade height, change in effective geometry of the interblade channel naturally results in deterioration of the isentropic Mach number distributions. In the case with completely separated flow at i = 9.8° the distribution keeps convex character all along.
Distributions obtained at controlled regimes are shown in figure 8. It is evident that at various set-ups of the control system, the distributions are practically unchanged. Naturally, flow separation taking place at the leading edge can not be controlled by control jets issuing from the sidewall downstream the leading edge.
Fig. 9. Sequence of schlieren pictures taken at incidence angles
Measurements of pressure distributions (isentropic Mach number distributions) at regimes i = 9.8° with flow control were performed based on schlieren pictures (figure 9) of uncontrolled regimes. These schlieren pictures suggested that extent of the flow separation at
i = 9.8° was appropriate for the control. Apparently, schlieren pictures revealed existence of the flow separation, its extent, however, was underestimated. Real extent of the flow separation was not clear until surface flow visualization was performed later on (see figure 5 and figure 6 above).
4. Conclusion
Flow past compressor blade cascade consisting of profiles NACA 65 with thickened trailing edge was documented by three independent methods (schlieren technique, pressure distribution measurements and surface flow visualization) of measurement at both controlled and uncontrolled regimes. Special attention was paid to off-design regimes, which are characteristic by partial or complete flow separation on the suction surface of the blades. In agreement with the literature, the visualizations confirmed a complexity of the 3-dimensional flow separation, which was intensified by influence of the sidewall boundary layers developing from upstream parts of the test section. Furthermore, it was found out that the effect of both continuous and periodic blowing was rather minor. Finally, the results agree with the available literature showing that it is highly difficult to considerably control the complex 3-dimensional flow separation in the compressor cascade using control jets issuing only from the sidewalls.
Acknowledgments
We gratefully acknowledge the support of the Grant Agency AS CR (Project No. IAA 200760801).
References
1. D.E.Culley, M.M. Bright, P.S. Prahst, A.J. Strazisar, Trans. ASME J. Turbomach. 126, 24–34 (2004). 2. M. Matějka, P. Šafařík, L. Popelka, J. Nožička,
ASME Turbo Expo, GT2008-51109 (2008).
3. V. Zander, M. Hecklau, W. Nitsche, A. Huppertz, M.
Swoboda, 9th European Conference on
Turbomachinery, Fluid Mechanics and Thermodynamics, Istanbul, March 21-25, 81–93 (2011).
4. A.Giebmanns, R.Schnell, W.Steinert, A.Hergt,
E.Nicke, C.Werner-Spatz, ASME Turbo Expo,
GT2012-69064 (2012)
5. J. Ober, F. Joos, ASME Turbo Expo, GT2012-69464
(2012)