IJEDR1903021 International Journal of Engineering Development and Research (www.ijedr.org) 122
Study the Effect of Traffic Heterogeneity in a
Coordinated Corridor using Simulation
Ponpriya M, Dr.Gunasekaran K Student, Professor
College of Engineering Guindy,Anna University
_____________________________________________________________________________________________________ Abstract -- Urban roads are experiencing a significant period of congestion and delay due to traffic signals. Traffic signal timing optimization and coordination is easy and very cost-effective way to improve the flow of traffic along the corridor. By altering and retiming existing traffic signals to the traffic flow variations, the efficiency of each intersection will improve. For the study, the Chennai Airport to Kathipara intersections was taken. The stretch has seven signalized intersections. The morning peak flow was during 8:00am and 9:00am. Signal timings were optimized using Macro Simulation software. The vehicular flow in PCU values and link attributes are given as input and the signal timings were optimized and coordinated with offset timings. The traffic flow in the network was simulated with the aid of micro simulation software to understand the vehicle to vehicle interaction and flow characteristics at micro level. The study findings are reported in this paper.
Index Terms -- Coordination, Offset timings, Optimization, Signal timings.
_____________________________________________________________________________________________________
I.INTRODUCTION
Signal coordination is occurring when a two or more signals are working together as a group, so that cars moving through the group will make the least number of stops as possible. Traffic is increasing at a rapid pace, proportional to the increasing population in all the cities in all the countries. As the traffic increases it causes traffic congestion. So different approaches can be used to minimize the traffic problem, such as, improving public transport, Expanding the communication mechanism, Proper handling of signal time, Consider the above the first two approaches require many resources as money, labor, area etc. They seem very difficult to achieve in many places due to lack of resources. Control of traffic light signal timing and signal co-ordination is least expansive and most effective means of reducing vehicular congestion in urban arterial. In urban arterial where traffic signals are nearby, the co-ordination of adjacent signals are very important and gives a greater benefit to the road users by increasing the utilization per unit time in the peak hours. Signal co-ordination plans are designed to reduce overall vehicle delay, reduce travel time, reduce fuel consumptions, reduce vehicle emissions, reduce road congestion, and also reduce neighborhood infiltrations. The following key elements are in signal coordination. Cycle Time, Green Time, Offset, and Phase. In signal coordination process Micro simulation and Macro simulation software’s are used. Micro simulation is a design and simulation software, and another one Macro simulation is (Traffic Network Study Tool) it is used to optimize the signal timing and signal coordination process.
II.BACKGROUND OF THE STUDY
Advanced Traffic analysis center, Signal coordination Strategies Final Report clearly defined about the different coordination method and their approaches and different coordinated software’s. Number of simulations software s is there. In which the best software is to determine for Micro and Macro simulation and Optimization [1]. Influence of Signal Coordination on travel time and delay this paper deals with, by using the signal coordination process the performance indexes like travel time and delay is minimized to certain percentage [5]. Arterial Signal Coordination with uneven cycling this paper deals with the various cycle length. The two different cycle lengths are used in a field condition means it is necessary to optimize the cycle length and signal time using macro simulation software for coordination process. By this optimization of cycle length having minimum delay [7]. Simulation of Traffic Flow in CBD Road Network of Madurai city, deals with heterogeneous traffic flow of traffic for a CBD road network, and after coordinating the corridor using simulation the performance indexes are minimized as compare to existing field conditions. For coordination process micro simulation software is used [10]. Traffic Signal Coordination as a measure for an Urban Arterials in Chennai city, this paper explained about, by the signal coordination process urban arterial is involving the smooth flow of traffic, and to minimize the delay, queue, travel time, fuel etc. [14]. In a micro simulation software is also used to understand the vehicle to vehicle interaction and also it works on the models of simulating the Driver Behavior which includes the Car Following model, Lane change model, and lateral behavioral with in a lane. From the past studies they were used either micro or macro simulation software. But for my study the Micro and Macro simulation both were used, so we are obtained an effective result of ensure minimum delay, stops, queue etc.
III.METHODOLOGY
IJEDR1903021 International Journal of Engineering Development and Research (www.ijedr.org) 123 process building of a micro simulation model is an important factor in this one the vehicle input, vehicle routing, signal design procedures is carried out. Once the signal plan is obtained from Macro simulation, the simulation of the situation is done in Micro simulation. For this, two are more scenarios can be taken and based on the indices of delay, speed, queue length and cost, best resulting scenario is proposed and recommended as a result of the work.
IV. MODEL DEVELOPMENT
A.Optimization of Traffic Signal Time in Micro Simulation
Traffic signal optimization is the process by which the timing parameters are changed relative to the length of the green light for each traffic movement and the timed relationship between signalized intersections. Optimizing traffic signal timing reduces both deceleration and the acceleration of vehicles, leading to less fuel being burned and less carbon dioxide emissions etc. the following steps are to be followed in optimization of signal timing process.
Step 1: Optimal Cycle Time Estimation of Individual Junctions
The signalized junctions are initially designed in TRANSYT to study how the signal actually works and how it results with delay. The link resembles the flow of traffic and the Node resembles the junction. The other inputs are lane configuration with saturation flow, distance between intersections, cycle length, phase sequence and minimum green. After designing the junctions, the Cycle Time Optimizer (CYOP) is processed for the signalized junctions. This ensures that the cycle time of the junctions gets optimized. The optimization is done by comparing the performance index against cycle time. From this, the optimizer recommends a cycle time for the best resulting performance index.
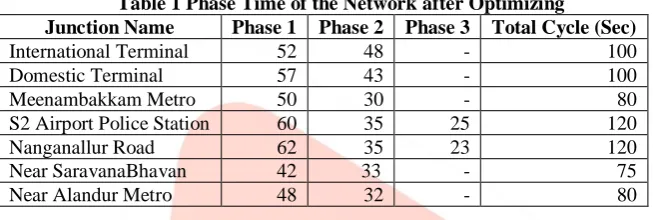
Table 1 Phase Time of the Network after Optimizing
Junction Name Phase 1 Phase 2 Phase 3 Total Cycle (Sec)
International Terminal 52 48 - 100
Domestic Terminal 57 43 - 100
Meenambakkam Metro 50 30 - 80
S2 Airport Police Station 60 35 25 120
Nanganallur Road 62 35 23 120
Near SaravanaBhavan 42 33 - 75
Near Alandur Metro 48 32 - 80
Step 2: Identification of Critical Junction and Cycle Time of other Junctions
Using Cycle time optimizer (CYOP) the cycle time of every junction is optimized. The cycle time is chosen between 0.75 times to 1.25 times of the critical cycle time so as to ensure that it results for minimum delay. Among the seven junctions, the critical junction is determined. Based on that the other junction’s cycle is either made half or multiple of the cycle times for coordinating signals.
Table 2 Common Cycle Time of the Network
Junction Name Phase 1 Phase 2 Phase 3 Total Cycle (Sec)
International Terminal 38 22 - 60
Domestic Terminal 35 25 - 60
Meenambakkam Metro 40 20 - 60
S2 Airport Police Station 58 37 25 120
Nanganallur Road 55 42 23 120
SaravanaBhavan 34 26 - 60
Alandur Metro 40 20 - 60
Step 3: Devising Coordination Plan
Optimization can be done based on Offsets, Offsets and Green Splits, Extended Offsets and Green Splits. Based on the requirements, the Optimization is given to the model. Once it is optimized, the offsets for each junction can be established to ensure coordination between the junctions.
Table 3 Offset and Green Time for Seven Junctions Junction Name Cycle Time
(Sec) Phase
Green Period
Green Splits Start End
International terminal 60 1 12 38 26
2 38 54 16
Domestic terminal 60 1 19 36 17
2 36 57 21
Meenambakkam Metro 60 1 11 39 28
2 39 54 15
S2Airport Police Station 120
1 19 59 40
2 59 89 30
3 89 111 22
Nanganallur Road 120
1 15 54 39
2 54 87 33
IJEDR1903021 International Journal of Engineering Development and Research (www.ijedr.org) 124
SaravanaBhavan 60 1 21 42 21
2 42 54 12
Alandur Metro 60 1 12 42 30
2 42 54 12
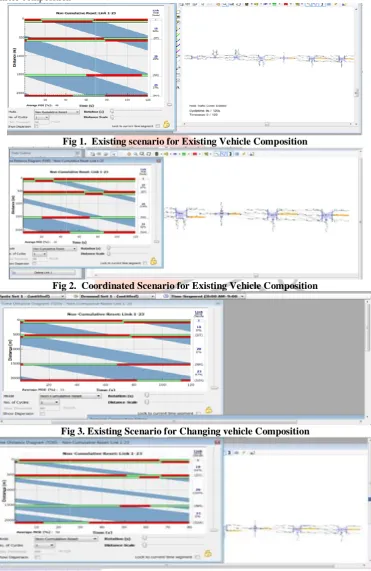
Time Space Diagram for Various Scenarios
Time-space diagrams are created by plotting the position of each vehicle, given as a distance from a reference point, against time. Time space diagrams are plotted for various scenarios. Fig 1 represents the vehicle move from one junction to another junction it is continuously stopped. So delay is occurring in existing scenario for existing vehicle composition. Fig 2 represents the vehicle move from one junction to another junction it is continuously green without any stopping so it ensures minimum delay in coordinated scenario for existing vehicle composition. Fig 3 represents vehicle move from adjacent junctions slightly stopped and creates delay in existing scenario with changing vehicle composition. And finally fig 4 represents the vehicle moves from adjacent junctions continuously green without any stopping so its ensure minimum delay in coordinated scenario with changing vehicle composition
Fig 1. Existing scenario for Existing Vehicle Composition
Fig 2. Coordinated Scenario for Existing Vehicle Composition
Fig 3. Existing Scenario for Changing vehicle Composition
IJEDR1903021 International Journal of Engineering Development and Research (www.ijedr.org) 125 B. Micro Simulation
Step 1: Traffic Input
Vehicle inputs must be given in volume. Vehicle composition comprises two wheelers, Two Wheelers, Cars, Autos, Buses and Trucks. Two wheelers of 58%, Autos of 4% and Cars of 35% are the dominating vehicle compositions. Other parameters such as vehicle Types, classes, design speed, acceleration and deceleration rates etc are given. They are given to represent the real-time existence of traffic flow, properties and speed.
Step 2: Vehicle Routing
It is the path which the vehicle adopts to travel in real-time. For each destination from a single origin, routing must be provided. It is the most important process which also includes the split of vehicle composition with relative flow.
Step 3: Signal Head and Simulation
Based on the existing phases and cycle time, the signals are designed and the signal heads are placed in the network at the appropriate places. From the signal controller program, signals can be created for junctions. For the signalized intersections, priority is given to the major traffic. This will help the junctions to perform well in the network. The network is simulated and calibration is done so as to ensure that the network model resembles the exact ground scenario.
V. CALIBRATION
Validation is essential for a model to validate it with the exact situation which prevails in the reality. Calibration of a micro simulation model for mixed traffic requires special procedures to address the unique characteristics of such traffic. Accordingly, a representation of vehicles, geometry and traffic, followed by identification of calibration parameters by multi parameter sensitivity analysis, setting their ranges heuristically and determining the parameter values by an optimization model. Validation of Micro simulation model can be done by calibrating the routing as per the In-flow and Out-flow at each junction. The major factor is the Driving behavior. The traffic representation addresses several distinct features of mixed traffic.
4.1. Driving Behavior
In driving behavior parameter as we can define the driving behavior properties of a link. Under this, there are four parameters namely following behavior, Lane change behavior, Lateral behavior and Behavior at Signal controllers. Each of the parameters is taken individually and simulated for the changes made and validated.
4.2. Following Behavior
In a Following Behavior, look ahead distance, look back distance, car following model and standstill distance play a major role. The supporting factors are additive and multiplicative part of safety distance, smooth close-up behavior.
4.3. Lane Change Behavior
In a Lane Change Behavior is the general behavior, maximum deceleration of own and trailing vehicle, cooperative lane change and lateral correction of rear end positions play a major role. The supporting factors are accepted deceleration, minimum headway, advanced merging etc.
4.4. Lateral Behavior
In a Lateral Behavior the desired position of free flow, lateral distance exceptions play a major role. In this one it is necessary to provide appropriate lateral distance for each vehicle category according to its exceptions. The supporting factors are considering next turn movement, overtake on same lane etc.
4.5. Signal Control Behavior
In a Signal control behavior, the parameters are checked for reaction to amber and behavior at red/amber. These two govern the behavior of vehicles at a signal.
VI. SCENARIO ANALYSIS
Scenarios are formulated and comparisons can be made between them to propose the best resulting scenario based on vehicle distance travelled, travel time and delays. In the study, four scenarios are proposed.
Scenario 1: Existing scenario with existing vehicle composition.
The first scenario is to model the existing road with uncoordinated signals. As a result of calibration of the existing road network was found and Network performance index are taken for the comparison.
Scenario 2: Coordinated scenario with existing vehicle composition.
The second scenario is to coordinate the existing signals in the road network. As a result, the vehicle entering into the network was found and Network performance index measures are compared.
Scenario 3: Existing scenario with changing vehicle composition.
The third scenario is the existing UN coordinated signals with changing the vehicle composition. Te result of this scenario is by changing the vehicle composition and their impacts on performance index are compared.
Scenario 4: Coordinated scenario with changing vehicle composition.
The Fourth scenario is the coordinated signals with changing the vehicle composition. The result of this scenario is by changing the vehicle composition and their impacts on performance indexes are compared.
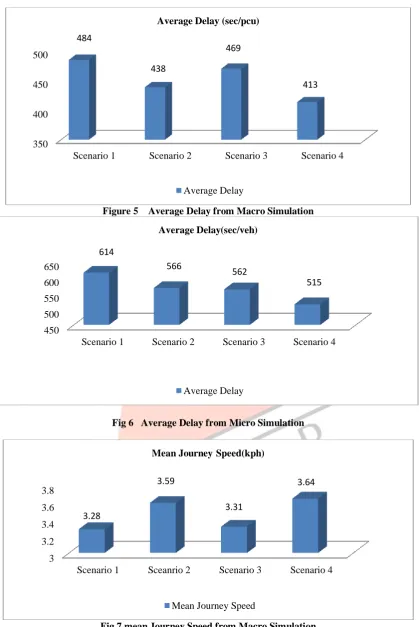
IJEDR1903021 International Journal of Engineering Development and Research (www.ijedr.org) 126 Figure 5 Average Delay from Macro Simulation
Fig 6 Average Delay from Micro Simulation
Fig 7 mean Journey Speed from Macro Simulation 350
400 450 500
Scenario 1 Scenario 2 Scenario 3 Scenario 4
484
438
469
413 Average Delay (sec/pcu)
Average Delay
450 500 550 600 650
Scenario 1 Scenario 2 Scenario 3 Scenario 4 614
566 562
515 Average Delay(sec/veh)
Average Delay
3 3.2 3.4 3.6 3.8
Scenario 1 Sceanrio 2 Scenario 3 Scenario 4 3.28
3.59
3.31
3.64 Mean Journey Speed(kph)
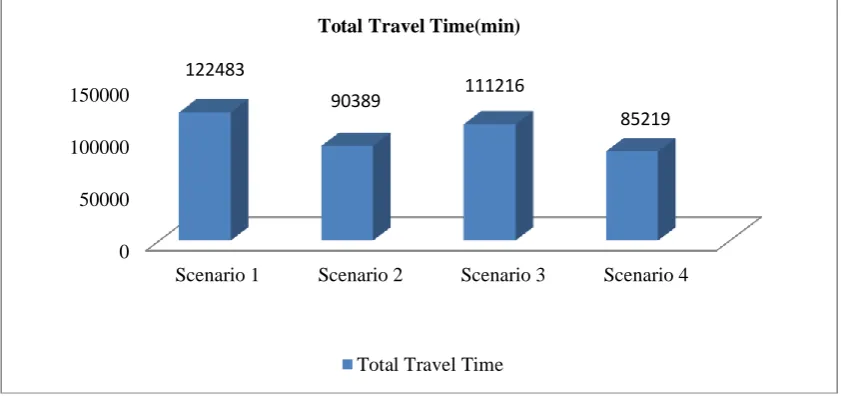
IJEDR1903021 International Journal of Engineering Development and Research (www.ijedr.org) 127 Fig 8 Total Travel Time from Micro Simulation
VII CONCLUSION
The result of the study is Delay was reduced by 10% for the coordinated scenario and 15% reduction for changing the vehicle composition with coordinated scenario in Macro simulation. In the coordinated scenario delay got reduced by 8% and changing the vehicle composition with coordinated scenario got reduced by 16% in Micro simulation. Journey speeds were also obtained from Macro simulation. It is found that the journey speed has increased for coordinated and changing the vehicle composition with coordinated scenario when compared with existing conditions. Journey speed has been improved by 9% for the coordinated scenario and 10% improvement for changing the vehicle composition with coordinated scenario. When compared with the existing scenario, the total travel time for coordinated and changing the vehicle composition with coordinated scenario is reduced. And the number of persons travelled is increased during changing the vehicle composition with coordinated scenario. REFERENCES
[1] Advanced Traffic analysis center (2003), “Signal coordination Strategies” - Final Report, Upper Great Plains Transportation Institute, North Dakota University. North Dakota.
[2] Bao Lin Ye, Weimin Wu, Weijie Mao (2015), “A method for signal Coordination in large scale urban road network”, Journal of mathematical problems in Engineering Volume 2015.
[3] Binayak Bhattarai and Anil Marsani, (2015), “Time Based Traffic Signal Coordination (A Case Study of Gatthaghar and NayaThimi Intersections)”, Research Paper of IOE Graduate Conference, 2015 pp.48-54.
[4] Bin L and Zong Tian, (2016), “An offset optimization approach for Coordinated signal systems with preferred measure considerations”, Sage Journals of advances in Mechanical Engineering. 2016.Volume 8, pp.1-10.
[5] Dave. H.K and Momin Safabanu Fazalmohammed, “Influence of Signal Coordination on travel time and delay”, International Journal of Engineering Development and Research, 2014, Volume 2.
[6] Essam H. and Almasri, (2014), “Signal Coordination for Saving Energy and Reducing Congestion Using TRANSYT-7F Model and Its Application in Gaza City”, Journal of scientific Research and Development. Volume 5, pp.282-291. [7] HongminZhou, H. Gene Hawkins Jr, Yunlong Zhang, (2017), “Arterial Signal Coordination with uneven Cycling”,
Journal of Transportation Research Part A: Policy and Practice, 2017, Volume 103, pp.409-429.
[8] Jinpeng. L V and Yunlong Zhong, (2012), “Effect of signal coordination on Traffic Emission”, Transportation Research Part D: Transport and Environment, 2012, volume 17, pp. 149-153.
[9] Jian Zhang, Yang Cheng, and Bin Ran, (2017), “Improving method of real- time offset tuning for arterial signal coordination using probe trajectory data”, Journal of Advances in Mechanical Engineering,2017, Volume 9,pp.1-7. [10] John Finney. M, (2018), “Simulation of Traffic Flow in CBD Road Network of Madurai city.15th World Conference
on Transport Research at IIT Mumbai.
[11] Karhik .G, Rale Goankar. R.V, (2014), “Optimization of signal timing at Signalized Intersection”, IOE conference at VIT Nagpur.
[12] Khewal bhupendrakesur (2001), “Optimization of Mixed cycle length of Traffic Signals” Journal of advanced Transportation. 2014.Volume 48, pp.431-442.
[13] Lihui Zhang, Ziqi Song, Xiaojun Tang, (2016), “Signal Coordination models for long Arterials and Grid networks”. Journal of Transportation Research Part C, Volume 71, pp.215-230.
[14] Naveen Kumar. S, Moses Santhakumar, Samson Mathew, (2011), “Traffic Signal Coordination as a measure for an Urban Arterials in Chennai city”. Conference of IOE Graduates, 2011 at Sri Ram Engineering College, Chennai. [15] Nishant Kushwah, Raman Natariy, Anuj Jaiswal, (2015), “Traffic Signal Coordination for Effective Flow of Traffic”,
International Journal of scientific research and development. Volume 3.
[16] Peng Jiao, (2016), “Dynamic Green Split Optimization in Intersection Signal Design for Urban Street Network”, ME Thesis, Master of Science in Civil engineering, Purdue University.
0 50000 100000 150000
Scenario 1 Scenario 2 Scenario 3 Scenario 4 122483
90389 111216
85219 Total Travel Time(min)
IJEDR1903021 International Journal of Engineering Development and Research (www.ijedr.org) 128 [17] Sankat. H, Davara Milan, P. Pandya, (2011), “Improvement of Signalized Urban Intersection through Optimization of
Signal Timing”. Journal of Global Research and development for Engineering, Volume 15.
[18] Xia Liu, Hao Hang, Wen Yang, (2014), “Signal Coordination Control and Simulation for Multi Intersections”, Institute for Interdisciplinary Research, jianghan University,China.
[19] Yunlong Zhang, Vilieger, (2012), “Effect of Traffic Signal Coordination on Noise and Air Pollutant Emission”, Journal of Environmental Modelling and Software, volume35, pp.74-83.