www.nat-hazards-earth-syst-sci.net/17/703/2017/ doi:10.5194/nhess-17-703-2017
© Author(s) 2017. CC Attribution 3.0 License.
Examining the impact of lahars on buildings using numerical
modelling
Stuart R. Mead1,2,3, Christina Magill1, Vincent Lemiale2, Jean-Claude Thouret4, and Mahesh Prakash2 1Risk Frontiers, Department of Environmental Science, Macquarie University, Sydney, Australia
2Commonwealth Scientific and Industrial Research Organisation, Clayton 3168, Victoria, Australia 3Volcanic Risk Solutions, Institute of Agriculture and Environment, Massey University,
Private Bag 11 222, Palmerston North, New Zealand
4Université Clermont Auvergne, CNRS, IRD, OPGC, Laboratoire Magmas et Volcans, 63000 Clermont-Ferrand, France
Correspondence to:Stuart R. Mead ([email protected]) Received: 29 August 2016 – Discussion started: 2 September 2016
Revised: 5 April 2017 – Accepted: 14 April 2017 – Published: 17 May 2017
Abstract.Lahars are volcanic flows containing a mixture of fluid and sediment which have the potential to cause signif-icant damage to buildings, critical infrastructure and human life. The extent of this damage is controlled by properties of the lahar, location of elements at risk and susceptibil-ity of these elements to the lahar. Here we focus on under-standing lahar-induced building damage. Quantification of building damage can be difficult due to the complexity of lahar behaviour (hazard), varying number and type of build-ings exposed to the lahar (exposure) and the uncertain sus-ceptibility of buildings to lahar impacts (vulnerability). In this paper, we quantify and examine the importance of lahar hazard, exposure and vulnerability in determining building damage with reference to a case study in the city of Are-quipa, Peru. Numerical modelling is used to investigate lahar properties that are important in determining the inundation area and forces applied to buildings. Building vulnerabil-ity is quantified through the development of critical depth– pressure curves based on the ultimate bending moment of masonry structures. In the case study area, results suggest that building strength plays a minor role in determining over-all building losses in comparison to the effects of building exposure and hydraulic characteristics of the lahar.
1 Introduction
the event which alter exposure and often rely on a priori as-sumptions of building strength and vulnerability (Ettinger et al., 2015). Pre-event assessments are affected by the lack of reliable hazard intensity measures (van Westen et al., 2006; Ettinger et al., 2015), differences in spatial and temporal scales, uncertainty surrounding site-specific lahar triggers (Di Baldassarre and Montanari, 2009) and a lack of structural information on building stock (Ettinger et al., 2015). These issues are reflected in the relative lack of studies on hazard impact in urban areas (Jenkins et al., 2015) and often result in a reliance on expert judgement to develop vulnerability models for lahars and flash floods (Ettinger et al., 2015).
The physical vulnerability of buildings, defined as the sus-ceptibly of a building to damage with respect to the hazard (Künzler et al., 2012), is a function of building characteristics such as size, shape, age, construction materials, structural in-tegrity, maintenance and build quality (Martelli, 2011; Kün-zler et al., 2012; Ettinger et al., 2015). Information on these building properties is often lacking and hard to collect on a large scale. This commonly leads to the simplification of vulnerability into a measure that can provide a relative indi-cation of vulnerability and consequent damage (Künzler et al., 2012). Studies simplifying vulnerability as a relative in-dex use a combination of qualitative and quantitative metrics obtained through building surveys, interpretation of remote sensing data and GIS techniques to map and analyse vulner-ability on a large scale (e.g. Lavigne, 1999; Künzler et al., 2012; Galderisi et al., 2013; Thouret et al., 2013, 2014; Et-tinger et al., 2015). These methods can be applied to under-stand and highlight spatial patterns in vulnerability; however, as a relative measure, they cannot provide guidance on abso-lute damage for any specific event.
A direct estimation of damage caused by specific events requires quantified relationships describing a building’s re-sponse to the hazard. Buildings can be damaged through a number of mechanisms including (i) direct damage resulting from static and dynamic forces imposed by the flow, (ii) dam-age to foundations through erosion and scour, (iii) buoyancy effects of the flow causing structures to float, (iv) direct dam-age from larger debris (missiles) within the flow and (v) indi-rect damage caused by chemical and biological actions such as seeping induced weakness of mortar (Kelman and Spence, 2004). All these actions, apart from chemical and biological effects, are related directly to lahar depth, velocity or a com-bination of depth and velocity. Thus, a common approach in determining building damage thresholds for a particular building type is to relate damage to hazard intensity mea-sures of depth and/or velocity (e.g. Zanchetta et al., 2004; Custer and Nishijima, 2015; Jenkins et al., 2015). However, building typologies are affected by socio-economic, cultural and institutional conditions (Künzler et al., 2012), and hazard intensities (flow depth and velocity) are affected by build-ing environmental factors such as local elevation, distance from main channels and orientation (Thouret et al., 2014). This results in complex interactions between hazard,
expo-sure and vulnerability. These issues cause direct vulnerability relationships to be site-specific and require detailed investi-gation of the regions at risk to examine the relative effects and role of hazard, exposure and vulnerability on building loss.
We attempt to quantify and examine the components that determine building damage in a small area within the city of Arequipa, Peru. A relative index of vulnerability on a city-block scale was developed for Arequipa in Thouret et al. (2013, 2014). The studies by Thouret et al. (2013, 2014) highlighted two groups of vulnerability indicators (building characteristics and the physical setting) that play an impor-tant role in determining vulnerability within Arequipa. In this study, we separate the building characteristics (i.e. vulnera-bility) from the physical setting (i.e. exposure) to examine the effect of hazard (flow rate and rheology), exposure (building orientation and location) and vulnerability (building type) components on building loss within Arequipa. Physical vul-nerability of buildings is explicitly separated from exposure through the development of a building damage model that is dependent on flow velocity, depth and sediment concen-tration. Simulations of lahar flow using smoothed particle hydrodynamics are used to examine how flow characteris-tics and the physical setting of city blocks affects forces on buildings and the consequent damage. While, for reasons ex-plained earlier, damage functions presented here are neces-sarily specific to Arequipa, the hazard modelling approach and vulnerability model development are described in detail to support risk assessment in other regions affected by lahars.
Qda. Dahlia Qda. Dahlia R io C h ili Ri o Chil i Qda. San Laza ro
Qda. San Laza ro
Qda. Venezuela Qda. Venezuela
Qda. Hu arangal Qda. Huar
angal
Qda. A ndam ayo Qda. Andama yo Highway Main road Street River Quebrada
Figure 1. Location of Arequipa in relation to the El Misti vol-cano, showing the main quebradas and the location of the Quebrada Dahlia study area.
(up to 3 m above the quebrada) are frequently flooded (ap-prox. every 2 to 10 years). The higher terraces (T10 to T20, 3 to 10 m above the quebrada) are rarely flooded (estimated 20 to 100 years) and the highest terraces (T3 and T4) are only likely to be inundated by lahars linked to large erup-tions (Thouret et al., 2013, 2014). A city-wide vulnerability study by Thouret et al. (2014) identified that the city blocks most vulnerable to flash floods and lahars were on the lower terraces and typically within 100 m of a quebrada.
To build on this study and investigate the vulnerability of the quebrada channel and banks in detail, simultaneous pho-togrammetry and building surveys were undertaken along short sections (approximately 200 m) of several quebradas during September 2013. Here we focus on one 150 m-long section of Quebrada Dahlia to examine lahar hazard and building damage. Quebrada Dahlia is a small tributary of Quebrada Mariano Melgar-Huarangal (Fig. 1), which is situ-ated in the Mariano Melgar District on the north-easternmost fan of Arequipa, shown in detail in Fig. 2. The case study area was chosen for the following reasons:
– The quebrada channel is reasonably straight, reducing the effect of bends in the watercourse on lahar dynam-ics.
– Building quality varies from well-built reinforced ma-sonry buildings to makeshift structures with little to no mortar. This allows for an investigation of the effects of building quality on damage caused by lahars.
– All buildings are situated on the lowest terraces (T0– T10, 1–5 m above the channel), meaning they may be affected by even the smallest events identified in Vargas Franco et al. (2010) and Thouret et al. (2013).
A three-dimensional reconstruction of the terrain and buildings along Quebrada Dahlia was created using the pho-togrammetry method described in Mead et al. (2015). The surface reconstruction, shown in Fig. 2b, contained 1.4 mil-lion points with a surface density of between 150 and 750 points per m2. A GNSS-D survey undertaken in Octo-ber 2014 enabled georeferencing of the terrain reconstruc-tion for possible inclusion in future GIS applicareconstruc-tions. The surface reconstruction was smoothed and reduced to create the lower-resolution terrain model shown in Fig. 2c to be used in the lahar simulations. The terrain model in Fig. 2c contains 22 buildings identified during building surveys in 2013. Streets and the quebrada (shown in Fig. 2a) separate these buildings into five city blocks (labelled in Fig. 2c), re-ferred to hereafter as “blocks”. The typology of each build-ing was characterised through surveys undertaken in 2013 following the approach of Thouret et al. (2014). In this ap-proach, buildings are classified as one of eight structural types (1A–8C) based on a visual inspection to determine con-struction material, roof type and structural support (see Ta-ble 1). These types were then grouped into larger simplified structural classes. Using this building classification system, the study area contains eight class A0 buildings, seven class A buildings and seven class B buildings (see Table 2 for a description of building types and structural classes).
3 Developing building vulnerability relationships Buildings and infrastructure can be damaged through a va-riety of mechanisms brought upon by the actions of a lahar. Here, as in most other studies of lahar damage (Zanchetta et al., 2004; Toyos et al., 2008; Ettinger et al., 2015; Jenkins et al., 2015), we focus on the direct damage resulting from hy-drostatic and hydrodynamic forces applied to buildings. We regard these actions as the most important, although scour and large debris missiles within the flow can also cause sig-nificant damage (Jenkins et al., 2015). Scour and debris ac-tions are neglected here as they are currently too difficult to predict and incorporate into large-scale loss analyses (Kel-man and Spence, 2004), particularly in regions with limited hazard and exposure information.
Table 1.Individual building type and vulnerability classes for each block in the Quebrada Dahlia study area. Block ID increases from north to south.
Block ID Type Structural class Structural class Type ID Block
1 1A A A0 2A 1
2 1A A0 A0 2A 2 East 1
3 4 B A 3 3
West 1 4 4 A0 A0 1B 1
5 2B A0 A 3 2 East 2
6 3 A A0 1B 3
7 4 B A0 1A 4
1 4 B B 4 1
2 4 B A 3 2
West 2 3 4 B A 3 3 East 3
4 4 B
5 3 A
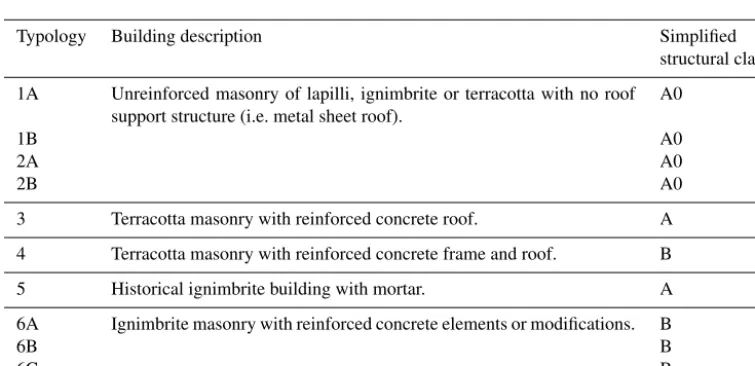
Table 2.Building types and simplified structural classes from Thouret et al. (2014).
Typology Building description Simplified
structural class
1A Unreinforced masonry of lapilli, ignimbrite or terracotta with no roof support structure (i.e. metal sheet roof).
A0
1B A0
2A A0
2B A0
3 Terracotta masonry with reinforced concrete roof. A
4 Terracotta masonry with reinforced concrete frame and roof. B
5 Historical ignimbrite building with mortar. A
6A Ignimbrite masonry with reinforced concrete elements or modifications. B
6B B
6C B
The ultimate bending moment (Mu)is calculated using the following equation (Roos, 2003):
Mu=(ft+fd)wb 2
6 , (1)
whereftis the tensile strength of the masonry wall,fdis the design compressive stress acting on the wall,wis the width of the wall facing the flow andbis the thickness of the wall, which is assumed equal to the brick width. Tensile strength and design compressive stresses for buildings in Arequipa are calculated using the approach specified in Australian Stan-dard (AS) 3700–2011 and summarised in Appendix A in ad-dition to an approach calculating ultimate shear force. Pre-liminary investigations using these two approaches suggested that the force required to overcome the ultimate moment was consistently lower than the force required to overcome the ultimate shear force. Therefore, we chose to focus the re-mainder of this study on the ultimate bending moment only.
East 1
East 2
East 3
West 1
West 2
(a)
(b)
(c)
Figure 2. Overview of the Quebrada Dahlia study area, Are-quipa, (a) aerial image with black outline showing study area, dashed outline showing channel banks and transparent lines show-ing streets in the area,(b)photogrammetric reconstruction of the surface and(c)individual buildings and building blocks identified from building surveys.
4 Critical depth–pressure curves
The range of design compressive stress for each building ty-pology is shown in Fig. 3. The range was obtained by cal-culating the design compressive stress for every configura-tion of masonry compressive strength (fc), wall thickness (b) and thickness coefficient (kt)in Appendix A. Buildings with reinforced frames (types 3, 4 and 6) can withstand much greater compressive stresses than non-reinforced buildings (types 1, 2, 5). The wall thickness has a large effect on build-ing strength, which is consistent with observations by Jenk-ins et al. (2015). Notably, the design compressive stresses are similar for building types that share the same simplified structural class identified in Thouret et al. (2014), based on
Figure 3. Range of design compressive stress for building types 1A–6C defined in Thouret et al. (2014). Compressive stress capacity was calculated for every configuration of compressive strength (fc), bedded area (Ab) and thickness coefficient (kt)at brick widths (b)of 150 and 250 mm.
the structural classes of Zuccaro et al. (2008). Given these similarities, we also use the simplified structural classes (A0, types 1A–2B; A, types 3 and 5; and B, types 4 and 6A–6C, see Table 2) from Thouret et al. (2014).
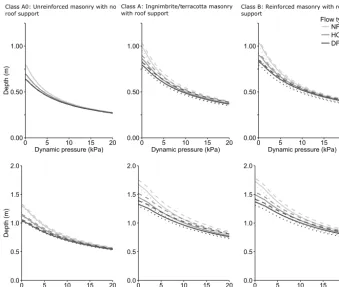
Class A0: Unreinforced masonry with no
roof support Class A: Ingnimbrite/with roof support terracotta masonry Class B: Reinforced masonry with roof support
NF HCF DF Flow type
Figure 4.Critical depth and dynamic pressures for failure of structural classes A0, A and B for brick widths of 0.15 m (top) and 0.25 m (bottom). Shading of the lines indicate flow type and density, dotted lines and dashed lines represent the minimum and maximum forces required. Densities are for a Newtonian flow (NF,ρ=1000 kg m−3), hyperconcentrated flow (HCF,ρ=1500 kg m−3)and debris flow (DF,
ρ=1915 kg m−3).
5 Lahar numerical modelling and results
5.1 Lahar rheology and implementation in smoothed particle hydrodynamics
Lahar flow behaviour varies depending on the sediment centration and composition of the flow. At very low con-centrations of sediment, lahars will flow in a similar manner to water. At higher concentrations, interactions between the sediment and water cause a non-linear response to stresses applied to the flow. This non-linearity in the stress–strain re-lationship requires the use of rheology models that capture both the linear (i.e. water-like, called Newtonian) and non-linear (called non-Newtonian) shear response. Here we im-plement a generalised quadratic rheology model to simulate lahar flows along the case study area. The quadratic rheology model can be expressed as follows (Julien and Lan, 1991; O’Brien et al., 1993; Jan and Shen, 1997):
τ =τy+µγ˙+αγ˙2, (2)
whereτis the shear stress,τythe yield strength,µthe
viscos-ity,γ˙the shear rate, andαis the turbulent-dispersive param-eter, a coefficient that combines the effects of turbulence and dispersive stresses caused by sediment collisions. This model
follows the general form of the Herschel–Bulkley equation commonly used to describe non-Newtonian lahar behaviour (Manville et al., 2013).
equa-tions for rheology can be written as a generalised Newtonian fluid in terms of the apparent viscosity:
τ =ηγ .˙ (3)
When the apparent viscosity is constant the fluid is Newto-nian with a viscosity ofη. Non-Newtonian fluids can be mod-elled using Eq. (3) by developing relationships for ηbased on constitutive equations (Mitsoulis, 2007). Using this ap-proach, the apparent viscosity for the quadratic rheology is η=τy
˙
γ +µ+αγ .˙ (4)
To reduce computational time we use the viscosity regular-isation approach of Papanastasiou (1987), described in Mit-soulis (2007) and Minatti and Paris (2015). Regularisation is required as the apparent viscosity approaches infinity at low strain rates when using Eq. (4), reducing the simulation time step and significantly increasing computational cost. Using the Papanastasiou (1987) approach, the regularised viscosity used in simulations is
ˆ η=τy
˙ γ
1−e−cγ˙+µ+αγ ,˙ (5)
wherecis the viscosity scaling parameter. Larger values of c result in a better approximation of the constitutive equa-tion (Eq. 4), while smaller values result in smaller appar-ent viscosities and larger simulation time steps. Here we set c=200, a value which yielded the best balance between simulation speed and accuracy in validation simulations that compared flow down an inclined plane with analytical solu-tions.
5.2 Lahar simulations
Static and dynamic pressures acting on the buildings in the Quebrada Dahlia study area were determined for 12 different inundation scenarios. We use the same SPH particle spac-ing (12.5 cm) of previous simulations by Mead et al. (2015). This resolution provided the best balance between compu-tational time and resolution of fine-scale features that can affect the flows. Inundation scenarios were designed to ex-plore a wide range of flow types and velocities in order to investigate the effect of rheology and velocities on flow dy-namics and forces exerted on buildings. Simulations were run for three different flow types (Newtonian, hyperconcentrated streamflow and debris flow) at constant flow rates of 25, 50, 75 and 100 m3s−1.
The flow rates were chosen to produce scenarios rang-ing from minimal (25 m3s−1)to extreme (100 m3s−1) over-bank flooding. The ratio between inertial and gravitational forces, expressed through the Froude number, was kept be-low 1 (subcritical fbe-low) for each fbe-low rate by varying the flow area. Froude number consistency was used here as in-ertial and gravitational forces are dominant controls on en-vironmental flows such as these. Flow types were selected to
represent the characteristics of the most commonly occurring flows in Arequipa – flash flood, hyperconcentrated stream-flow and fine-grained, matrix-supported debris stream-flow (Thouret et al., 2013). Rheology of flash flood flows was considered to be completely Newtonian with a viscosity of water (i.e. τy, α=0, µ=0.001 and density (ρ)=1000). Rheological
parameters for hyperconcentrated and debris flows (Table 3) were chosen using the dimensionless ratio between disper-sive and viscous stresses explained in Julien and Lan (1991). Values for yield strength (τy), viscosity (µ) and the
turbulent-dispersive coefficient (α)were taken from the experiments of Govier et al. (1957) and Bagnold (1954), reported in Julien and Lan (1991). For a hyperconcentrated streamflow, we pre-sumed a particle concentration by volume (Cv)of approx-imately 30 %, consisting mostly of finer particles, meaning viscous stresses are still relatively important. Debris flow scenarios were assumed to contain larger particles at a higher valueCvof approximately 55 %. The particle concentration acts to increase density, viscosity and the dispersive stress coefficient in hyperconcentrated and debris flow rheologies compared to a fully Newtonian water flow. The higher par-ticle concentration of the debris flow (compared to a hyper-concentrated flow) also results in a much higher dispersive stress coefficient, meaning that dispersive stresses will have more importance in determining flow behaviour.
Computational cost limits the length of simulations to the first 45 s of lahar flow for each scenario. The flow was not established and constant by 45 s, so these simulations do not represent the forces exerted on buildings by a steady flow rate. Instead, the scenarios considered here are more repre-sentative of the higher velocity and depth surges or waves in a lahar.
5.3 Flow behaviour
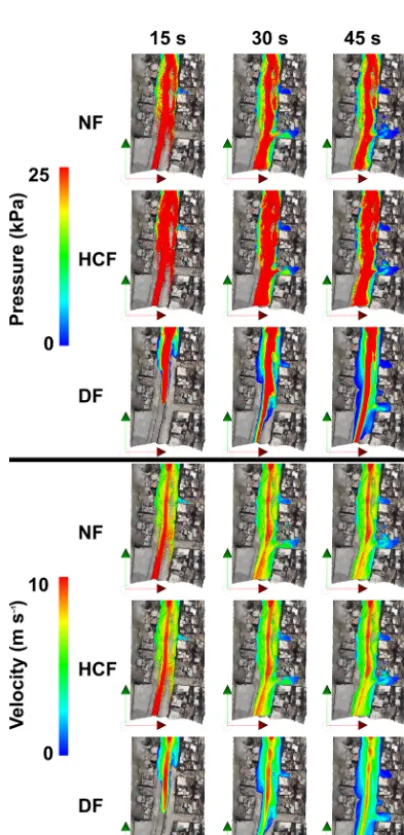
Figure 5 displays snapshots of velocity and dynamic pressure magnitudes for each flow type at a flow rate of 75 m3s−1. Snapshots were taken at 15 s intervals and dynamic pressure was calculated asρv2/2, wherevis the velocity magnitude. Lahars mostly followed the developed channel of Quebrada Dahlia for the first 15 s before overtopping the bank and spreading outwards. Channel and overbank pressures and ve-locity profiles are similar for Newtonian and hyperconcen-trated flows, but the velocity of overbank flow is much lower for the debris flow rheology. This lower velocity is presum-ably caused by increased friction in the debris flow due to the higher viscosity and dispersive coefficients. The dynamic pressure differs between each rheology as a result of the var-ied densities (and lower velocity for debris flows); however, the maximum pressure is still similar between rheologies as maximum velocities are mostly confined to the channel.
Table 3.Density, particle concentration and rheology coefficients for hyperconcentrated streamflow and debris flow simulations, taken from Govier et al. (1957), Julien and Lan (1991).
Flow type Density Particle concentration Yield strength Viscosity Dispersive stress (kg m−3) by volume (%) (τy, Pa) (µ, Pa s) coefficient (α)
Hyperconcentrated 1500 30.3 0.94 0.0137 1.28×10⁻⁵
streamflow
Fine-grained, matrix 1915 55.5 0.672 0.0485 0.00224
-supported debris flow
Figure 5.Evolution of dynamic pressure and velocity magnitudes for a 75 m3s−1flow along Quebrada Dahlia for a Newtonian flow (NF), hyperconcentrated flow (HCF) and debris flow (DF). Arrows indicate northerly (green) and easterly (red) directions.
the walls of each building. The critical strength of a wall is determined from the forces acting normal (perpendicular) to the structure; therefore it is important to calculate dynamic pressure from velocity normal to the wall. The section of Quebrada Dahlia studied here runs in a north–south direction and the buildings have walls that are oriented either parallel or perpendicular to the channel, so an initial understanding of the perpendicular forces acting on walls can be interpreted from the north–south (N–S) and east–west (E–W) velocity components. Figure 6 shows the dynamic pressure calculated from directional velocity components at 40 s for a flow rate of 75 m3s−1. Figure 6 shows a consistent pattern for all rheolo-gies where the pressure is dominated by the streamwise (N– S) velocity. The pressure applied to walls facing the stream (∼E–W direction, third column of Fig. 6) is much lower than the pressure applied to walls perpendicular to the stream. Higher pressures for E–W velocities are observed along cross streets splitting each city block; however, the pressure that acts perpendicular (N–S) to these walls is minimal. These observations indicate that pressure calculated from the mag-nitude of velocity, which is often assumed to be acting per-pendicular to walls (e.g. Zanchetta et al., 2004; Jenkins et al., 2015), can be much higher than actual pressure acting on walls and the use of velocity magnitudes could therefore lead to an overestimation of building damage.
Figure 6. Directional components of dynamic pressure for a 75 m3s−1flow along Quebrada Dahlia for a Newtonian flow (NF), hyperconcentrated flow (HCF) and debris flow (DF). Maximum pressure is 25 kPa for magnitude and N–S pressures, 1 kPa for E–W pressure.
timing of peak pressure also affected. This further demon-strates the importance of considering normal velocity rather than velocity magnitude when estimating dynamic pressures (and consequently damage).
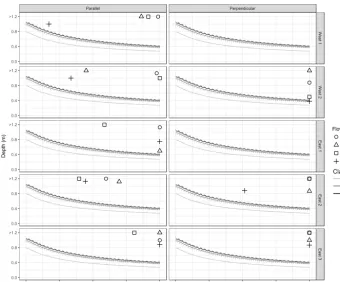
Pressures acting on each block in the study area, calculated using the technique explained in the previous paragraph, are shown in Fig. 8 for a flow rate of 75 m3s−1. Blocks East 1 and West 1 do not have walls facing perpendicular to the flow and therefore have no pressures recorded in that orien-tation. The pressure for each block generally follows a sim-ilar pattern through time with a well-defined peak pressure and a lower, steady background pressure. The rise of pres-sure to its peak value and reduction to its background value occurs over the space of approximately 20 s for each block. This time frame is too short to allow for an equalisation of hydrostatic pressure between the inside and outside of build-ings, confirming that both hydrostatic and dynamic pressures are acting on walls during lahar surges. The timing of the peak is delayed for downstream blocks and the magnitude of the peak for each block varies. The differences in peak pressure are caused by exposure effects such as orientation and elevation of each block relative to the quebrada. Walls
p
Figure 7.Comparison of mean pressure magnitude (grey lines) and mean normal pressure (black lines) on block West 2 in the parallel and perpendicular orientations for a 75 m3s−1flow along Quebrada Dahlia.
-1
p
Figure 8.Mean normal pressures applied to each city block in the perpendicular and parallel orientations for a 75 m3s−1flow.
facing perpendicular to the stream are generally exposed to higher dynamic pressures than parallel walls, but this effect appears to vary and could be dependent on cross-street eleva-tions (cross streets leading away from Qda. Dahlia increase in elevation at different rates).
A0 A B Class
Figure 9.Critical depth–pressure curves for building classes A0, A and B subjected to Newtonian flow. Peak normal pressures and corre-sponding depths applied to each city block are plotted as points for each flow rate.
A0 A B Class
A0 A B Class
Figure 11.Critical depth–pressure curves for building classes A0, A and B subjected to a debris flow. Peak normal pressures and correspond-ing depths applied to each city block are plotted as points for each flow rate.
lower than Newtonian flows near perpendicular walls. Debris flow pressures are much lower than both Newtonian and hy-perconcentrated flows as the yield strength and dilatant rhe-ology components limit overbank flow velocities.
6 Application of critical depth–pressure curves
Depth at the maximum value of pressure acting on block walls for each scenario is used to determine whether individ-ual buildings in the study area can withstand the bending mo-ment applied by hydrostatic and dynamic pressure. Figures 9 to 11 plot the peak pressure and “surge depth” (depth at the time of peak pressure) for Newtonian, hyperconcentrated and debris flows alongside critical depth–pressure curves for vulnerability classes A0, A and B with a wall thickness of 150 mm (results for 250 mm wall thicknesses are provided in the Supplement). The hazard variables of flow rate and la-har rheology appear to influence building damage, although the size of the effect is difficult to determine since most sce-narios place depth and pressure combinations well above the critical curves for each block. The flow depth, which affects hydrostatic pressure and bending moment location, generally increases with the flow rate while the dynamic pressure ap-pears to be mostly controlled by the rheology in combination with flow rate. The forces applied to the West 2 block,
con-taining one class A and 4 class B buildings, are lower than the other blocks. This is possibly due to the relative elevation and orientation of each block to the quebrada (i.e. exposure) affecting dynamic pressure and lahar depth. Debris flow sce-narios at flow rates of 25, 50 and 75 m3s−1indicate depths and pressures below the critical limit for this block’s building classes.
The orientation of walls to the flow direction is another el-ement of exposure that affects the normal pressure exerted on walls. In several scenarios, perpendicular walls are subjected to higher dynamic pressures and lower depths than parallel walls. However, this effect appears to be conditional to the rheology of the flow as the opposite is true for debris flow scenarios. These two effects demonstrate the importance of considering exposure elements separately to vulnerability.
0% 25% 50% 75% 100%
100 75 50 25
Loss fraction
100 75 50 25 Flow rate m3s−1
Newtonian Hyper concentrated Debris flow
100 75 50 25 Class
A0 A B
Figure 12.Building loss fraction for all flow scenarios where build-ings are assumed to have a brick width of 0.15 m.
lower flow rate hyperconcentrated and debris flow scenarios where some blocks are on the edge of inundation and there-fore subjected to much lower depth–pressure combinations. Slightly fewer building losses occur with larger brick widths (Fig. 13) as the larger section modulus results in a greater resistance to bending moments. However, most buildings are still destroyed in Newtonian and hyperconcentrated flow sce-narios. An exception to this is the 75 m3s−1Newtonian flow where the highest pressure on the East 1 block occurs early in the simulation when the surge depth is low, reducing the magnitude of hydrostatic pressure and lowering the size of the applied moment.
The building loss results indicate that class A0 build-ings are most vulnerable, with class A buildbuild-ings marginally stronger due to the roof support. Losses for type B buildings in this area are much lower; however, this appears to be more closely related to building exposure than structural strength as most type B buildings are in two blocks subjected to lower depth–pressure combinations for all scenarios. Overall, sim-ilarly to the observations in Jenkins et al. (2015), the data presented here suggest that building strength (i.e. the vulner-ability component) has a minimal effect on losses, and build-ing location (i.e. exposure) relative to flow rate and type (i.e. hazard) plays a much greater role.
7 Limitations and discussion
The losses shown in Figs. 12 and 13 are estimates based on several assumptions that, while necessary for the estimation of building loss, could limit the accuracy of results. Firstly, the depth–pressure curves are created using ultimate bending moments derived from a foreign standard and do not consider proportional losses, only assuming damage is complete for depths and pressures above the critical curve. Secondly, the flow scenarios modelled here are a subset of likely scenar-ios and do not replicate all damage-causing actions of lahar flow. Finally, the maximum total pressure was assumed to be the sum of hydrostatic and dynamic pressure and to occur when dynamic pressure was at its peak. These limitations are discussed and justified in this section to highlight areas of improvement necessary for robust, quantitative estimation of lahar damage and vulnerability.
Newtonian Hyper concentrated Debris flow
0 % 25 % 50 % 75 % 100 %
100 75 50 25
Loss fraction
100 75 50 25
Flow rate m3s−1
100 75 50 25
Class A0 A B
Figure 13.Building loss fraction for all flow scenarios where build-ings are assumed to have a brick width of 0.25 m.
7.1 Depth–pressure curves
The critical depth–pressure curve is the contour where the ratio of applied (pressure) moment equals the ultimate (fail-ure) moment of a given masonry wall. The calculation of ultimate bending moments followed an Australian standard (AS 3700–2011). Although bending moment calculations are similar for all national standards and material proper-ties from Arequipa were used as inputs, the standard in-herently assumes conformance to construction and design standards. This is demonstrated through the assumption of a minimum mortar strength of 0.2 MPa. Page (1996) sug-gests this strength can be achieved with correct mortar com-position and laying; however, lower strengths are possible if there is low conformance to design standards. The makeshift structures that characterise class A0 buildings are likely to have mortar bond strengths that are much lower than the im-plied minimum of 0.2 MPa. This mischaracterisation of mor-tar strengths for makeshift structures will result in an over-estimation of building strength and critical depth–pressure curves. Additionally, the depth–pressure curves assume a binary damage state, where failure is total when the ap-plied (pressure) moment equals the ultimate (failure) mo-ment. This neglects incremental damage states that require building repair (e.g. to doors or windows) and can cause a reduction in the overall building strength.
Both of these assumptions will result in an underestima-tion of loss if violated. Most of the flow scenarios caused depths and pressures that exceeded critical curves by a large margin and resulted in an almost total loss; conversely, flow scenarios that did not result in total or near-total losses usu-ally had depths and pressure values that were well below the critical curves. This suggests that these assumptions are not critical to the results shown here, but may be important to consider in other case study areas.
7.2 Flow scenarios
can cause building damage in Arequipa. The chosen flows have similar characteristics to observed lahars and lahar de-posits (Thouret et al., 2013) and are therefore reasonably rep-resentative of the lahar hazards expected in Arequipa.
However, damage caused by these hazards may not be rep-resentative as only the direct actions of hydrostatic and dy-namic pressure were considered in this study. While direct actions are regarded as the most important source of damage, they are also favoured in risk assessment due to the large-scale predictability of hydrostatic and dynamic forces (Kel-man and Spence, 2004). Damage is likely to also be caused by scour and large debris missiles within the flow (Jenkins et al., 2015). In particular, boulders are often carried by la-hars at the flow front (Iverson, 1997; Doyle et al., 2011) and can lead to significant damage (e.g. Zeng et al., 2015). How-ever, these actions are harder to predict and incorporate into large-scale loss analyses (Kelman and Spence, 2004). These unstudied actions are generally proportional to depth, pres-sure or velocity, indicating that there may be a relationship between the ratio of applied to ultimate moment and damage through other actions. Given that only direct actions are con-sidered in this study, the curves likely form an upper bound to complete damage, and depth–pressure combinations be-low the curve may still result in complete building damage through other mechanisms.
7.3 Pressure actions
Both hydrostatic and dynamic pressures were considered in bending moment calculations. Slower increases in depth, buildings with many openings and the location of buildings relative to the channel can also affect the equalisation of lahar depths and reduce the effect of hydrostatic pressure. How-ever, lahar depth would still be an important factor to con-sider in building damage estimation as it controls location of the bending moment and can cause damage through other actions (e.g. inundation damage, buoyancy, corrosion).
The applied depth at the time of maximum pressure was used here to create the depth–pressure combinations to de-termine building loss. This surge depth was not necessarily the maximum depth of the lahar during the simulation. Max-imum depths generally occurred at later times in the simu-lations when hydrostatic pressure may have equalised inside and outside buildings. This assumption of surge depth was valid for most cases, although the losses for the 75 m3s−1 Newtonian flows indicate that this approach can be too sim-plistic at times. The complexity of lahar flows within urban environments with intricate geometry and obstacles similar to the case study area means that broad generalisations and assumptions about flow dynamics, such as the assumption of a surge depth, are often limited in their validity.
7.4 Discussion
The combination of pressures applied to each block in the study area created bending moments that, with few excep-tions, were much higher than the maximum moment build-ings could withstand. The limitations identified in previ-ous sections generally overestimate building strength and resilience to lahars which would result in greater damage than predicted here. The estimated building losses (Figs. 12 and 13) therefore represent the minimum expected losses for each flow scenario with damage likely to be more severe due to additional damage actions (e.g. boulders impacting struc-tures) and the overestimation of building quality, particularly for class A0 buildings.
When inundated, blocks in this study area are subjected to depths and pressures higher than the strongest structural class buildings can withstand. Specific improvements to re-duce vulnerability, such as adding roof support and utilising reinforced frames comprised of equally spaced RC columns will increase the overall strength of buildings by reducing the slenderness ratio (Eq. A6). Wider masonry units (wall thick-ness) and stronger mortar joints will also increase the over-all building strength by increasing wover-all stiffness and there-fore resistance to bending moments. However, this increased structural strength appears to only reduce losses in very low flow rate scenarios where there is proportionally less inun-dation. This suggests that, while each component of risk has a role in determining overall building losses, the variability in individual losses appears to be predominantly caused by flow dynamics (i.e. lahar hazard) and building exposure (e.g. proportion of building types and orientation within blocks).
8 Conclusion
Development of fragility functions in the form of critical depth–pressure curves for building classes within Arequipa has helped to provide insight into possible building losses and their cause. Building vulnerability is largely controlled by social, cultural and institutional factors (Künzler et al., 2012), so the depth–pressure curves are necessarily specific to Arequipa building typologies. However, given sufficient data on building strength, depth–pressure curves can be gen-erated through the same approach as in Appendix A and used to quantify masonry building loss in terms of flow depth and pressure in other regions.
if retrofitting to improve structural strength was undertaken. This suggests that, in this study area at least, exposure and lahar hazard have a larger role in determining building loss than vulnerability.
Appendix A: Calculating ultimate bending moment and shear force
The ultimate bending moment (Mu)and ultimate shear force (Vu) are calculated using the following equations (Roos, 2003):
Mu=(ft+fd)wb 2
6 (A1)
Vu=fvwb, (A2)
whereftis the tensile strength of the masonry wall,fdis the design compressive stress acting on the wall,wis the width of the wall facing the flow andbis the thickness of the wall. The shear strength of the masonry wall (fv)is related to the tensile and compressive stress through (Roos, 2003)
fv=0.5ft+0.5fd. (A3) The tensile strength is assumed to be 0.2 MPa as, according to AS 3700–2011, the tensile strength should be no greater than this value without testing. The wall thickness,b, is be-tween 150 and 250 mm for terracotta bricks (Martelli, 2011) and is assumed to be similar for ignimbrite bricks observed in the study area. The design compressive stress, fd, can be determined by calculating the vertical forces (i.e. build-ing weight) actbuild-ing on the walls. This can be estimated from building properties such as number and weight of floors, weight of the masonry and building design (e.g. Roos, 2003). However, such detailed building data are lacking here and carries considerable uncertainty for a heterogeneous urban area with varied construction materials, building ages and de-signs such as Arequipa. Instead we use the design compres-sive capacity (fo), specified in AS 3700–2011, to determine
the design compressive stress:
fo=φfcAb (A4)
fd=kfo, (A5)
where fc is the characteristic compressive strength of the masonry, φ is the capacity reduction factor,Abis the bed-ded area of the masonry (brick width×length) andk is a reduction factor based on the wall design. The characteris-tic compressive strength is determined using the unconfined compressive strength tests of Martelli (2011) on building ma-terials sourced from Arequipa. Presuming the mortar is of relatively low quality (M2), the characteristic compressive strengths (according to AS 3700–2011) are 3.8 MPa for ig-nimbrite masonry and between 3.5 and 4.54 MPa for terra-cotta masonry. The slenderness reduction factor,k, describes the susceptibility to buckling. Following AS 3700–2011, this factor is calculated as
k=0.67−0.02(Srs−14) (A6) for buildings with a reinforced concrete roof or floor (i.e. ty-pologies 3–6C), and
k=0.67−0.025(Srs−10) (A7)
for buildings with other roof or floor supports (typologies 1– 2). This factor requires a calculation of the slenderness ratio, Srs:
Srs=avH ktb
, (A8)
The Supplement related to this article is available online at doi:10.5194/nhess-17-703-2017-supplement.
Competing interests. The authors declare that they have no conflict of interest.
Acknowledgements. The authors would like to thank the Civil Defence office in Arequipa (Instituto Nacional de Defensa Civil INDECI), in particular the Regional office (A. Arguedas) and the Provincial/City office (J. Vasquez) for support during field work as well as the students of the department of geology of the University Nacional San Aguistin in Arequipa. J.-C. Thouret’s work in Arequipa has been supported by the Labex CLERVOLC (contribution number 235), the PICS CNRS programme and the French Embassy in Lima.
Edited by: G. Macedonio
Reviewed by: two anonymous referees
References
Auker, M., Sparks, R., Siebert, L., Crosweller, H., and Ewert, J.: A statistical analysis of the global historical volcanic fatalities record, J. Appl. Volcanol., 2, 1–24, doi:10.1186/2191-5040-2-2, 2013.
Bagnold, R. A.: Experiments on a gravity-free dispersion of large solid spheres in a Newtonian fluid under shear, P. Roy. Soc. Lond. A Mat., 225, 49–63, doi:10.1098/rspa.1954.0186, 1954. Cleary, P. W. and Prakash, M.: Discrete–element modelling and
smoothed particle hydrodynamics: potential in the environ-mental sciences, Philos. T. Roy. Soc. S A, 362, 2003–2030, doi:10.1098/rsta.2004.1428, 2004.
Cleary, P. W., Prakash, M., Mead, S., Tang, X., Wang, H., and Ouyang, S.: Dynamic simulation of dam-break scenarios for risk analysis and disaster management, International Journal of Im-age and Data Fusion, 3, 333–363, 2012.
Cleary, P., Prakash, M., Mead, S., Lemiale, V., Robinson, G., Ye, F., Ouyang, S., and Tang, X.: A scenario-based risk framework for determining consequences of different failure modes of earth dams, Nat. Hazards, 75, 1489–1530, doi:10.1007/s11069-014-1379-x, 2015.
Custer, R. and Nishijima, K.: Flood vulnerability assessment of res-idential buildings by explicit damage process modelling, Nat. Hazards, 78, 461–496, doi:10.1007/s11069-015-1725-7, 2015. de Bélizal, E., Lavigne, F., Hadmoko, D. S., Degeai, J.-P., Dipayana,
G. A., Mutaqin, B. W., Marfai, M. A., Coquet, M., Mauff, B. L., Robin, A.-K., Vidal, C., Cholik, N., and Aisyah, N.: Rain-triggered lahars following the 2010 eruption of Merapi volcano, Indonesia: A major risk, J. Volcanol. Geoth. Res., 261, 330–347, doi:10.1016/j.jvolgeores.2013.01.010, 2013.
Di Baldassarre, G. and Montanari, A.: Uncertainty in river discharge observations: a quantitative analysis, Hydrol. Earth Syst. Sci., 13, 913–921, doi:10.5194/hess-13-913-2009, 2009.
Doyle, E. E., Cronin, S. J., and Thouret, J. C.: Defining conditions for bulking and debulking in lahars, Geol. Soc. Am. Bull., 123, 1234–1246, doi:10.1130/B30227.1, 2011.
Ettinger, S., Mounaud, L., Magill, C., Yao-Lafourcade, A.-F., Thouret, J.-C., Manville, V., Negulescu, C., Zuccaro, G., De Gre-gorio, D., Nardone, S., Uchuchoque, J. A. L., Arguedas, A., Macedo, L., and Manrique Llerena, N.: Building vulnerability to hydro-geomorphic hazards: Estimating damage probability from qualitative vulnerability assessment using logistic regression, J. Hydrol., 541, 563–581, doi:10.1016/j.jhydrol.2015.04.017, 2015.
Galderisi, A., Bonadonna, C., Delmonaco, G., Ferrara, F., Menoni, S., Ceudech, A., Biass, S., Frischknecht, C., Manzella, I., Min-ucci, G., and Gregg, C.: Vulnerability Assessment and Risk Mit-igation: The Case of Vulcano Island, Italy, in: Landslide Science and Practice, edited by: Margottini, C., Canuti, P., and Sassa, K., Springer Berlin Heidelberg, 55–64, 2013.
Govier, G., Shook, C., and Lilge, E.: The rheological properties of water suspensions of finely subdivided magnetite, galena and fer-rosilicon, Trans. Can. IMM, 60, 147–154, 1957.
Iverson, R. M.: The physics of debris flows, Rev. Geophys., 35, 245–296, doi:10.1029/97RG00426, 1997.
Iverson, R. M., Schilling, S. P., and Vallance, J. W.: Ob-jective delineation of lahar-inundation hazard zones, Geol. Soc. Am. Bull., 110, 972–984, doi:10.1130/0016-7606(1998)110<0972:odolih>2.3.co;2, 1998.
Jan, C.-D. and Shen, H.: Review dynamic modeling of debris flows, in: Recent Developments on Debris Flows, edited by: Armanini, A. and Michiue, M., Lecture Notes in Earth Sciences, Springer Berlin Heidelberg, 93–116, 1997.
Jenkins, S., Phillips, J., Price, R., Feloy, K., Baxter, P., Hadmoko, D., and de Bélizal, E.: Developing building-damage scales for lahars: application to Merapi volcano, Indonesia, B. Volcanol., 77, 1–17, doi:10.1007/s00445-015-0961-8, 2015.
Julien, P. and Lan, Y.: Rheology of Hyperconcentrations, J. Hy-draul. Eng.-ASCE, 117, 346–353, doi:10.1061/(ASCE)0733-9429(1991)117:3(346), 1991.
Kelman, I. and Spence, R.: An overview of flood actions on buildings, Eng. Geol., 73, 297–309, doi:10.1016/j.enggeo.2004.01.010, 2004.
Künzler, M., Huggel, C., and Ramírez, J. M.: A risk analysis for floods and lahars: case study in the Cordillera Central of Colom-bia, Nat. Hazards, 64, 767–796, doi:10.1007/s11069-012-0271-9, 2012.
Lavigne, F.: Lahar hazard micro-zonation and risk assess-ment in Yogyakarta city, Indonesia, GeoJournal, 49, 173–183, doi:10.1023/A:1007035612681, 1999.
Manville, V., Major, J. J., and Fagents, S. A.: Modeling lahar behaviour and hazards, in: Modeling volcanic processes: the physics and mathematics of volcanism, edited by: Fagents, S. A., Gregg, T. K. P., and Lopes, R. M. C., Cambridge University Press, Cambridge, 300–330, 2013.
Martelli, K.: The physical vulnerability of urban areas facing the threat of inundation from lahars and flash floods: application to the case study of Arequipa, Peru, Université Blaise Pascal-Clermont-Ferrand II, 2011.
Mead, S.: Lahar hazard and vulnerability: Source code and data, doi:10.5281/zenodo.155144, 2016.
Den-zer, R., Argent, R., Schimak, G., and Hˇrebíˇcek, J., IFIP Advances in Information and Communication Technology, Springer Inter-national Publishing, 321–332, 2015.
Minatti, L. and Paris, E.: A SPH model for the simulation of free surface granular flows in a dense regime, Appl. Math. Model., 39, 363–382, doi:10.1016/j.apm.2014.05.034, 2015.
Mitsoulis, E.: Flows of viscoplastic materials: models and compu-tations, Rheology Reviews, 2007, 135–178, 2007.
O’Brien, J., Julien, P., and Fullerton, W.: Two-Water Flood and Mudflow Simulation, J. Hydraul. Eng.-ASCE, 119, 244–261, doi:10.1061/(ASCE)0733-9429(1993)119:2(244), 1993. Page, A. W.: Unreinforced masonry structures – an Australian
overview, Bulletin of the New Zealand national society for earth-quake engineering, 29, 242–255, 1996.
Papanastasiou, T. C.: Flows of Materials with Yield, J. Rheol., 31, 385–404, doi:10.1122/1.549926, 1987.
Patra, A. K., Bauer, A. C., Nichita, C. C., Pitman, E. B., Sheri-dan, M. F., Bursik, M., Rupp, B., Webber, A., Stinton, A. J., Namikawa, L. M., and Renschler, C. S.: Parallel adaptive numer-ical simulation of dry avalanches over natural terrain, J. Volcanol. Geoth. Res., 139, 1–21, doi:10.1016/j.jvolgeores.2004.06.014, 2005.
Pierson, T. C., Major, J. J., Amigo, Á., and Moreno, H.: Acute sed-imentation response to rainfall following the explosive phase of the 2008–2009 eruption of Chaitén volcano, Chile, B. Volcanol., 75, 1–17, doi:10.1007/s00445-013-0723-4, 2013.
Pitman, E. B. and Le, L.: A two-fluid model for avalanche and de-bris flows, Philos. T. R. Soc. A, 363, 1573–1601, 2005. Prakash, M., Rothauge, K., and Cleary, P. W.: Modelling the impact
of dam failure scenarios on flood inundation using SPH, Appl. Math. Model., 38, 5515–5534, doi:10.1016/j.apm.2014.03.011, 2014.
Roos, W.: Damage to buildings, Delft Cluster, report DC1-233-9, 45 pp., 2003.
Sandri, L., Thouret, J.-C., Constantinescu, R., Biass, S., and Tonini, R.: Long-term multi-hazard assessment for El Misti volcano (Peru), B. Volcanol., 76, 1–26, doi:10.1007/s00445-013-0771-9, 2014.
Thouret, J.-C., Enjolras, G., Martelli, K., Santoni, O., Luque, J. A., Nagata, M., Arguedas, A., and Macedo, L.: Combining criteria for delineating lahar- and flash-flood-prone hazard and risk zones for the city of Arequipa, Peru, Nat. Hazards Earth Syst. Sci., 13, 339–360, doi:10.5194/nhess-13-339-2013, 2013.
Thouret, J.-C., Ettinger, S., Guitton, M., Santoni, O., Magill, C., Martelli, K., Zuccaro, G., Revilla, V., Charca, J., and Arguedas, A.: Assessing physical vulnerability in large cities exposed to flash floods and debris flows: the case of Arequipa (Peru), Nat. Hazards, 73, 1771–1815, doi:10.1007/s11069-014-1172-x, 2014. Toyos, G., Gunasekera, R., Zanchetta, G., Oppenheimer, C., Sulpizio, R., Favalli, M., and Pareschi, M. T.: GIS-assisted mod-elling for debris flow hazard assessment based on the events of May 1998 in the area of Sarno, Southern Italy: II. Velocity and dynamic pressure, Earth Surf. Proc. Land., 33, 1693–1708, doi:10.1002/esp.1640, 2008.
Vallance, J. W. and Iverson, R. M.: Lahars and Their Deposits, in: The Encyclopedia of Volcanoes, Second Edition, Sigurdsson, Haraldur, Academic Press, Amsterdam, 649–664, 2015. van Westen, C. J., van Asch, T. W. J., and Soeters, R.: Landslide
hazard and risk zonation – why is it still so difficult?, Bull. Eng. Geol. Environ., 65, 167–184, doi:10.1007/s10064-005-0023-0, 2006.
Vargas Franco, R., Thouret, J., Delaite, G., Van Westen, C., Sheri-dan, M., Siebe, C., Mariño, J., Souriot, T., and Stinton, A.: Map-ping and assessing volcanic and flood hazards and risks, with emphasis on lahars, in Arequipa, Peru, Geol. Soc. Spec. Pub., 464, 265–280, doi:10.1130/2010.2464(13), 2010.
Varnes, D. J.: Landslide hazard zonation: a review of principles and practice, Nat. Hazards, 3, UNESCO, Paris, France, 63 pp., 1984. Zanchetta, G., Sulpizio, R., Pareschi, M. T., Leoni, F. M., and San-tacroce, R.: Characteristics of May 5–6, 1998 volcaniclastic de-bris flows in the Sarno area (Campania, southern Italy): rela-tionships to structural damage and hazard zonation, J. Volcanol. Geoth. Res., 133, 377–393, doi:10.1016/S0377-0273(03)00409-8, 2004.
Zeng, C., Cui, P., Su, Z., Lei, Y., and Chen, R.: Failure modes of reinforced concrete columns of buildings under debris flow im-pact, Landslides, 12, 561–571, doi:10.1007/s10346-014-0490-0, 2015.