IJEDR1703138
International Journal of Engineering Development and Research (
www.ijedr.org
)
986
Comparative Stability Analysis of Harder Grade
Bitumen (VG-30 & VG-40) By Marshall Mix
Design Method on DBM-I
1
Ankur Gupta,
2Dr. Sheetal Agarwal
1 Research Scholar, 2 Associate Professor 1 Civil Engineering Department,
1 Kautilya Institute of Technology & Engineering, Jaipur, India
________________________________________________________________________________________________________ Abstract—Generally in India, the important highways are made up by Dense Bituminous Macadam (DBM) or Bitumen Concrete (BC). Bitumen mix design can be done by Marshall Mix Design Method; is a balancing method to adjust the proportions of various aggregate sizes and bitumen content. The present research focused on the use of harder grade bitumen VG-30 and VG-40 for better performance under heavy traffic load conditions. Marshall Mix Design Method for dense bituminous macadam (DBM-I) was adopted to find the optimum binder content.
It was observed that the trend of stability value was increased with increasing bitumen content up to a maximum after which the stability decreases. Stability values were achieved highest for VG-40 grade bitumen than VG-30 grade bitumen at 4.50% of bitumen content. Further, as the OBC was 4.25% for VG-30 and VG-40 respectively, the Marshall Stability for VG-40 grade was also high as compared to VG-30 grade bitumen. It indicated that as the air voids percentage were 4.020% for VG-30 and 4.507% for VG-40 grade respectively.
Index Terms— Viscosity Grade (VG), Marshal Mix Design, Optimum Binder Content (OBC), Dense Bitumen Macadam (DBM).
________________________________________________________________________________________________________
1.INTRODUCTION
In India rapid growth of urbanization is fueled by development of industrial and service sector which resulted in rapid growth of road vehicles in limited road space, to withstand the high stress with minimum maintenance [1]. India is the second fastest growing automobile in the world [2]. Most of the Indian highways are covered by bitumen called flexible pavement having less initial investment and maintenance [3]. The important highways in India are built by dense bituminous macadam (DBM) or bituminous concrete (BC).
The DBM is a base course layer of flexible pavement used in road construction under heavy traffic load conditions [4]. Dense Bituminous Macadam (DBM) is a binder course used for roads under heavy traffic load. At the present time, the dense bituminous macadam (DBM) is specified for use as a base course and binder course. Two gradation of the DBM are used. Grading I has a nominal maximum aggregate size (NMAS) of 37.5 mm and grading 2 has a NMAS of 25 mm. In the previous research studies, Patel M., Patel V., Patel D.K., Mishra C.B. (2014) [1] Used viscosity grade 30 paving mix with innovative warm mix additive in suitable doses and tested to determine key properties on Marshall Mix Design as per the provision of code practice. The test a result of VG 30 concrete mix with 5.5% optimum bitumen content was taken into consideration for mix design and it was found that it was seen that doses of 2% by weight of asphalt was also acceptable for road construction. Sarang G. (2014) [5] the research was carried out on Viscosity Graded (VG 30) bitumen and a chemical named Zycosoil was used as a stabilizing additive. Tomar R., Jain R.K. and Kostha MK (2013) [6] used bitumen 60/70 for Marshall Mix Design. It was observed that the blend of aggregates and bitumen. Bituminous mixes containing brick dust and silica fume as fillers were having Marshall Properties almost nearly same as those of conventional fillers such as cement and lime. Sangita et al. (2011) [7] studied the effect of waste polymer modifier (nitrile rubber and polythene). Various test results on 60/70 bitumen and aggregate satisfied the specified limits. It was observed that Marshall Stability and retained stability tests confirmed the optimum WPM content to be 8% the Waste Modified Polymer Binder (WPMB) mix containing 8% Waste Polymer Modifier (WPM) showed significant improvements in various properties of the bituminous concrete mixture. Shobhan and Zakaria (2001) [8] Used Crumb rubber modified bitumen, blended at specified temperatures. Marshall mix design was carried out by changing the modified bitumen content at constant optimum rubber content and subsequent tests have been performed to determine the different mix design characteristics and for conventional bitumen (60/70) also. This had resulted in much improved characteristics when compared with straight run bitumen and that too at reduced optimum modified binder content (5.67%). Sumit G. Dhundalwar, et al, (2017) [9] Compared the properties of the modified bitumen with ordinary bitumen. It was observed that the penetration and ductility values of the modified bitumen decreased with the increase in proportion of the plastic additive, up to 12% by weight.
IJEDR1703138
International Journal of Engineering Development and Research (
www.ijedr.org
)
987
2.OBJECTIVES OF PRESENT STUDY
To study the physical properties of aggregates and harder grade bitumen (VG-30 and VG-40) for Dense Bituminous Macadam (DBM) Grade-I as per MoRTH specifications.
To evaluate the engineering properties including Marshall Stability, Marshall Flow, Marshall Quotient, Density, Voids in Mix and Voids Filled with Bitumen.
Determine the Optimum Binder Content (OBC) for the Marshall Mix with bitumen viscosity grade VG-30 and VG-40.
To study and analysis the effect of superior grade bitumen on pavement performance.
3.MATERIALS AND METHODS
Materials
Coarse Aggregate:
The course aggregate was collected from IRCON crusher source; near Kolayat, Bikaner District. Physical properties of coarse aggregate were tested as per MoRTH guidelines, given in Table 1.
Table 1: Physical Properties for Coarse Aggregate
S. No. Description of Test Test Results Acceptable Limits as per MoRTH
Table- 500-7
1. Aggregate Impact Value 22.22% 27 % Maximum
2. Los Angeles Abrasion Value 22.50% 30 to 35 % Maximum
3. Crushing Value 23.38% 45 % Maximum
4. Combined Flakiness and Elongation indices
30.27% 35 % Maximum
5. Water Absorption 1.47% 2 % Maximum
Fine Aggregate:
The fine aggregate was collected from IRCON crusher source; near Kolayat, Bikaner District. Physical properties of fine aggregate were tested as per IS: 383. The physical properties of fine aggregates are given in Table 2.
Table 2: Physical Properties for Fine Aggregate
S. No. Description of Test Test Results Acceptable Limits as per
IS:383
1. Grain Size Analysis Separate Analysis is done 27 % Maximum
2. Water Absorption 1.55 2 (Max.)
3. Specific Gravity 2.67 NIL
Filler:
Stone dust is used as filler for the present study. The source was IRCON crusher near Kolayat, Bikaner District. In the present study the filler materials was free from organic. Impurities and had a plasticity index less than 4.
Bitumen:
Bitumen grade VG-30 and VG-40 is used as binder content for the present study. The source of bitumen was Indian Oil Corporation limited, Mathura refinery. Physical properties of bitumen grade VG-30 and VG-40 are given as below in Table 3.
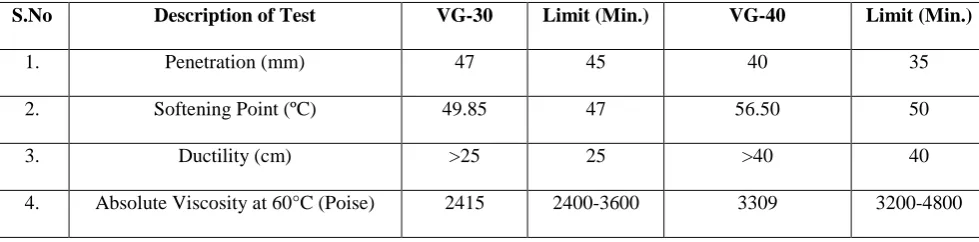
Table 3: Physical Properties of Bitumen Grade VG-30 & VG-40 as Per IS: 73
S.No Description of Test VG-30 Limit (Min.) VG-40 Limit (Min.)
1. Penetration (mm) 47 45 40 35
2. Softening Point (ºC) 49.85 47 56.50 50
3. Ductility (cm) >25 25 >40 40
IJEDR1703138
International Journal of Engineering Development and Research (
www.ijedr.org
)
988
5. Specific Gravity 1.023 1.031
Mix Design of DBM
The mix proportion was carried out as per the MoRTH specification. The aggregate gradation is given in Table 4. Table 4: Batch Mix as per JMF
S.No Material Material JMF
Weight Percentage of all Materials in one
batch mix
Quantity of all materials as per
JMF in Kg
1 40mm 19% 18.193% 181.925
2 20mm 18% 17.235% 172.350
3 10mm 19% 18.193% 181.925
4 Dust 40.00% 38.300% 383.000
5 Filler 4.00% 3.830% 38.300
6 Bitumen 4.250% 42.500
100.00% 100% 1000.000
4.RESULTS AND DISCUSSIONS
Determination of Marshall Stability and Flow Value for VG-30 and VG-40
Table 5: Marshall Properties of Bituminous Concrete Mix Prepared Using VG-30
S.No Bitumen
% Gb Gt
Vv % Vb % VMA % VFB % Marshal Stability kn
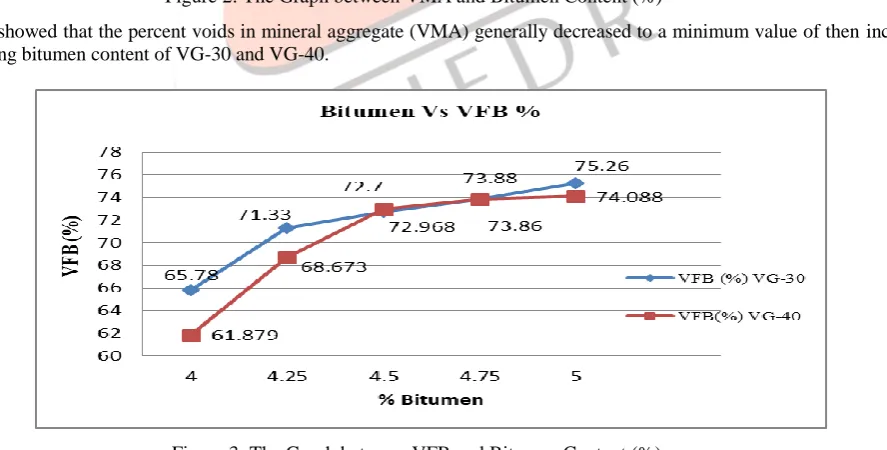
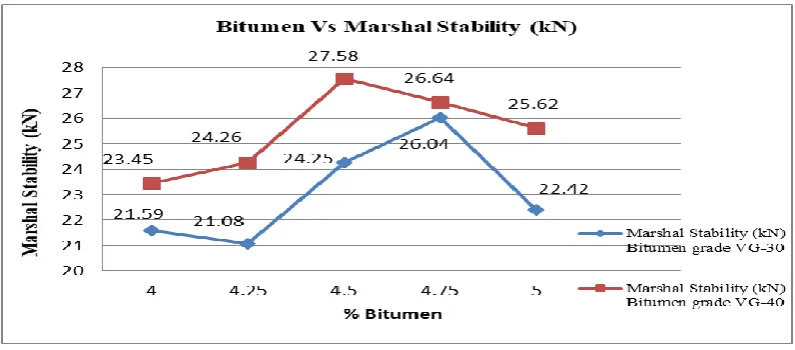
1. 4.00 2.396 2.519 4.874 9.369 14.243 65.78 21.59
2. 4.25 2.408 2.509 4.020 10.00 14.025 71.33 21.08
3. 4.50 2.401 2.500 3.966 10.561 14.527 72.70 24.25
4. 4.75 2.392 2.490 3.931 11.107 15.038 73.86 26.04
5. 5.00 2.386 2.481 3.833 11.661 15.494 75.26 22.42
Table 5 showed the test results of different binder content i.e. 4.25%, 4.50%, 4.75% and 5.00 % for VG-30 grade bitumen. Table 6: Marshall Properties of Bituminous Concrete Mix Prepared Using VG-40
S.No Bitumen
% Gb Gt
Vv % Vb % VMA % VFB % Marshal Stability kn
1. 4.00 2.377 2.520 5.681 9.221 14.903 61.879 23.45
2. 4.25 2.397 2.510 4.507 9.880 14.388 68.673 24.26
3. 4.50 2.403 2.500 3.885 10.488 14.373 72.968 27.58
4. 4.75 2.393 2.490 3.898 11.025 14.922 73.880 26.64
5. 5.00 2.380 2.480 4.037 11.542 15.578 74.088 25.62
Further Table 6 showed the test results of different binder content i.e. 4.25%, 4.50%, 4.75% and 5.00 % for VG-40 grade bitumen. Results showed that the optimum binder content was 4.25% for VG-30 and VG-40 grade bitumen because at this percentage the bitumen concrete mix full fills all the mix requirements as per MoRTH (5th revision) specifications.
Determination of Marshall Stability and Flow Value for VG-30 and VG-40
IJEDR1703138
International Journal of Engineering Development and Research (
www.ijedr.org
)
989
Figure 1: The Graph between of Air Voids Percentage and Bitumen Content (%)It was found that the percent of air voids (Va) steadily decreased with increasing bitumen content and at bitumen content 4.5 to 4.75, flow value of VG-30 and VG-40 were approximately same and then after slightly increased flow value with increasing bitumen content.
Figure 2: The Graph between VMA and Bitumen Content (%)
Figure 2 showed that the percent voids in mineral aggregate (VMA) generally decreased to a minimum value of then increases with increasing bitumen content of VG-30 and VG-40.
Figure 3: The Graph between VFB and Bitumen Content (%)
IJEDR1703138
International Journal of Engineering Development and Research (
www.ijedr.org
)
990
Figure 4: The Graph between Marshal Stability and Bitumen Content (%)Figure 4 showed the Graph between Marshal Stability values (kN) and Bitumen Grade (VG-30 & VG-40).
It was observed that the trend of stability value was increased with increasing bitumen content up to a maximum after which the stability decreases. Stability values were achieved highest for VG-40 grade bitumen than VG-30 grade bitumen at 4.50% of bitumen content. Further, as the OBC was 4.25% for VG-30 and VG-40 respectively, the Marshall Stability for VG-40 grade was also high as compared to VG-30 grade bitumen.
5.CONCLUSION
Table 1 and 2 showed that the aggregates were satisfying the requirements as per MoRTH (Vth Revision).
Table 3 showed that the bitumen grades VG-30 & VG-40 were satisfying the test results as per IS 73: 2006 and IRC: SP -53: 2010.
The graphs showed the volumetric and mechanical properties of Marshall specimens, obtained at varying binder contents for VG-30 & VG-40 indicated that the optimum binder content (OBC) of 4.25% (by weight of aggregates) satisfying the criteria’s referred in MoRTH specifications.
It was observed that the Marshall Stability values was increased with increasing bitumen content and were achieved higher value for VG-40 grade bitumen than VG- 30 grade bitumen, at VG-30 grade bitumen at 4.50% of bitumen content. This showed that the Marshall stability was increased by approx. 5% with VG-40 binder grade than VG-30 grade.
REFERENCES
[1] Patel M., Patel V., Patel D.K., and Mishra C.B. “Evaluating Properties of VG-30 Paving Mix with and Without Warm Mix Additive”, International Journal of Innovative Research in Science, Engineering and Technology, vol. no. - 3, pt.-13893-13898, 2014.
[2] Teppala B.R., Prof. Mishra C.B., Sinha A., and Kumar D. “Experimental Assessment of Properties of Crumb Rubber Modified Bitumen Mix (CRMB 55) With and Without Application of Nanotechnology Additive”, International Journal of Innovative Research in Science, Engineering and Technology, vol. no. – 3, pt. - 16490-16494, 2014.
[3] Joshi D. B., and Patel A.K. “Optimum Bitumen Content by Marshall Mix Design for DBM”, the Association for Science Engineer, vol. no. – 2, 2013.
[4] Jain S., Joshi Y.P., and Goliya S.S. “Design of Rigid and Flexible Pavement by Various Methods & Their Cost Analysis of Each Method”, International Journal of Engineering Research and Applications, vol. no. - 3, 2013.
[5] Sarang G., Mehnaz E and Shankar A.U.R. “Comparison of Stone Matrix Asphalt Mixtures Prepared in Marshall Compaction and Gyratory Compactor”, International Journal of Civil Engineering Research, vol. no. – 5, 2014.
[6] Tomar R., Jain R.K. and Kostha M.K. “Effect of Fillers on Bituminous Paving Mixes”, International Journal of Engineering and Technology, vol. no. – 2, 2013.
[7] Sangita, Khan T.A., Sabina and Sharma D.K. “Effect of Waste Polymer Modifier on the Properties of Bituminous Concrete Mixes Construction and Building Materials”, vol. no. – 25, pt. - 3841-3848, 2011.
[8] Sobhan M.A. and Zakaria M. “Experimental behavior of bituminous macadam mixes with brick aggregate”, The Journal of Civil Engineering, vol. no. - 1, pt. - 115-123, 2001.