Multi-response Optimization of Surface Roughness
Roundness and MRR in Precision Turn-Boring of
15-5PH Stainless Steel Using Taguchi-Grey Approach
Shen-Jenn Hwang1, Yi-Hung Tsai 2
1 Department of Mechanical Design Engineering, 2 Department of Mechanical and
Electro-Mechanical Engineering, National Formosa University
E-mail: 1[email protected], 2 [email protected]
Abstract: The present study propose an innovative turn-boring operation method and focuses on finding optimal turn-boring process parameters for 15-5PH Stainless steel by considering multiple performance characteristics using Taguchi orthogonal array with the grey relational analysis, the effect of machining variables such as concentration of cutting fluid , temperature of cutting fluid , feed rate, depth of cut and cutting speed are optimized with considerations of multiple performance characteristics namely surface roughness, roundness error and material removal rate, the optimal values were found out from the Grey relational grade. The result of the Analysis of Variances (ANOVA) is shown that the most significant factor is cutting speed, followed by feed rate, concentration of cutting fluid, radial depth of cut and temperature of cutting fluid. Finally, confirmation tests were carried out to make a comparison between the experimental results and developed model. Experimental results have shown that machining performance in the turn-boring process can be improved effectively through this approach.
Keywords: surface roughness; roundness; MRR; turn-boring; optimization; Taguchi-grey.
1. Introduction
Fine boring is one of the important machining aerospace and automotive parts that have to be efficient and high accuracy. It is an important task to select cutting parameters for achieving superior cutting performance. The evolution of boring machining operation properties using different parameters is a complex phenomenon. There are many factors such as cutting speed, depth of cut, feed rate, insert material etc affecting the performance of boring machining operation resulting in different surface quality and accuracy. Venkatarao et al. [1] studied the effect of various input cutting parameters such as cutting speed, feed rate, and tool nose radius on tool life in boring for AISI 1040steel by
analyzing surface roughness, amplitude of work piece vibration and volume of metal removed. Venkatarao et al. [2] using an artificial neural network to predict the cutting tool wear, surface roughness and vibration of the work piece in boring of AISI 316 steel. Chun et al. [3] using the response surface methodology to study the effect of the overhang, feed rate, and the depth of cut on machining errors in boring for AISI4140 steel. They found the depth of cut is the most significant parameters affecting the dimensional accuracy.
15-5 PH stainless steels are widely used as structural components in applications such as aircraft and power plants industries [4]. It is show excellent mechanical properties, high strength and hardness, good corrosion resistance and low distortion. But, their machinability is more difficult compared to other alloy steels due to low thermal conductivity, high built-up edge (BUE) formation tendency and high deformation hardening.
With the development of technology in aerospace and automobile industry, conventional machining operations can be not enough to satisfy machining quality, productivity and cost demands. To improve processing quality and varieties of metal compound machining methods has been developed. At this point, an innovative process such as turn-milling is an effective way of machine difficult-to-cut materials as a kind of compound machining. Schulz [5] proposed two different turn-milling operations, namely coaxial and orthogonal, and carried out experimental trials to identify cutting conditions (i.e. feed, speeds, depth of cut) that result in a good surface. He has further concluded that short chips are formed by intermittent cutting process. Choudhury and Mangrulkar [6] carried out a series of orthogonal turn-milling experiments and states that surface finish quality obtained by orthogonal turn-milling will be about 10 times better than those obtained by conventional turning.
Base on turn-milling method idea, we also proposed a new innovative turn-boring technology of both the boring tool cutter and workpiece rotation simultaneously. Due to the direction of rotation of the tool and the workpiece is reversed, resultant from intermittent cuts and chip breaking. It keeps low thermal stresses, lowers cutting forces and has useful material removal rates. It also can offer increased productivity for difficult-to-machine materials. So far, this compound processing machining method has not yet seen any study reports.
multi-objective in various fields of manufacturing. It’s is an effective approach to solve the multi-objective optimization. Recently, some researchers have effectively used this method for solving the intricate interrelationships between the multiple objectives in engineering manufacture with multiple responses. Kuram and Ozcelik [8] employed the Taguchi method and the Grey Relational Analysis to multi-optimize with multiple response outputs in the micro-milling. They studied the effects of spindle speed, feed per tooth and depth of cut on tool wear, force, and surface roughness. Yang et al. [9] applied the Taguchi method and the GRA to optimize the milling parameters such as the cutting speed, the feed rate, and the depth of cut for simultaneous optimization of the energy, production rate and cutting quality. Dabade [10] conducted the multi-objective process optimization with Grey Relational Analysis to develop the surface integrity in turning of Al/SiCp metal matrix composites. Hwang et al. [10] investigated and optimized the high speed end milling of SKD61 Tool Steel using Taguchi methods with grey relational analysis. Recently, this method attracts more and more widely applied on mechanical machining and tribological engineering, including drilling [12-14], turning [15-16], milling [17-18], wire electrical discharge machining [19-20], and tribology [21].
As mentioned above, The GRA is an effective approach to solve the multi-objective optimization. Therefore, this study applied a Taguchi L27 orthogonal array to plan the
experiments. The experimental design was organized for five parameters including cutting fluid concentration, cutting fluid temperature, feed rate, depth of cut and relative cutting speed of turn-boring with three levels for each factor. This study presented the multi-response optimization of turn-boring parameters to simultaneously minimize the surface roughness, roundness and maximize material remove rate using Taguchi based GRA in turn-boring of 15-5 PH stainless steel.
2. Experimental procedure
the roundness is measured with Coordinate Measuring Machine (DEA GLOBAL Silver SF 12.15.10).The material removal rate is calculated by using Eq. (1), as showed in Fig 3.
MRR = ( − )
4 (1) where n = 1000 / , MRR: Material Removal Rate. ap is Axial length of cut. D2 is Finished Diameter. D1 is Initial diameter. n is machine speed in revolutions/minute. fr is machine feed rate.
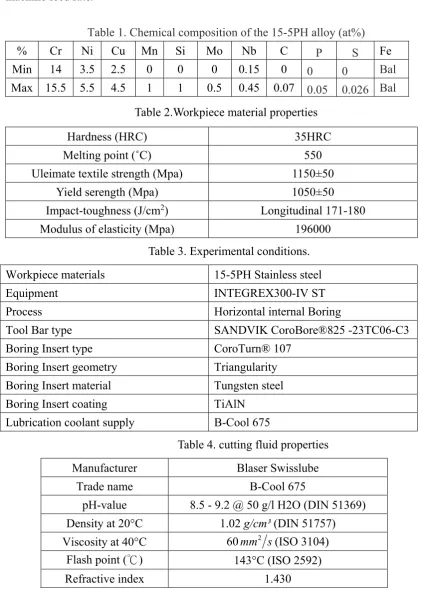
Table 1. Chemical composition of the 15-5PH alloy (at%)
% Cr Ni Cu Mn Si Mo Nb C P S Fe
Min 14 3.5 2.5 0 0 0 0.15 0 0 0 Bal
Max 15.5 5.5 4.5 1 1 0.5 0.45 0.07 0.05 0.026 Bal
Table 2.Workpiece material properties
Hardness (HRC) 35HRC
Melting point (˚C) 550
Uleimate textile strength (Mpa) 1150±50
Yield serength (Mpa) 1050±50
Impact-toughness (J/cm2) Longitudinal 171-180
Modulus of elasticity (Mpa) 196000
Table 3. Experimental conditions.
Workpiece materials 15-5PH Stainless steel
Equipment INTEGREX300-IV ST
Process Horizontal internal Boring
Tool Bar type SANDVIK CoroBore®825 -23TC06-C3
Boring Insert type CoroTurn® 107
Boring Insert geometry Triangularity
Boring Insert material Tungsten steel
Boring Insert coating TiAlN
Lubrication coolant supply B-Cool 675
Table 4. cutting fluid properties
Manufacturer Blaser Swisslube
Trade name B-Cool 675
pH-value 8.5 - 9.2 @ 50 g/l H2O (DIN 51369)
Density at 20°C 1.02 g/cm³ (DIN 51757)
Viscosity at 40°C 60mm2 s(ISO 3104)
Flash point (℃) 143°C (ISO 2592)
Fig. 1. Schematic diagram of experimental set-up.
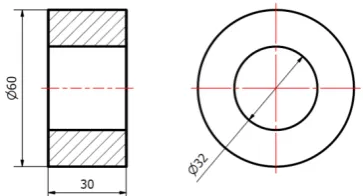
Fig. 2 Geometry and dimensions of the specimens
Fig. 3 Schematic diagram of material removal rate
Table 5. Turn-boring parameters and their levels.
Symbol Control parameters unit Level
1
Level 2
Level 3
A Concentration of
Cutting fluid % 15 20 25
B Temperature of
Cutting fluid ℃ 20 22 24
C Feed rate mm/rev 0.170 0.250 0.330
D Radial depth of cut mm 0.050 0.100 0.150
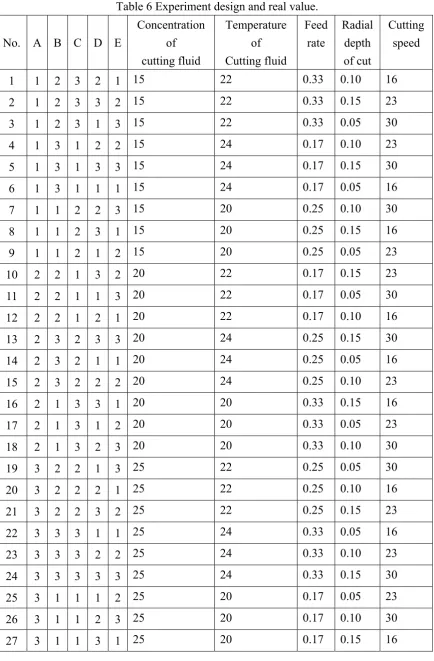
Table 6 Experiment design and real value.
No. A B C D E
Concentration of cutting fluid
Temperature of Cutting fluid
Feed rate
Radial depth of cut
Cutting speed
1 1 2 3 2 1 15 22 0.33 0.10 16
2 1 2 3 3 2 15 22 0.33 0.15 23
3 1 2 3 1 3 15 22 0.33 0.05 30
4 1 3 1 2 2 15 24 0.17 0.10 23
5 1 3 1 3 3 15 24 0.17 0.15 30
6 1 3 1 1 1 15 24 0.17 0.05 16
7 1 1 2 2 3 15 20 0.25 0.10 30
8 1 1 2 3 1 15 20 0.25 0.15 16
9 1 1 2 1 2 15 20 0.25 0.05 23
10 2 2 1 3 2 20 22 0.17 0.15 23
11 2 2 1 1 3 20 22 0.17 0.05 30
12 2 2 1 2 1 20 22 0.17 0.10 16
13 2 3 2 3 3 20 24 0.25 0.15 30
14 2 3 2 1 1 20 24 0.25 0.05 16
15 2 3 2 2 2 20 24 0.25 0.10 23
16 2 1 3 3 1 20 20 0.33 0.15 16
17 2 1 3 1 2 20 20 0.33 0.05 23
18 2 1 3 2 3 20 20 0.33 0.10 30
19 3 2 2 1 3 25 22 0.25 0.05 30
20 3 2 2 2 1 25 22 0.25 0.10 16
21 3 2 2 3 2 25 22 0.25 0.15 23
22 3 3 3 1 1 25 24 0.33 0.05 16
23 3 3 3 2 2 25 24 0.33 0.10 23
24 3 3 3 3 3 25 24 0.33 0.15 30
25 3 1 1 1 2 25 20 0.17 0.05 23
26 3 1 1 2 3 25 20 0.17 0.10 30
3. Results and discussions
Multi-response optimization with Grey relational analysis
Grey relational analysis is a statistical method to analyze the complex multi-response systems. Based on experimental data, the Grey relational analysis is utilized to convert the multi-response optimization into the single objective optimization of the grey relational grade. The aim of this study was to identify the optimal combination of turn-boring parameters that simultaneously minimize surface roughness, roundness and maximize the material removal rate in turn-boring of 15-5PH stainless steel. Steps of grey relational analysis are as follows:
3.1 Grey relational generation
The first step of grey relational analysis is to normalize the experimental data depending on the type of performance response. Ra, Er and MRR are to normalize in the range of zero to one. This is called grey relational normalization. In the present study, as surface roughness and roundness had to be minimized, the smaller-the-better model aims to obtain the minimum quality characteristics. MRR had to be maximized.
For the Lower-the-better criterion, the normalize data can be expressed as
∗( ) = max ( ( )) − ( ( ))
max (( ( )) − min ( ( )) (2)
For the Larger-the-better criterion, the normalize data can be expressed as
∗( ) = ( ) − min ( ( ))
max (( ( )) − min ( ( )) (3) where ∗( )is the value after grey relational generation (normalized value), and max ( )
and ( )are the largest and smallest values of ( ) for the kth response, respectively, k
being 1 for surface roughness and 2 for roundness and 3 for material removal rate. The processed data after grey relational generation was given in Table 7. The normalized values are ranged between zero and one. Larger normalized results mean to the better performance and the best normalized result should be equal to 1.
3.2grey relational coefficient
Grey relational coefficients denote the relationship between the ideal and the actual
experimental results. Grey relational coefficient ( ) can be calculated as the following:
( ) = Δ + Δ
Δ ( ) + Δ (4) 0 < ( ) ≤ 1
Here,Δ ( ) = ‖ ∗( ) − ∗( )‖, ∗( )is reference sequence and ∗( ) is comparability
is the maximum value; is the distinguishing coefficient( ∈[0, 1]) and is used to adjust the difference of the relational coefficient.
Generally, the distinguishing coefficient is assumed as 0.5 to fit the practical requirements and the grey relational coefficient calculated using Eq. (4) was given in Table 8.
3.3Calculate Grey Relational Grade (GRG)
The grey relational grade with Eq. (5) can be computed by averaging the grey relational coefficients to evaluate the multiple response as a single index as
= 1 ( ) (5)
Here, n is the number of performance characteristics. The highest grey relational grade corresponds to the experimental value closest to the ideal normalized value. Thus, higher grey relational grade shows that the corresponding parameter combination is closer to the optimal. According to Eq. (5), the GRG between the process parameters and the performance characteristics is calculated. Grey relational grade as shown in Table 8.
3.4. Optimal grey relational grade
Since higher GRGwas desirable, the larger-the-better S/N quality characteristic was used to obtain the optimal combination for multi-response optimization approach for higher GRG is defined as follows:
S = −10 log 1 1 (6)
In Eq. (6), yi is the ith measured experimental results in a run/row and n explains the
remarkable influence on the performance characteristics, while the temperature of cutting fluid exhibits the weakest effect.
3.5. Analysis of variance (ANOVA)
The multi objectives are converted into a single object with the help of grey relational analysis. The significant contribution of each input parameter on the responses in turn-boring parameters is studied by using analysis of variance. The results of the ANOVA are shown in Table 10. As in the ANOVA table of GRG, This indicates that the cutting speedis the most contributing factor.
3.6 Prediction of grey relation grade
After finding the suitable optimal parameters, it is necessary to predict the grey relational grade theoretically. The estimated grey relational grade of the optimal level of the design parameters combination can be calculated as:
= + ( − ) (5)
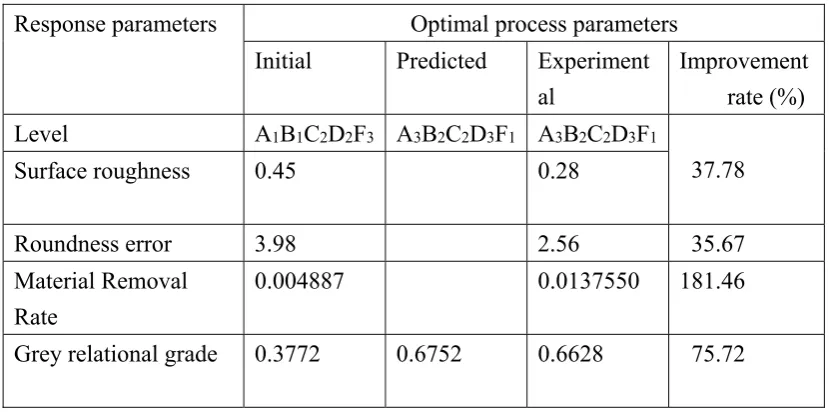
where is the GRG to predict the optimal machining parameters, is the total average GRG, is the average GRG at the optimal level, and k is the number of main design parameters that significantly affect the multiple performance characteristics. Table 11 shows the comparison results of the initial turn-boring and optimal turn-boring parameters.
3.7 Experimental validation
In the last step, the obtained results are conducted to verify the optimized solution. Table 11 compares the confirmation test results using the initial and optimal level combination of process parameters. It is obvious that machining with the optimum parametric combination would minimize Ra from 0.45µm to 0.28 µm, Er from 3.98µm to 2.56 µm and increase
MRR from 0.004887(mm3/min) to 0.0137550(mm3/min). It indicates that the GRA
algorithm can be used to improve the performance characteristics.
4. Conclusions
In this study, an innovative precision turn-boring has successfully demonstrated the
minimum surface roughness, roundness error and maximum MRR. From experimental studies performed in this research the following conclusions can be drawn.
1. The optimum parameters for multiple parameters optimization setting were found to be concentration of cutting fluid of 25%, temperature of cutting fluid of 22℃, feed rate of 0.250mm/rev, radial depth of cut of 0.150mm and cutting speed of 16 m/min.
2. It was observed through ANOVA that the cutting speed is the most influential control factor among the five turn-boring process parameters investigated in this study, when both minimization of surface roughness, roundness error and maximization of material remove rate is considered simultaneously.
3. The percentage improvement in GRG with the multiple responses was 75.72%. It is clearly shown that the performance indicators (surface roughness, roundness error and material remove rate) are significantly improved in the turn-boring 15-5PH stainless steel using the Taguchi-based grey rational analysis.
Table7 Normalized sequence after grey relational generation.
Expt. no
Ra ( )
Er ( )
MRR (mm3/min)
Normalized values
1 0.28 3.41 0.0120960 0.681818 0.318436 0.632604
2 0.37 2.83 0.0126307 0.477273 0.642458 0.665018
3 0.40 2.48 0.0032234 0.409091 0.837989 0.094744
4 0.16 3.73 0.0043348 0.954545 0.139665 0.162117
5 0.53 3.59 0.0049885 0.113636 0.217877 0.201745
6 0.14 2.37 0.0031135 1 0.899441 0.088081
7 0.45 3.98 0.0048873 0.295455 0 0.195610
8 0.33 3.15 0.0137550 0.568182 0.463687 0.733173
9 0.22 2.61 0.0031851 0.818182 0.765363 0.092422
10 0.47 2.36 0.0065067 0.25 0.905028 0.293779
11 0.42 3.68 0.0016605 0.363636 0.167598 0
12 0.19 3.01 0.0062313 0.886364 0.541899 0.277084
13 0.49 3.24 0.0073360 0.204545 0.413408 0.344051
14 0.20 2.27 0.0045786 0.863636 0.955307 0.176896
15 0.17 2.95 0.0063747 0.931818 0.575419 0.285777
16 0.32 2.83 0.0181566 0.590909 0.642458 1
17 0.38 2.84 0.0042044 0.454545 0.636872 0.154212
18 0.44 2.58 0.0064512 0.318182 0.782123 0.290414
19 0.39 2.19 0.0024419 0.431818 1 0.047369
20 0.15 3.26 0.0091637 0.977273 0.402235 0.454847
22 0.35 3.44 0.0060438 0.522727 0.301676 0.265717
23 0.40 2.69 0.0084146 0.409091 0.72067 0.409436
24 0.58 2.35 0.0096835 0 0.910615 0.486357
25 0.21 3.06 0.0021659 0.840909 0.513966 0.030638
26 0.38 2.66 0.0033234 0.454545 0.73743 0.100806
27 0.35 2.39 0.0093534 0.522727 0.888268 0.466347
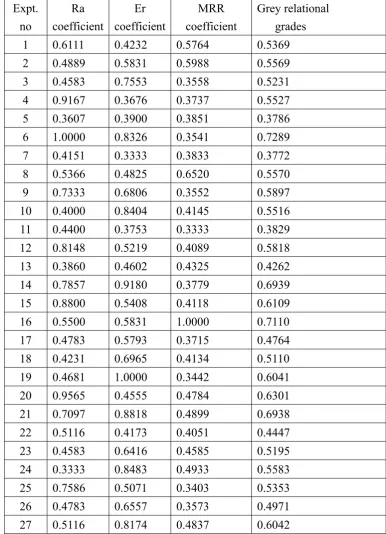
Table 8. Grey relational coefficients and grey relational grades for different performance Expt.
no
Ra coefficient
Er coefficient
MRR coefficient
Grey relational grades
1 0.6111 0.4232 0.5764 0.5369
2 0.4889 0.5831 0.5988 0.5569
3 0.4583 0.7553 0.3558 0.5231
4 0.9167 0.3676 0.3737 0.5527
5 0.3607 0.3900 0.3851 0.3786
6 1.0000 0.8326 0.3541 0.7289
7 0.4151 0.3333 0.3833 0.3772
8 0.5366 0.4825 0.6520 0.5570
9 0.7333 0.6806 0.3552 0.5897
10 0.4000 0.8404 0.4145 0.5516
11 0.4400 0.3753 0.3333 0.3829
12 0.8148 0.5219 0.4089 0.5818
13 0.3860 0.4602 0.4325 0.4262
14 0.7857 0.9180 0.3779 0.6939
15 0.8800 0.5408 0.4118 0.6109
16 0.5500 0.5831 1.0000 0.7110
17 0.4783 0.5793 0.3715 0.4764
18 0.4231 0.6965 0.4134 0.5110
19 0.4681 1.0000 0.3442 0.6041
20 0.9565 0.4555 0.4784 0.6301
21 0.7097 0.8818 0.4899 0.6938
22 0.5116 0.4173 0.4051 0.4447
23 0.4583 0.6416 0.4585 0.5195
24 0.3333 0.8483 0.4933 0.5583
25 0.7586 0.5071 0.3403 0.5353
26 0.4783 0.6557 0.3573 0.4971
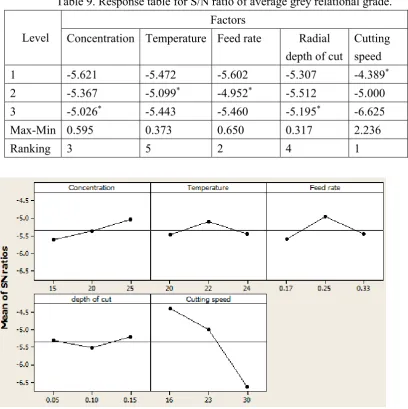
Table 9.Response table for S/N ratio of average grey relational grade.
Level
Factors
Concentration Temperature Feed rate Radial depth of cut
Cutting speed
1 -5.621 -5.472 -5.602 -5.307 -4.389*
2 -5.367 -5.099* -4.952* -5.512 -5.000
3 -5.026* -5.443 -5.460 -5.195* -6.625
Max-Min 0.595 0.373 0.650 0.317 2.236
Ranking 3 5 2 4 1
Fig. 4 Main effects plot of S/N ratios for grey relational grade
Table 10. ANOVA table for grey relational grade
Factors DoF Sum of
Squares
Mean of Square
F Value
p Value
A 2 0.004548 0.002274 0.27 0.770
B 2 0.002433 0.001216 0.14 0.868
C 2 0.009498 0.004749 0.56 0.584
D 2 0.002896 0.001448 0.17 0.846
E 2 0.087420 0.043710 5.12 0.019
Error 16 0.136612 0.008538
Table 11. Comparison of the initial and optimized results. Response parameters Optimal process parameters
Initial Predicted Experiment
al
Improvement rate (%) Level A1B1C2D2F3 A3B2C2D3F1 A3B2C2D3F1
37.78
Surface roughness 0.45 0.28
Roundness error 3.98 2.56 35.67
Material Removal Rate
0.004887 0.0137550 181.46
Grey relational grade 0.3772 0.6752 0.6628 75.72
Reference
1. Venkatarao, K.; Murthy, BSN.; Mohanrao, N. Cutting tool condition monitoring by analyzing surface roughness, work piece vibration and volume of metal removed for AISI 1040 steel in boring. Measurement 2013, vol.46, pp. 4075–4084.
2. Venkatarao, K.; Murthy, BSN.; Mohanrao, N. Prediction of cutting tool wear,
surface roughness and vibration of work piece in boring of AISI 316 steel with artificial neural network. Measurement 2014. vol.51, pp63–70.
3. Chun, S H.; Ko, T J. Study on the response surface model of machining error in internal lathe boring. Int J Precis Eng Manuf 2011, vol.12, no.2, pp.177–182.
4. Alexandre, Mondelin.; Valiorgue F.; Rech, J.; Coret M.; Feulvarch, E. Surface integrity prediction in finish turning of 15-5PH stainless steel. [1st] CIRP Conference on Surface Integrity 2011, vol.19, pp.270-275.
5. Schulz, H.; Spur, G. High speed turn-milling- a new precision manufacturing technology for the machining of rotationally symmetrical workpieces. CIRP Annals - Manufacturing Technology 1990, vol.39.
6. Choudhury, S K.; Bajpai, J.B. Investigation in orthogonal turn-milling towards better surface finish. J. Mater. Process Technol 2004, vol.170, pp. 487–493.
7. Deng, J L. Introduction to grey system theory. J. Grey Syst 1989, vol.1, pp. 1–24. 8. Kuram, E.; Ozcelik, B. Multi-objective optimization using Taguchi based grey
relational analysis for micro-milling of Al7075 material with ball nose end mill.
Measurement 2013, vol. 46, pp. 1849–1864.
10.Dabade, U A. Multi-objective process optimization to improve surface integrity on turned surface of Al/SiCp metal matrix composites using grey relational analysis.
Procedia CIRP 2013, vol. 7, pp. 299–304.
11.Hwang, S J.; Hwang, Y L.; Lee, B Y. The use of the Taguchi-Grey based to optimize high speed end milling with multiple performance characteristics. Journal of Material Science Forum 2006, Vol. 505-507, pp.835-840.
12.Tas,_kesen A.; Kütükde, K. Experimental investigation and multi-objective analysis on drilling of boron carbide reinforced metal matrix composites using grey relational analysis. Measurement 2014, vol. 47, pp.321–330.
13.Prasanna, J.; Karunamoorthy, L.; Venkat, Raman M.; Prashanth, S.; Chordia, D Raj. Optimization of process parameters of small hole dry drilling in Ti–6Al–4V using Taguchi and grey relational analysis. Measurement 2014, vol.48, pp.346–354.
14.Sheth, Saurin.; George, P M. Experimental investigation, prediction and optimization of cylindricity and perpendicularity during drilling of WCB material using grey relational analysis. Precision Engineering 2016, Vol. 45, pp. 33-43.
15.Goel, B.; Singh, S.; Sarepaka, RV. Optimizing single point diamond turning for mono-crystalline germanium using grey relational analysis. Mater. Manuf. Processes
2015, vol.30, pp.1018–1025.
16.Teimouri, Reza.; Amini, Saeid.; Mohagheghian, Nasrodin. Experimental study and empirical analysis on effect of ultrasonic vibration during rotary turning of aluminum 7075 aerospace alloy. Journal of Manufacturing Processes 2017, vol. 26, pp.1-12. 17.Zhou, Jinhua.; Ren, Junxue.; Yao, Chang feng. Multi-objective optimization of
multi-axis ball-end milling Inconel 718 via grey relational analysis coupled with RBF neural network and PSO algorithm. Measurement 2017, vol. 102, pp.271-285,.
18.Sarikaya, M.; Yilmaz, V.; Dilipak, H. Modeling and multi-response optimization of milling characteristics based on Taguchi and gray relational analysis. Proc. Inst. Mech. Eng. Part B-J. Eng. Manuf 2017, vol.230, pp.1049–1065, 2016.
19.Saha, Abhijit.; Subhas, Chandra Mondal. Multi-objective optimization in WEDM process of nanostructured hardfacing materials through hybrid techniques.
Measurement 2016, vol. 94, pp.46-59.
20.Nain, Somvir Singh.; Garg Dixit, Kumar Sanjeev. Modeling and optimization of process variables of wire-cut electric discharge machining of super alloy Udimet L605.
Engineering Science and Technology, an International Journal 2017, vol.20, No.1, pp.247-264.