Patron: Her Majesty The Queen
Rothamsted Research
Harpenden, Herts, AL5 2JQ
Telephone: +44 (0)1582 763133
Web: http://www.rothamsted.ac.uk/
Rothamsted Research is a Company Limited by Guarantee Registered Office: as above. Registered in England No. 2393175. Registered Charity No. 802038. VAT No. 197 4201 51. Founded in 1843 by John Bennet Lawes.
Rothamsted Repository Download
A - Papers appearing in refereed journals
Shewry, P. R., Wan, Y., Hawkesford, M. J. and Tosi, P. 2019. Spatial
distribution of functional components in the starchy endosperm of wheat
grains. Journal of Cereal Science. 91 (January), p. 102869.
The publisher's version can be accessed at:
•
https://dx.doi.org/10.1016/j.jcs.2019.102869
The output can be accessed at:
https://repository.rothamsted.ac.uk/item/96yz0/spatial-distribution-of-functional-components-in-the-starchy-endosperm-of-wheat-grains
.
© 7 November 2019, CC-BY terms apply
UNCORRECTED
PROOF
Contents lists available at ScienceDirectJournal of Cereal Science
journal homepage: http://ees.elsevier.comSpatial distribution of functional components in the starchy endosperm of wheat grains
Peter R. Shewry
a,∗, Yongfang Wan
a, Malcolm J. Hawkesford
a, Paola Tosi
baPlant Science Department, Rothamsted Research, Harpenden, Herts, AL5 2JQ, UK
bSchool of Agriculture, Policy and Development, University of Reading, Whiteknights Campus, Early Gate, RG6 6AR, Reading, UK
A R T I C L E I N F O
Keywords
Wheat White flour Starchy endosperm Starch
Lipids Gluten proteins Polysaccharides Dietary fibre
A B S T R A C T
The starchy endosperm of the mature wheat grain comprises three major cell types, namely sub-aleurone cells, prismatic cells and central cells, which differ in their contents of functional components: gluten proteins, starch, cell wall polysaccharides (dietary fibre) and lipids. Gradients are established during grain development but may be modified during grain maturation and are affected by plant nutrition, particularly nitrogen application, and environmental factors. Although the molecular controls of their formation are unknown, the high content of pro-tein and low content of starch of sub-aleurone cells, compared to the other starchy endosperm cells types, may result from differences in developmental programming related to the cells having a separate origin (from anticli-nal division of the aleurone cells). The gradients within the grain may be reflected in differences in the composi-tions of mill streams, particularly those streams enriched in the central and outer cells of the starchy endosperm, respectively, allowing the production of specialist flours for specific end uses.
1. Introduction
Wheat is used for a wide range of foods, from globally consumed forms such as bread, cakes, biscuits, pasta and noodles to regional and traditional foods such as couscous and bulgar. As the mature wheat ker-nel is dry and hard it can only be consumed after processing, which for most products starts with a form of milling. Milling fulfils two purposes: to reduce the grain to flour and to separate the different grain tissues. This separation is required because the grain has a complex structure, comprising several tissues which differ in their compositions, functional properties, health benefits and palatability to consumers. For most food applications milling is used to separate the starchy endosperm tissue of the grain and reduce it to fine white flour. However, this coarse separa-tion ignores the fine differences in composisepara-tion which exist both within and between tissues. We consider that this variation can be exploited by innovative milling methods, to develop specialist flours for specific end uses.
1.1. The wheat grain
The wheat grain is a single seeded fruit (caryopsis) in which the maternal fruit coat (pericarp) and seed coat (testa) surround the zy
gotic embryo and endosperm (Bechtel et al., 2009). These tissues can be further divided: the embryo comprises a single storage cotyledon (the scutellum) and the embryonic axis (plumule, radicle and hypocotyl) while the endosperm consists of starchy endosperm cells surrounded by a single layer of aleurone cells. The major tissue in the mature grain is the starchy endosperm, which accounts for about 83–84% of the dry weight. By contrast, the embryo accounts for about 3% of the dry weight, the aleurone about 6.5% and the outer layers (pericarp and testa) about 7–8% (Barron et al., 2007).
The starchy endosperm is the major storage tissue, storing both starch and protein, and is the origin of white flour produced by milling. Millers aim to recover the highest possible proportion of this tissue, of-ten achieving white flour yields equivalent to 78–80% of the grain dry weight. However, this process is based on the assumption that the en-dosperm is essentially homogeneous in composition which is not the case.
In fact, studies of developing and mature grain show that the cells present in the starchy endosperm differentiate into three major types (which are illustrated in Fig. 1) (Evers and Millar, 2002). Beneath the single layer of aleurone cells are two to three layers of protein-rich sub-aleurone cells and beneath these are elongated prismatic cells which radiate towards the centre of the grain (Fig. 1,
Abbreviations: A, arabinose; AX, arabinoxylan; AXOS, arabinoxylan oligosaccharide; DP, degree of polymerisation; DPA, days past anthesis; FTIR, Fourier transform infrared; GL, galactolipid; HMW, high molecular weight; LMW, low molecular weight; NMR, nuclear magnetic resonance; TAG, triacylglycerol; PL, phospholipid; SIMS, secondary ion mass spectrome-try; TDF, total dietary fibre; WE, water-extractable; WU, water-unextractable; X, xylose.
∗Corresponding author.
E-mail addresses:[email protected] (P.R. Shewry); [email protected] (Y. Wan); [email protected] (M.J. Hawkesford); p.tosi@ reading.ac.uk (P. Tosi)
https://doi.org/10.1016/j.jcs.2019.102869
UNCORRECTED
PROOF
P.R. Shewry et al. Journal of Cereal Science xxx (xxxx) xxx-xxx
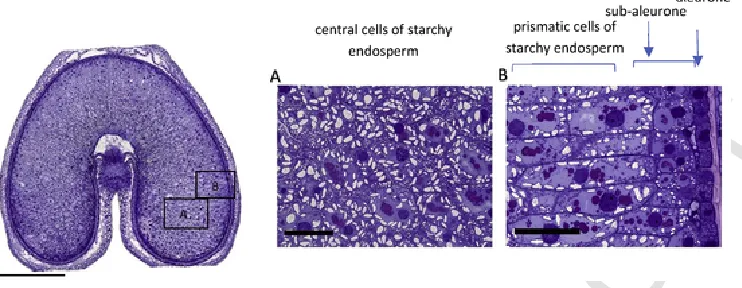
Fig. 1.Cross section of a developing grain of durum wheat cv Ofanto at 20 days DPA, stained with toluidine blue to show the distribution of protein (taken from Tosi et al., 2009, 2018).The left hand image shows the whole grain with the areas in boxes A and B expanded in the central and right hand images, respectively. The bar in the cross-section represents 1mm, the bars in panels 1 and 2 100μm. Note the high concentration of protein in the sub-aleurone cells in area B. (For interpretation of the references to colour in this figure legend, the reader is referred to the Web version of this article.)
area B). Finally, the cells in the central parts of the cheeks of the grain are round or polygonal and become highly extended with starch (Fig. 1, area A). Bradbury et al. (1956) reported approximate sizes of 60μm diameter for the sub-aleurone cells, 128–200μm x 40–60μm for the pris-matic cells and 72–144×69–120μm for the central cells.
These differences in cell size and morphology are accompanied by differences in composition, resulting in radial and longitudinal gradi-ents.
1.2. Analysis of gradients by pearling and imaging
Two approaches have been taken to study gradients in developing and mature grain. Sections of grain tissue can be analysed by various imaging approaches, ranging from simple light microscopy of stained and fixed tissues with components visualised by staining or immuno-chemistry, to sophisticated chemical imaging such as Fourier Transform Infrared (FT-IR) microspectroscopy (Barron et al., 2005; Toole et al., 2009, 2014, 2011), Raman microspectroscopy (Phillipe et al., 2006; Toole et al., 2009), MALDI MSI (Fanuel et al., 2018), and Secondary Ion Mass Spectrometry (NanoSIMS) (Moore et al., 2016). In general, these approaches are more readily applied to developing tissues than to mature grain, due to the ease of sectioning and the lower content of starch. Chemical imaging also requires specialist equipment and is gen-erally low throughput. For example, modern NanoSIMS equipment costs in excess of £3m with a maximum throughput of about 1 sample a day.
Although it is possible to carry out biochemical and chemical analy-ses on material prepared by hand-dissection of grain (for example, Saulnier et al., 2009), this approach is limited by the amount of time required for preparation. A more widely used method is to remove se-quential fractions from the outside of the grain using pearling (as de-scribed for barley by Millet et al., 1991 and for wheat by He et al., 2013). The application of pearling to wheat is illustrated in Fig. 2. Lab-oratory scale pearling mills, such as that shown in Fig. 2, are generally used for grain samples of about 50g, to generate fractions of between 3 and 5g each. However, these fractions do not correspond precisely to botanical tissues and pearling has two important limitations. Firstly, be-cause the grain is elongated the removal of tissue is not even, with more removed from the end of the grain (which consequently becomes pro-gressively more rounded). Secondly, the tissue within the groove is not removed, with the groove still being apparent when over 40% of the grain weight has been removed (Fig. 2). Nevertheless, the fractions still
Fig. 2.Pearling of grain of wheat cv Hereward.Part A shows the pearling mill; part B the whole grain and the cores after a typical experiment of 6 pearling cycles; part C the cumu-lative removal of material from the grain over 6 cycles using a single grain sample.
UNCORRECTED
PROOF
provide a broad view of the distribution of components within the wholegrain.
2. Radial gradients in the starchy endosperm
2.1. Protein
Differences in protein content and composition have been known for many years, with the sub-aleurone cells being richer in protein and hav-ing fewer and less regular in shape starch granules, compared with other starchy endosperm cells (Bradbury et al., 1956; Kent, 1966; Kent and Evers, 1969). In fact, Kent (1966) calculated that the sub-aleu-rone cells in a flour of 12.5% protein contained 54% protein (whereas 8% would be more typical for the central cells), and this protein enrich-ment of the sub-aleurone can be clearly seen when grain sections are stained to show the distribution of protein and other components (Fig. 1).
In addition, there are well established gradients in protein compo-sition. The most detailed study so far used sequential pearling to re-move six fractions each corresponding, on average, to about 8% of the grain weight (He et al., 2013). Comparison of these fractions and the milled core (corresponding to about 50% of the grain weight) showed that although the total protein content decreased from the outer layers to the centre of the grain, the proportion of gluten proteins increased, from about 50 to 55% to about 75% of the total protein in grain from plants grown with 100kg/ha of N-fertilizer. Analysis of protein fractions by SDS-PAGE and western blotting with antibodies to gluten proteins shows that there are also gradients in gluten protein composition, with the proportions of HMW subunits of glutenin and ɣ-gliadins increasing toward the centre of the grain and proportions of someѠ-gliadins and α-gliadins decreasing (Tosi et al., 2011; He et al., 2013). However, SDS-PAGE does not clearly separate the LMW subunits of glutenin from ɣ-gliadins andα-gliadins. He et al. (2013) therefore also determined the size distribution of gluten proteins extracted using SDS by SE-HPLC (Morel et al., 2000). This showed clear increases, from the outside to the centre of the grain, in the proportions of the HMW glutenin polymers (%F1) that are considered to contribute to gluten elasticity (Shewry et al., 2003) and, to a lesser extent, in the lower molecular weight glutenin polymers (%F2). These gradients were reflected in an increase in the ratios of HMW:LMW polymers (%F1/%F2 ratio), and of glutenin (F1+F2) to gliadin (F3 comprising mainlyѠ-gliadins + F4 comprising α- and ɣ-gliadins). Both of these ratios have been used as predictors of breadmaking quality.
Zhou et al. (2018) also reported analyses of pearling fractions, but removed 8 fractions, each corresponding to about 10% of the grain weight, with the core representing only 20% of the total. The results were broadly consistent with those of He et al. (2013), although they determined glutenin macropolymers (GMP), rather than the size distri-bution of glutenin polymers by SE-HPLC, and expressed the amounts of all proteins as % dry weight.
2.2. Starch
Starch is a mixture of two glucose polymers: amylose, which con-sists of unbranched (1→4) α-linked chains comprising up to several thousand glucose units, and amylopectin, which may comprise over 100,000 glucose units and is highly branched with (1→6)α-linkages as well as (1→4)α-linkages. The proportion of amylose in wheat starch generally ranges from about 18% to 35%. Mature wheat grain con-tains two distinct populations of starch granule, referred to as A-type and B-type. These populations differ in size and morphology, with A-type being >10μm and lenticular in shape and B-type about <10μm and spherical in shape (Stone and Morell, 2009). These popula-tions also differ in polymer composition and structure
(Shinde et al 2003), with B-type granules containing lower proportions of amylose than A-type granules (Duffus and Murdoch, 1979; Shinde et al., 2003).
Microscopy of developing and mature grain shows clear differences in the distribution of starch within the starchy endosperm cells, with only a few small granules being present in the protein-rich sub-aleurone cells (Fig. 1) (as also discussed by Tomlinson and Denyer, 2003). This distribution is consistent with the increases in the total starch and % amylose reported in pearling fractions by Tosi et al. (2018) and Zhou et al. (2018).
More detailed studies were reported by Zhou et al. (2018), who classified the starch granules into three types: A (diameter 22–28μm), B (7.4–7.7μm) and C (2.9–3.24μm) and showed small but statistically sig-nificant differences in their mean diameters between pearling fractions.
Starch has a major impact on the processing properties of flours, and both Tosi et al. (2018) and Zhou et al. (2018) reported gradients in the properties of the starch (onset temperature of gelatinisation and pasting properties) present in pearling fractions. However, it should be noted that these properties are likely to be affected by effects of milling, particularly on starch damage, which may be greater using a pearling mill (up to 18% damaged starch being reported by Tosi et al., 2018) than in roller milling (generally up to about 12%).
2.3. Cell wall polysaccharides
Cell wall polysaccharides are the major source of dietary fibre in ce-real products and hence are important for human nutrition and health. Whole grain contains about 11.5–15.5% (mean 13.4%) total dietary fibre (TDF), including 5.53–7.42% (mean 6.49%) arabinoxylan (AX), 1.67–3.05% (mean 2.11%) cellulose and 0.51–0.96% (mean 0.73%) β-glucan (Andersson et al., 2013). However, all of the cellulose and much of the AX andβ-glucan are located in the outer (bran) layers, and white flour contains only about 2–3% cell wall polysaccharides, with AX (70%) andβ-glucan (20%) being the dominant components. Analyses of pearling fractions have shown that TDF, AX andβ-glucan all decrease in concentration from the outer to inner layers (Zhou et al., 2018; Tosi et al., 2018). However, a series of studies have focused on variation in the fine structures of these components.
AX comprises a backbone of β-D-xylopyranosyl (xylose) residues linked through (1→4) glycosidic linkages, with some residues being substituted withα-L-arabinofuranosyl (arabinose) residues at either one or two positions. Some arabinose residues present as single substitutions may be further substituted with ferulic acid at the 5-position, which may form diferulate cross-links between polymers. AX is often divided into two classes, depending on whether it is extractable (WE-AX) or un-extractable (WU-AX) with water.β-glucan comprises glucose residues joined by (1→3) and (1→4) linkages. Single (1→3) linkages are usu-ally separated by two or three (1→4) linkages, but longer stretches of up to 14 (1→4) linked glucan units (sometimes referred to as“ cellu-lose-like” regions) have been reported for wheat branβ-glucan (Li et al., 2006). This structural variation may be studied by“enzyme finger-printing”(Ordaz-Ortiz et al., 2005), in which the polymers are di-gested with specific enzymes (endoxylanase for AX, lichenase forβ -glu-can) and the structures and proportions of the oligosaccharides which are released determines, by spectroscopic imaging of sections, or by NMR spectrometry of hand dissected samples of tissue.
UNCORRECTED
PROOF
P.R. Shewry et al. Journal of Cereal Science xxx (xxxx) xxx-xxx
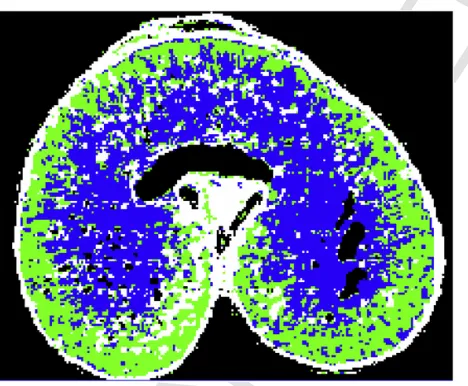
then using FT-IR microspectroscopy to determine the structure of AX. Comparison of the spectra with those of purified WE-AX and WU-AX al-lowed AX structures to be defined as highly substituted with arabinose or less highly substituted. Fig. 3 illustrates this approach, using false colour to display the distributions of highly substituted AX (blue) in the centre of the grain and less substituted AX (green) towards the periph-ery. However, it should be noted these two structures were defined using an arbitrary cut off and are not discrete populations of molecules. Sim-ilarly, there are gradients rather than discrete boundaries in the distri-butions of this structural variation across the grain. Further application of this method showed that the relative degree of arabinosylation var-ied between cultivars grown under the same conditions (Toole et al., 2011), and that the structure changed during grain development, with a decrease in the area of highly substituted AX and an increase in the area of less substituted AX, a process referred to as“remodelling”(Toole et al., 2014).
FT-IR gives only limited information on AX structure and other ap-proaches have been used to provide more detailed information on varia-tion in structure at the tissue level, including Raman microspectroscopy which provides data on esterification with phenolic acids as well as arabinosylation (Phillipe et al., 2006; Toole et al., 2009), 1NMR
spectrometry to provide more information on arabinosylation (Toole et al., 2014, 2011) and micro-scale enzyme fingerprinting (as discussed above) (Saulnier et al., 2009). These earlier studies have been re-viewed in detail by Saulnier et al. (2009).
More recently, Saulnier and colleagues have carried out enzyme hydrolysis directly on tissue sections and identified the oligosaccha-rides released by MALDI mass spectroscopy imaging (MSI) (Velickovik et al., 2014). In order to study spatial variation in structure they de-termined four oligosaccharides: DP3 and DP4 fragments from β -glu-can and AX5 and AX6 fragments from AX. The latter have the struc-tures XA3XX and XA2+3XX and were selected as they are known to
be major contributors to variation in AX substitution. They
Fig. 3.Spectroscopic FT-IR image overlaid onto a light microscope image of a transverse section of a grain of wheat cv. Spark at 30 DPA.The grain section has been treated to remove the cell contents allowing the spectra of the cell walls to be determined. Previ-ous studies had established that the height of a shoulder in the FT-IR spectrum at 1075 cm-1 reflects the extent of substitution of the AX structure (Toole et al., 2007, 2009). A colour was therefore assigned to each pixel depending on the height of the shoulder at 1075 cm-1 compared to that of the major peak at 1041 cm-1. If the shoulder was below 66% the pixel was coloured green to represent low substituted AX and if it was above 66% it was coloured blue to represent highly substituted AX. White represents remaining starch, and black represents holes or pixels where the amount of AX was too low to determine. Figure kindly provided by Dr. Geraldine Toole (IFR, Norwich, UK). (For interpretation of the references to colour in this figure legend, the reader is referred to the Web version of this article.)
showed that both AX and β-glucan were concentrated in the outer cells of the endosperm in immature grain but more evenly distributed throughout the endosperm at maturity. The ratio of AX5/AX6 fragments also confirmed other studies (discussed above) which showed lower ara-binosylation of AX in the outer layers. Similarly, the ratio of DP3/DP4 fragments released from β-glucan was higher in the glucan-enriched outer cells of immature grain.
2.4. Lipids
Lipids are minor components of the grain, accounting by weight for about 2.0–2.5% of flour (Pareyt et al., 2011). They comprise many individual components (molecular species) which are broadly classified into three types: polar lipids (phospholipids (PL) and galactolipids (GL) which are structural components of membranes), triacylglycerols (TAG) (storage lipids) and free fatty acids. However, there is great diversity within all three groups, notably in the head groups of PLs and GLs and the fatty acids esterified to these components and TAGs. The total lipid content of pearling fractions is greatest in those that contain the aleu-rone and embryo and the lowest in fractions corresponding to the cen-tre of the grain, with the proportion of unsaturated fatty acids show-ing a similar pattern (Tosi et al., 2018). The composition of molec-ular species also varies between pearling fractions, including the con-tents of GLs (monogalactosyl diglyceride and digalactosyl diglyceride) (González-Thuillier et al., 2015).
3. Linear gradients in the starchy endosperm
Early reports of differences in the distribution of components in the wheat starchy endosperm focused on radial gradients as these are readily observed in transverse sections of grain. Consequently, analyses of pearling fractions were also largely interpreted in relation to radial distribution. However, pearling actually removes more material from the ends of the grains than from the central parts, resulting in an in-creasingly spherical shape (Fig. 1). Hence, the question must be asked whether gradients also exist along the longitudinal axis of the grain. Al-though there is little work on this topic, two recent studies show that this is the case.
3.1. Proteins
Shi et al. (2019) determined longitudinal gradients in proteins by removing the embryos from developing caryopses and then cutting them into three equal sections. The total gluten protein content was lower in the section adjacent to the embryo, which may have related to the pres-ence in the dorsal part of modified starchy endosperm cells which sup-port the growth of the embryo. However, gradients in protein compo-sition were also observed, with a lower proportion ofѠ-gliadins (and higher proportions of other gluten proteins) in the section adjacent to the embryo. The biological significance of this distribution is not known, as there is no obvious relationship betweenѠ-gliadins and embryo de-velopment.
3.2. Cell wall polysaccharides
Saulnier et al. (2009) reviewed the current evidence for varia-tion in cell wall polysaccharides along the longitudinal axis of the grain. They reported that the starchy endosperm cells close to the embryo (proximal to the point of attachment) were enriched inβ-glucan, with AX being highly substituted (with a ratio of A:X of about 0.7) in the same cells. The proportion ofβ-glucan decreased towards the distal end of the grain, with lower AX substitution, although the substitution was higher in prismatic cells than in central cells.
UNCORRECTED
PROOF
A more detailed study was reported by Fanuel et al. (2018), whoanalysed 30 consecutive cross-sections of a mature grain using enzyme digestion to release oligosaccharides fromβ-glucan and AX, which were then detected by MALDI MSI (as discussed above). Compilation of the images allowed a 3D model of variation in polysaccharide structure to be constructed. This confirmed thatβ-glucan was more abundant adja-cent to the germ and in the adja-central starchy endosperm cells, while the AX was more highly substituted at the distal end of the grain and around the crease.
Films made with highly substituted AX show higher water-diffusiv-ity than those made with low substituted AX (Ying et al., 2015) and Saulnier et al. (2009) suggested that structural variation in AX may modulate the hydration properties of cell walls. Fanuel et al. (2018) therefore concluded that the distribution of highly substituted AX along the crease and particularly in the vicinity of the germ, was consistent with the active transport of nutrients in these regions.
4. Modulation of gradients by nutrition and environment
He et al. (2013) compared the spatial patterns of gluten proteins and polymers in wheat grain grown with two levels of nitrogen fertiliser, 100kg Ha (which is typical of low input farming systems in the UK) and 350kg Ha (which is higher than used by UK farmers). Nitrogen avail-ability had the expected positive effect on total grain protein and on to-tal gluten proteins, but also affected the protein composition, with the proportions ofѠ-gliadins increasing in all pearling fractions, and the proportion of HMW subunits increasing in all fractions except the core. This differential effect of nitrogen is illustrated in Fig. 4, which shows gradients in the amounts ofѠ-gliadin protein and RNA transcripts in transverse sections of grain grown at 100 and 350 kgN Ha (Wan et al., 2013).
Similar differential effects of N-supply on gluten protein composition in three longitudinal sections were reported by Shi et al. (2019), with increased proportions ofѠ-gliadins and HMW subunits in all three sec-tions at 21 and 28 days post anthesis. However, He et al. (2013) re-ported that there was little effect of nitrogen supply on the proportions of glutenin polymers in the fractions, with the percentages of peaks F1 (comprising high molecular weight polymers enriched in HMW subunits of glutenin) and F2 (comprising smaller polymers enriched in LMW sub-units of glutenin) being only marginally lower at 350kgN Ha and the ratio of %F1/%F2 being almost identical in grain grown at both nitro-gen levels.
More detailed studies of factors determining gradients in protein amount were reported by Savill et al. (2018) who developed an im-age analysis system to quantify the distribution of protein in stained sec-tions of developing grain. In addition to confirming previous studies of protein distribution and the effects of nitrogen fertilisation, they also showed that the gradients were enhanced by high temperatures post-an-thesis. Zhong et al. (2018) also studied the effects of nitrogen fertili-sation on protein distribution and processing quality, showing that they could be modulated by the timing of application of top dressing.
Environmental effects on the remodelling of AX have also been re-ported, with the rate of transition from highly arabinosylated to less ara-binosylated AX being faster in grain grown at higher temperature and limited water availability from 14 days after anthesis (Toole et al., 2007a,b). However, it is likely that this acceleration results from the in-creased rate of grain maturation under these conditions rather than re-programming of grain development.
5. Mechanisms determining the establishment of gradients during development of wheat grain
Microscopy of developing wheat grains using specific antibodies for immunolocalisation shows that the gradients in protein content
Fig. 4.Spatial patterns of deposition of total proteins andω-gliadins in the starchy en-dosperm of wheat cv Hereward grown at nitrogen levels of 100kg/ha (left panel: A, C, E, G) and 350kg/ha (right panel: B, D, F, H).A-B, sections at 27 DPA stained for protein bod-ies with Naphthol Blue Black; E-F,in situhybridisation of transcripts related toω2-gliadins (C,D) andω5-gliadins (E,F) at 17 DPA; G-H, immunolocalisation ofω5-gliadin at 27 DPA; The immunofluorescence labelling in G and H is displayed in false yellow colour. Scale bars: 500μm (A–H). Taken from Wan et al. (2013). (For interpretation of the references to colour in this figure legend, the reader is referred to the Web version of this article.)
and composition in the starchy endosperm are established gradually during development, with different proteins accumulating at different rates at different stages (Tosi et al., 2011). However, such analyses are only able to measure protein accumulation, not protein deposition at a defined stage. In order to study this, Moore et al. (2016) fed
15N-labelled glutamine to developing grains, via microcapillary tubes
inserted into the rachis, and determined protein deposition by mea-suring the degree of enrichment of protein bodies in individual cells with15N using NanoSIMS (secondary ion mass spectrometry). Isotope
UNCORRECTED
PROOF
P.R. Shewry et al. Journal of Cereal Science xxx (xxxx) xxx-xxx
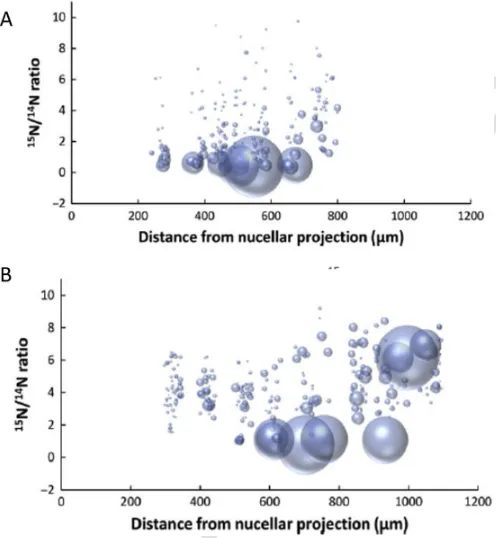
that the labelled substrate was transported radially from its point of entry in the groove across the central starchy endosperm to the pro-tein-rich sub-aleurone cells. This is illustrated in Fig. 5, which shows that after 7 days most of the15N is present in large protein bodies in the
sub-aleurone cells.
This raises the question of why the amino acid substrate is trans-ported across the developing starchy endosperm to be incorporated into protein in the cells just below the aleurone layer. The simplest expla-nation is that the genes encoding gluten proteins are also differentially expressed, being most strongly expressed in the sub-aleurone cells. This is certainly the case for a LMW subunit gene, which is strongly ex-pressed in these cells but only weakly exex-pressed in the central starchy endosperm (Stoger et al., 2001). Thus, high levels of gluten protein gene expression may provide a sink for amino acid substrates in the sub-aleurone cells, resulting in a concentration gradient which drives transport from the transfer cells in the groove. This hypothesis is consis-tent with the study of Ugalde and Jenner (1990) who measured the concentrations of soluble amino acids across the developing endosperm. They found that the concentrations decreased from the endosperm cav-ity to the mid-point and then increased from the midpoint to the periph-ery. Based on this they concluded that the high level of protein accu-mulation in the peripheral cells could not be attributed to the pattern of substrate supply and that the transport of amino acids did not limit pro-tein synthesis.
The difference in developmental programming of the sub-aleurone cells with respect to other starchy endosperm cells may result from their different lineages, the sub-aleurone cells being derived from an-ticlinal divisions of the aleurone cells, which continue to divide up to about 14 days after anthesis (Bechtel et al., 2003). This differ-ential programming may also account for the differences in the
Fig. 5.Graphical representation of the size and15N enrichment of protein bodies along a transect of starchy endosperm tissue (from the nucellar projection to the aleurone layer) after labelling at 20 DPA and imaging after either 24h (A) or 7 days (B), showing trans-port of15N glutamine substrate across the developing starchy endosperm.Individual pro-tein bodies are displayed as“bubbles”, which correspond in size to their measured areas. The positions of the protein bodies correspond to their locations along the transect (x axis) and their degree of enrichment with15N (y axis). Sections were washed to remove free15N glutamine Taken from Moore et al. (2016).
accumulation of starch between the sub-aleurone and other starchy en-dosperm cells.
Whereas the gradients in protein composition may be explained, at least in part, by differences in developmental programming due to cell lineages, the gradients in other components are not as clear cut and the explanations may differ. In particular, Saulnier and colleagues have suggested that variation in AX structure modulates the hydration and permeability of cell walls and that variation in composition reflects the functional requirements of the cells. Hence, in this case the gradients may reflect biological rather than developmental differences between cell types.
6. Is it possible to exploit spatial gradients in grain utilisation?
The compositions of the fractions removed by pearling clearly re-flect differences in the spatial distributions of components within the grain that could have impacts on processing quality. For example, the increased proportion of high molecular weight glutenin polymers in the central part of the grain reported by He et al. (2013) implies that the central cells of the starchy endosperm would have higher intrinsic qual-ity for breadmaking, despite their lower protein content. Similarly, the high content in galactolipids of the central core (González-Thuillier et al., 2015) may affect the breadmaking performance (Pareyt et al., 2011). Differences in starch properties among pearling fractions (He et al., 2013; Zhou et al., 2018) would also be expected to affect process-ing quality, and Zhou et al. (2018) indeed reported correlations with differences in quality for making bread and biscuits.
The question, therefore, is whether these gradients can be exploited by conventional milling to produce flours with different compositions and end use properties. Milling is a highly sophisticated process which has been developed to separate the starchy endosperm tissue (white flour) from the outer layers (aleurone, pericarp and testa) and embryo (germ), which together form the bran. Laboratory scale mills may pro-duce up to 6 flour fractions, and commercial mills over 20. In com-mercial milling, the purest flour fractions are recombined to give white flour, with a total yield of between 78% and 80% of the grain weight.
However, the flour fractions are known to differ in composition. This difference in purity may reflect their degree of contamination with bran. However, it may also reflect their origin in the grain, with the purest streams coming from the central part of the starchy endosperm. It is therefore of interest to determine how their compositions compare with those of pearling fractions, so that mill streams can be more efficiently recombined to produce flours with specific characteristics.
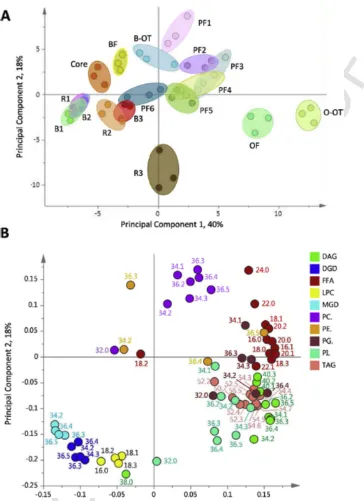
In order to answer this question González-Thuillier et al. (2015) compared the lipid compositions of pearling fractions with mill streams produced using a Buhler-MLU-202 laboratory mill, using the same grain sample. The mill generated 10 fractions comprising, four bran fractions and six flour fractions, the latter representing three break fractions and three reductions. Determination of the ash contents of these fractions in-dicated that Break 1 and Reduction 1 were the purest (0.3% ash), fol-lowed by Break 2 and Reduction 2 (0.4%) and Break 3 and Reduction 3 (0.8 and 0.6%, respectively). Since the ash is derived from contami-nation with bran, it is likely that fractions 1 correspond to the central starchy endosperm and fractions 3 from the outer part. The range of variation in lipid composition within the two sample sets was similar, but multivariate analysis of the two datasets showed no clear correspon-dence between the fractions (Fig. 6). Most of the pearling fractions clus-tered together, with only the core clustering fairly close to the white flour fractions. It can therefore be concluded that pearling can be used to identify differences in the spatial distribution of components, but not
UNCORRECTED
PROOF
Fig. 6.Principal Component Analysis (PCA) fractions from milling and pearling of wheat cv HerewardA: PCA scores plot showing PC1 (40%) vs PC2 (18%). Pearling fractions: PF1, pearling fraction 1; PF2, pearling fraction 2; PF3, pearling fraction 3; PF4, pearling fraction 4; PF5, pearling fraction 5; PF6, pearling fraction 6 and core. Milling fractions: B1, break 1; R1, reduction 1; B2, break 2; R2, reduction 2; B3, break 3; R3, break 3; OF, offal fraction; O-OT, offal over-tail; BF, bran fraction; B-OT, bran over-tail.B: PCA loadings plot of PC1 vs PC2 showing the molecular species responsible for the separation in A. Variables are coloured according to their lipid class and are labelled according to chain length and double bond number. Lipid classes are diacylglycerol (DAG), digalactosyl diglyceride (DGD), free fatty acids (FFA), lysophosphatidyl choline (LPC), monogalactosyl diglyceride (MGD), phosphatidyl choline (PC), phosphatidyl ethanolamine (PE), phosphatidyl glycerol (PG), phosphatidyl inositol (PI), and triacylglycerol (TAG)., Taken from González-Thuillier et al. (2015).
to predict the compositions of fractions produced by roller milling, which require instead direct analysis.
Nevertheless, this study, and other comparisons of the composi-tions of mill streams (Prabhasankar et al., 2000; Nyström et al., 2007; Ramseyer et al., 2011), suggest that millers can indeed ploit differences in composition to produce specialist flours. For ex-ample, flour fractions from the central starchy endosperm cells should give highly elastic doughs suitable for breadmaking processes requiring high dough strength, such as the Chorleywood Breadmaking Process, while fractions from the outer layers should give more
UNCORRECTED
PROOF
P.R. Shewry et al. Journal of Cereal Science xxx (xxxx) xxx-xxx
Declaration of competing interest
The authors have no competing interests.
Acknowledgements
Rothamsted Research receives grant-aided support from the Biotech-nology and Biological Sciences Research Council of the UKand the work at Rotham-sted forms part of the Designing Future Wheat strategic programme [BB/P016855/1).
Appendix A. Supplementary data
Supplementary data to this article can be found online athttps://doi. org/10.1016/j.jcs.2019.102869.
Uncited reference
Saris et al., 2012, Wilkinson et al., 2010.
References
Andersson, A.A.M., Andersson, R., Piironen, V., Lampi, A.-M., Nystrom, L., Boros, D., Fras, A., Gebruers, K., Courtin, C.M., Delcour, J.A., Rakszegi, M., Bedo, Z., Ward, J.L., Shewry, P.R., Aman, P., 2013. Contents of dietary fibre components and their relation to associated bioactive components in whole grain wheat samples from the HEALTH-GRAIN diversity screen. Food Chem. 136, 1243–1248.
Barron, C., Parker, M.L., Mills, E.N.C., Rouau, X., Wilson, R.H., 2005. FTIR imaging of wheat endosperm cell walls in situ reveals compositional and architectural hetero-geneity related to grain hardness. Planta 220, 667–677.
Barron, C., Surget, A., Rouau, X., 2007. Relative amounts of tissues in mature wheat (Triticum aestivumL.) grain and their carbohydrate and phenolic acid composition. J. Cereal Sci. 45, 88–96.
Bechtel, D.B., Wilson, J.D., 2003. Amylose development and starch granule development in hard red winter wheat. Cereal Chem. 80, 175–183.
Bechtel, D.B., Abecassis, J., Shewry, P.R., Evers, T., 2009. The development, structure and mechanical properties of the wheat grain. In: Khan, K., Shewry, P.R. (Eds.), Wheat: Chemistry and Technology, fourth ed. American Association of Cereal Chemists, St Paul, pp. 51–95.
Bradbury, D., MacMasters, M., Cull, I.M., 1956. Structure of the mature wheat kernel. III. Microscopic structure of the endosperm of hard red winter wheat. Cereal Chem. 33, 361–373.
Duffus, C.M., Murdoch, S.M., 1979. Variation in starch granule size distribution and amy-lose content during wheat endosperm development. Cereal Chem. 56, 427–429. Evers, T., Millar, S., 2002. Cereal grain structure and development: some implications for
quality. J. Cereal Sci. 261, 32–84.
Fanuel, M., Ropartz, D., Guillon, F., Saulnier, L., Rogniaux, H., 2018. Distribution of cell wall hemicelluloses in the wheat grain endosperm: a 3D perspective. Planta 248, 1505–1513.
González-Thuillier, I., Salt, L., Chope, G., Penson, S., Skeggs, P., Tosi, P., Ward, J., Wilde, P., Shewry, P., Haslam, R., 2015. Distribution of lipids in the wheat grain determined by analysis of milling and pearling fractions. J. Agric. Food Chem. 63, 10705–10716. He, J., Penson, S., Powers, S., Hawes, C., Shewry, P.R., Tosi, P., 2013. Spatial patterns
of gluten protein and polymer distribution in wheat grain. J. Agric. Food Chem. 61, 6207–6215.
Kent, N.L., 1966. Subaleurone endosperm cells of high protein content. Cereal Chem. 43, 585–601.
Kent, N.L., Evers, A.D., 1969. Variation in protein composition within the endosperm of hard wheat. Cereal Chem. 46, 293–300.
Li, W., Cui, S.W., Kakuda, Y., 2006. Extraction, fractionation, structural and physical char-acterization of wheatβ-D-glucans. Carbohydr. Polym. 63, 408–416.
Millet, M.O., Montembault, A., Autran, J.C., 1991. Hordein compositional differences in various anatomical regions of the kernel between two different barley types. Sci. Des Alimentations 11, 155–161.
Moore, K.L., Tosi, P., Palmer, R., Hawkesford, M.J., Grovenor, C.R.M., Shewry, P.R., 2016. The dynamics of protein body formation in developing wheat. Plant Biotechnol. J. 9, 1876–1882.
Morel, M.-H., Dehlon, P., Autran, J.C., Leygue, J.P., BarL’Helgouac’h, C., 2000. Effects of temperature, sonication time, and power settings on size distribution and extractabil-ity of total wheat flour proteins as determined by size-exclusion high-performance liq-uid chromatography. Cereal Chem. 77, 685–691.
Nyström, L., Paasonen, A., Lampi, A.-M., Piironen, V., 2007. Total plant sterols, steryl fer-ulates and steryl glycosides in milling fractions of wheat and rye. J. Cereal Sci. 45, 106–115.
Ordaz-Ortiz, J.J., Devaux, M.-F., Saulnier, L., 2005. Classification of wheat varieties based on structural features of arabinoxylans as revealed by endoxylanase treatment of flour and grain. J. Agric. Food Chem. 53, 8349–8356.
Pareyt, B., Finnie, S.M., Putseys, J.A., Delcour, J.A., 2011. Lipids in bread making: sources, interactions, and impact on bread quality. J. Cereal Sci. 54, 266–279.
Phillipe, S., Barron, C., Robert, P., Devaux, M.-F., Saulnier, L., Guillon, F., 2006. Char-acterization using Raman microspectroscopy of arabinoxylans in the walls of differ-ent cell types during the developmdiffer-ent of wheat endosperm. J. Agric. Food Chem. 54, 5113–5119.
Prabhasankar, P., Sudha, M.L., Haridas, R.P., 2000. Quality characteristics of wheat flour milled streams. Food Res. Int. 33, 381–386.
Ramseyer, D.D., Bettge, A.D., Morris, C.F., 2011. Distribution of total, water-unextractable, and water-extractable arabinoxylans in wheat flour mill streams. Cereal Chem. 88, 209–216.
Saris, W.H., Asp, N.G., Björck, I., Blaak, E., Bornet, F., Brouns, F., Frayn, K.N., Fürst, P., Riccardi, G., Saulnier, L., Guillon, F., Chateigner-Boutin, A.-L., 2012. Cell wall deposi-tion and metabolism in wheat grain. J. Cereal Sci. 56, 91–108.
Saulnier, L., Robert, P., Grintchenko, M., Jamme, F., Bouchet, B., Guillon, F., 2009. Wheat endosperm cell walls: spatial heterogeneity of polysaccharide structure and composi-tion using micro-scale enzymatic fingerprinting and FT-IR microspectroscopy. J. Ce-real Sci. 50, 312–317.
Savill, G., Michalski, A., Powers, S.J., Wan, Y., Tosi, P., Buchner, P., Hawkesford, M.J., 2018. Temperature and nitrogen supply Interact to determine protein distribution gra-dients in the wheat grain endosperm. J. Exp. Bot. 69, 3117–3126.
Shewry, P.R., Halford, N.G., Tatham, A.S., Popineau, Y., Lafiandra, D., Belton, P., 2003. The high molecular weight subunits of wheat glutenin and their role in determining wheat processing properties. Adv. Food Nutr. Res. 45, 221–302.
Shi, Z., Wang, Y., Wan, Y., Hassall, K., Jiang, D., Shewry, P.R., Hawkesford, M.J., 2019. Gradients of gluten proteins and free amino acids along the longitudinal Axis of the developing caryopsis of bread wheat. J. Agric. Food Chem. 67, 8706–8714. Shinde, S.V., Nelson, J.E., Huber, K.C., 2003. Soft wheat starch pasting behavior in
rela-tion to A- and B-type granule content and composirela-tion. Cereal Chem. 80, 91–98. Stoger, E., Parker, M., Christou, P., Casey, R., 2001. Pea legumin overexpressed in wheat
endosperm assembles into an ordered paracrystalline matrix. Plant Physiol. 125, 1732–1742.
Stone, B., Morell, M.K., 2009. Carbohydrates. In: Khan, K., Shewry, P.R. (Eds.), Wheat: Chemistry and Technology, fourth ed. American Association of Cereal Chemists, St Paul, MN, pp. 299–362.
Tomlinson, K., Denyer, K., 2003. Starch synthesis in cereals. Adv. Bot. Res. Incl. Adv. Plant Pathol. 40, 1–61.
Toole, G.A., Wilson, R.H., Parker, M.L., Wellner, N.K., Wheeler, T.R., Shewry, P.R., Mills, E.N.C., 2007. The effect of environment on endosperm cell wall development in
Triticum aestivumduring grain filling: an infrared spectroscopic imaging study. Planta 225, 1393–1403.
Toole, G.A., Wilson, R.H., Parker, M.L., Wellner, N.K., Wheeler, T.R., Shewry, P.R., Mills, E.N.C., 2007. The effect of environment on endosperm cell-wall development in
Triticum aestivumduring grain filling: an infrared spectroscopic imaging study. Planta 225, 1393–1403.
UNCORRECTED
PROOF
Toole, G.A., Barron, C., Le Gall, G., Colquhoun, I.J., Shewry, P.R., Mills, E.N.C., 2009. Re-modelling of arabinoxylan in wheat (Triticum aestivum) endosperm cell walls during grain filling. Planta 229, 667–680.
Toole, G.A., Le Gall, G., Colquhoun, I.J., Johnson, P., Bedö, Saulnier, L., Shewry, P.R., Mills, E.N.C., 2011. Spectroscopic analysis of diversity in arabinoxylan structures in endosperm cell walls of wheat cultivars (Triticum aestivum) in the HEALTHGRAIN di-versity collection. J. Agric. Food Chem. 99, 7075–7082.
Toole, G.A., Le Gall, G., Colquhoun, I.J., Nemeth, C., Saulnier, L., Lovegrove, A., Pellny, T., Velickovic, D., Ropartz, D., Guillon, F., Saulnier, L., Rogniaux, H., 2014. New insights into the structural and spatial variability of cell-wall polysaccharides during wheat grain development, as revealed through MALDI mass spectroscopy imaging. J. Exp. Bot. 65, 2079–2091.
Tosi, P., Parker, M., Gritsch, C.S., Carzinaga, R., Martin, B., Shewry, P.R., 2009. Traffick-ing of storage proteins in developTraffick-ing grain of wheat. J. Exp. Bot. 60, 979–991. Tosi, P., Gritsch, C.S., He, J., Shewry, P.R., 2011. Distribution of gluten proteins in bread
wheat (Triticum aestivum) grain. Ann. Bot. 108, 23–25.
Tosi, P., He, J., Lovegrove, A., Gonzalez-Thuillier, I., Penson, S., Shewry, P.R., 2018. Gradi-ents in compositions in the starchy endosperm of wheat have implications for milling and processing. Trends Food Sci. Technol. 82, 1–7.
Ugalde, T.D., Jenner, C.F., 1990. Substrate Gradients and regional patterns of dry matter deposition within developing wheat endosperm. II. Amino acids and protein. Aust. J. Plant Physiol. 17, 395–406.
Wan, Y., Gritsch, C.S., Hawkesford, M.J., Shewry, P.R., 2013. Effects of nitrogen nutrition on the synthesis and deposition of theω-gliadins of wheat. Ann. Bot. 113, 607–615. Wilkinson, M.D., Freeman, J., Mitchell, R.A.C., Mills, E.N.C., Shewry, P.R., 2010. Temporal
and spatial changes in cell wall composition in developing grains of wheat cv. Here-ward. Planta 232, 677–689.
Ying, R.F., Saulnier, L., Bouchet, B., Barron, C., Ji, S.J., Rondeau-Mouro, C., 2015. Mul-tiscale characterisation of arabinoxylan and beta-glucan composite films. Carbohydr. Polym. 122, 248–254.
Zhong, Y., Yang, M., Cai, J., Wang, Z., Zhou, Q., Cao, W., Dai, T., Jiang, D., 2018. Nitrogen topdressing timing influences the spatial distribution patterns of protein components and quality traits of flours from different pearling fractions of wheat (Triticum aestivum
L.) grains. Field Crop. Res. 216, 120–128.