Procedia Engineering 89 ( 2014 ) 95 – 102 Available online at www.sciencedirect.com
1877-7058 © 2014 The Authors. Published by Elsevier Ltd. This is an open access article under the CC BY-NC-ND license (http://creativecommons.org/licenses/by-nc-nd/3.0/).
Peer-review under responsibility of the Organizing Committee of WDSA 2014 doi: 10.1016/j.proeng.2014.11.164
ScienceDirect
16th Conference on Water Distribution System Analysis, WDSA 2014
Sequential Multi-Objective Evolutionary Algorithm for a Real-World Water
Distribution System Design
F. Rahmani
a, K. Behzadian
b,c,*
aAmirkabir University of Technology, Department of Civil and Environmental Engineering, Tehran, Iran
bUniversity of Exeter, Centre for Water Systems, College of Engineering, Mathematics and Physical sciences, Exeter, EX4 4QF, UK cAmirkabir University of Technology, Environmental Research Centre, Tehran, Iran
Abstract
This paper presents a methodology based on a three-stage multi-objective optimization model for solving the problem of Battle of Background Leakage Assessment for Water Networks (BBLAWN) at WDSA2014 conference. At the first stage, the optimal design of pipeline rehabilitation, pump scheduling and tank sizing is formulated and solved on the skeletonized network by a optimizing (1) the costs of pipes, pumps and tank upgrading and (2) the cost of water losses and energy. Three optimal solutions are used for a second optimisation step on the full network (i.e. not skeletonised). The third optimisation step is then performed starting from second stage optimal solutions considering the three objectives of the original problem.
© 2014 The Authors. Published by Elsevier Ltd.
Peer-review under responsibility of the Organizing Committee of WDSA 2014.
Keywords: water Distribution system, sequential multi-objective, leakage, cost
1.Introductions
Previous researchers have formulated and solved various optimisation models for designing optimal water distribution system (WDS). Some of the common objectives used in these models are to minimise cost, leakage, and system failure, or to maximise reliability, efficiency and resilience. Among these metrics, leakage minimisation has been selected in the main purpose of the Battle of Background Leakage Assessment for Water Networks (BBLAWN) in WDSA2014 conference [1]. There are different ways to reduce the water loses in WDS. Pressure management by using pressure control valves (PCVs) or pumps scheduling is one of the most common ways to control the water loss.
* Corresponding author. Tel.: +44-1392-724075; fax: +44-1392-217965.
E-mail address: [email protected]
© 2014 The Authors. Published by Elsevier Ltd. This is an open access article under the CC BY-NC-ND license (http://creativecommons.org/licenses/by-nc-nd/3.0/).
However, the main challenge of PCVs is to find the best locations for installing and their associated settings. Pipeline rehabilitation is another common way for leakage control although finding the appropriate pipes for rehabilitation in a proper time can be challenging. In one of the recent work, Araujo et al. (2006) used a genetic algorithm technique to optimize the number and location of control valves for pressure control decreasing the leakage amount [2]. Design/rehabilitation of water distribution systems using multi objective algorithm such as genetic algorithms has been widely attracted researchers during the last decade. Halhal et al. (1997) proposed an approach for identifying the rehabilitation method using the multi-objective messy genetic algorithm to minimize the costs and maximize the benefits [3]. Kapelan et al. (2005) considered cost and system reliability to formulate the problem with a two-objective optimization method [4]. Giustolisi et al. (2008) presented a hydraulic simulation model based on pressure-driven demand to calculate the leakage amount more accurately [5]. Fu et al. (2012) proposed use of a many-objective
approach for water distribution system design or rehabilitation problems combining ε-NSGA-II and interactive visual analytics [6]. The main problem in the optimization methods in large scale case studies is complexity between computational efforts and large number of decision variables. Fu et al. (2011) screened insensitive decision variables using global sensitivity analysis as a screening tool to decrease the complexity of WDS multi-objective optimization problems [7].
This paper strives to solve the Battle of Background Leakage Assessment for Water Networks (BBLAWN) real-time design problem by using a multi objective evolutionary algorithm to reduce the cost incurred by background leakage, energy, pipeline rehabilitation and energy pump. In order to tackle large scale water distribution system, this paper suggests a sequential method to decrease the computer time use for solving the problem. Different optimization stages with increasing in complexity were designed and solved and the Pareto optimal frontier were fed into the next stage as an initial solution. More detail of the suggested method is described in the next sections.
2.Problem description
A brief problem description is presented here as further details can be found in WDSA2014 website of the BBLAWN [1]. The BBLAWN problem is mainly to control the leakage amount in the C-Town WDS by minimising three categories of costs including (1) pipes, pumps and tanks upgrading; (2) water loss and energy; (3) PCVs. The available facilities to achieve the minimum cost are: pipelines rehabilitation (replacement and duplication), pump scheduling and upgrading, tank upgrading, closing the pipelines using isolation valve and addition of PCVs. The constraints are: (1) minimum pressure of 20 meters in nodes with positive demands and positive pressure in nodes with no demand; (2) each tank has to have at least the same volume of water at the end of simulation in comparison with the beginning of the simulation; (3) pumps and throttle control valves cannot be controlled by PLC (e.g. by flow or time) and must be controlled by hydraulic conditions. The model is simulated for an extended period of one week with deterministic water demands in WDS.
3.Methodology
The proposed methodology used in this paper to solve this problem is a three-stage sequential optimisation models which are outlined below. During each stage an optimization model is used to obtain better solutions. The optimisation model used in all stages is non-dominated sorting genetic algorithm (NSGA-II) proposed by Deb et al. (2002) [8] and the simulation model used for the WDS is EPANET software tool (Rossman, 2000) [9]. A pressure driven demand method proposed by Germanopoulos (1985) is used for pipeline leakages calculation [10].
3.1.Stage #1
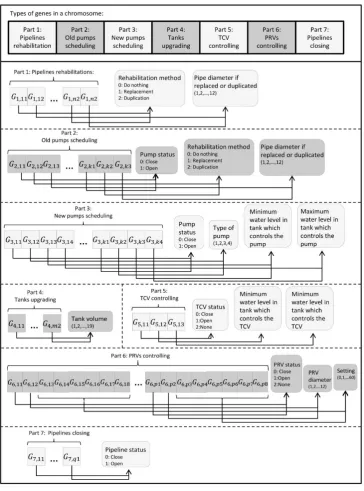
split into four parts as follows (see Fig. 2): (1) pipelines rehabilitation, consists of two genes for each pipeline which represent the rehabilitation method and the diameter of rehabilitation pipes; (2) scheduling of the existing pumps with three genes for each pump (i.e. status of the pump, minimum and maximum water level of the associated tanks controlling pump, i.e. switch on/ switch off); (3) scheduling of new pumps. It is assumed that only one new pump can be added to the each existing pump, so the relevant genes are the same with the last part of the chromosome plus a gene for identifying the type of the new pump; (4) tank size (volume) represented by one gene for each tank. The decision variables for controlling the throttle control valve (TCV) were not considered in the first stage. It is assumed that the TCV is switched on and off with the minimum and maximum level of tank T2, respectively. The number of decision variables of the first stage includes 286 for pipes rehabilitation, 11 for existing pumps, 11 potential new pumps which can be added to the WDS and 7 tanks. Therefore, the total number of the decision variables (genes) is 646 (i.e. 286×2+11×3+11×4+7). Note that it was assumed that only one pipeline rehabilitation method (duplication or replacement) can be applied for a pipe.
3.2.Stage #2
After acquiring some approximate near optimal results from optimising a quick optimisation model of the first stage, the eliminated pipes are restored to the WDS model in the second stage to calculate the real amount of water loss and energy cost accurately for the original C-Town network. The optimisation model is defined the same as the first stage with three additional decision variables for controlling the only TCV, status of the TCV, minimum and maximum water level of the tank T2 which controls the valve.
3.3.Stage #3
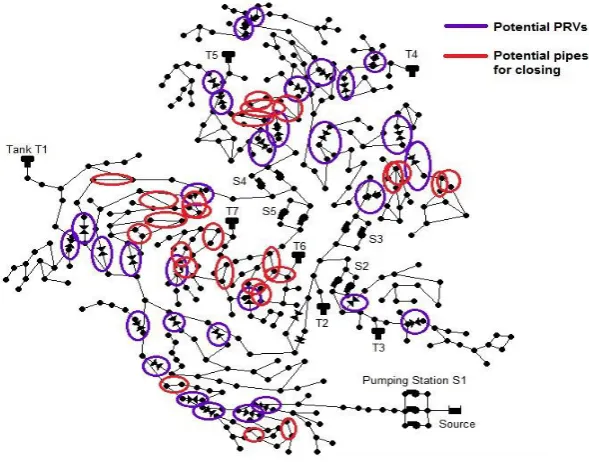
At this stage, the full network of the C-Town WDS including 25 potential PRVs located in the critical points of the C-Town WDS is considered for analysis (Fig. 1). The optimal pipeline rehabilitation of the branched pipes is identified at this stage for the first time and no other pipeline rehabilitation is considered for this stage. Also, adjusting PRVs settings over the period of simulation and finding the best pipelines for closing is also considered at this stage. Each chromosome at this stage is composed of seven branches for rehabilitation of pipelines, existing pump scheduling, additional pump scheduling, tank upgrading, PRVs settings, TCV settings and pipelines closing (Fig. 2). A three-objective optimization used at this stage is to minimize the costs of (1) pipelines rehabilitation, pumps and tanks upgrading; (2) water loss and energy; (3) pressure control valves. Based on the sensitivity analysis of the demand patterns, it is assumed that the PRVs settings are changed every four hours and thus 6 setting values are considered for each PRV. For conducting the optimisation problem of this stage, the initial solutions are picked up from three different points on the Pareto optimal front obtained in the second stage.
4.Results and discussion
The above methodology was applied to the case study. The number of generations conducted for stage 1, 2 and 3 is 1000, 1500 and 1500 iterations respectively. The NSGA-II parameters used in all stages were as follows: a population size of 110, three point crossover with random choice of locations of crossover with the probability of 0.9 and a mutation with the rate of probability of 0.1 for the pipeline rehabilitation genes and 0.15 for other genes. The optimisation models were run on a personal computer with these specifications: Intel(R) Core (TM) i7 – 4770 CPU @ 3.40 GHz, installed memory (RAM): 16 GB.
Fig. 1. Potential PRVs and Pipelines for closing in the third stage
Fig. 3. Representation of genes in a chromosome in third stage
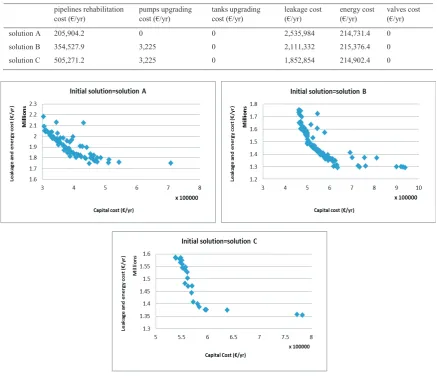
Table 1. Selected solutions from the second stage pipelines rehabilitation cost (€/yr)
pumps upgrading cost (€/yr)
tanks upgrading cost (€/yr)
leakage cost (€/yr)
energy cost (€/yr)
valves cost (€/yr)
solution A 205,904.2 0 0 2,535,984 214,731.4 0
solution B 354,527.9 3,225 0 2,111,332 215,376.4 0
solution C 505,271.2 3,225 0 1,852,854 214,902.4 0
Fig. 4. Pareto front obtained from the third stage
Fig. 5. Schematic representation of pipelines rehabilitation and leakage cost relationship
It can be noted that more than 550,000 €/year is needed to decrease the background leakage according to the Fig.
5. As shown in the figure, the maximum cost of pipelines rehabilitation is 700,000 €/year which can effect on the
leakage reduction in C-Town WDS. PRVs usage can be very efficient in C-Town WDS with point of view of decreasing the total cost (capital, operational and pressure control costs) of the system reducing the background leakages cost. PRVs cost varied from 0 to more than 40000 €/year in this result.
Finally, the solution selected for the BBLAWN committee is shown in table 2 as 583,622.3 €/year for capital cost
(579,489.3 €/year for pipelines rehabilitation, 4,133 €/year for pump upgrading and 0 €/year for tank upgrading),
1,367,501 €/year for operational cost (1,163,478 €/year for background leakage cost and 204,023 €/year for energy
cost) and 1,058 €/year for PRVs cost.
Table 2. Selected solution for introducing to the committee pipelines rehabilitation cost (€/year) pumps upgrading cost (€/year) tanks upgrading cost (€/year) leakage cost (€/year) energy cost (€/year) valves cost (€/year) selected solution
579,489.3 4,133 0 1,163,478 204,023 1,058
5.Conclusions
In this paper, the impacts of pipelines rehabilitation pump scheduling, tanks upgrading and PRVs controlling on background leakage of C-Town WDS were evaluated using three sequential optimization models. This paper presented a sequential multi-objective optimization simulation strategy in C-Town WDS in which background leakage amount was decreased by pipeline rehabilitation, pump, tank and pressure reduction valve additions, pipeline closing and TCV controlling. Computational efforts and time were reduced significantly using the proposed methodology which can be very promising to achieve some near optimal solutions and solve real life WDS problems with many decision variables using a small computer systems and limited capabilities.
References
[1] WDSA 2014, Battle of water networks, Bari, http://www.water-system.org/wdsa2014/?q=content/battle-water-networks
[2] L. S. Araujo, H. Ramos, S.T. Coelho, Pressure control for leakage minimisation in water distribution systems management, J. Water Resources Management 20(1) (2006) 133-149.
[3] D. Halhal, G.A. Walters, D. Ouazar, D.A. Savic, Water network rehabilitation with structured messy genetic algorithm, J. Water Resources Planning and Management. 123(3) (1997) 137-146.
[5] O. Giustolisi, D.A. Savic, Z.S. Kapelan, Pressure-driven demand and leakage simulation for water distribution networks, J. Hydraulic Engineering 134(5) (2008) 626-635.
[6] G. Fu, Z. Kapelan, J.R. Kasprzyk, P. Reed, Optimal design of water distribution systems using many-objective visual analytics, J. Water Resources Planning and Management, 139(6) (2012) 624-633.
[7] G. Fu, Z. Kapelan, P. Reed, Reducing the Complexity of Multiobjective Water Distribution System Optimization through Global Sensitivity Analysis. J. Water Resources Planning and Management 138(3) (2011) 196-207.
[8] K. Deb, A. Pratap, S. Agarwal, T.A.M.T. Meyarivan, A fast and elitist multiobjective genetic algorithm: NSGA-II. Evolutionary Computation, IEEE Transactions on 6(2) (2002) 182-197.
[9]L.A. Rossman, EPANET 2, United States Environmental Protection Agency (2000).