This is the peer reviewed version of an accepted journal article – Diagnostic accuracy of tests based on radiologic measurements of dogs and cats: a systematic review – which has been published in final form at http://dx.doi.org/10.1111/vru.12217.
This article may be used for non-commercial purposes in accordance with the publisher’s self-archiving policy, which can be found at http://olabout.wiley.com/WileyCDA/Section/id-820227.html.
The full details of the published version of the article are as follows:
TITLE: Diagnostic accuracy of tests based on radiologic measurements of dogs and cats: a systematic review
AUTHORS: Christopher R. Lamb and Justin R. Nelson
JOURNAL TITLE: Veterinary Radiology and Ultrasound
VOLUME/EDITION: 56/3
PUBLISHER: Wiley
PUBLICATION DATE: 22 October 2014 (online)
Diagnostic accuracy of tests based on radiologic measurements of dogs and cats: a 1
systematic review 2
Christopher R. Lamb, Justin R. Nelson 3
4
From the Department of Clinical Sciences and Services, The Royal Veterinary College, 5
University of London. 6
Address correspondence to: C.R. Lamb, Department of Clinical Sciences and Services, The 7
Royal Veterinary College, Hawkshead Lane, North Mymms, Hertfordshire AL9 7TA, U.K. 8
Email: [email protected] 9
10
Key words: diagnostic test accuracy, measurement, radiology, systematic reviews 11
Abstract 13
A systematic review of diagnostic tests based on radiologic measurements of structures in 14
dogs and cats was done in order to reach generalizable conclusions about the value of making 15
such measurements. Literature search was done using the ISI Web of KnowledgeSM for 16
studies in the subject category Veterinary sciences. Studies were eligible for inclusion that 17
employed length, angle, area or volume measurements from radiographic, ultrasonographic, 18
CT or MR images of dogs or cats as a diagnostic test for a naturally-occurring condition, 19
compared the results of imaging with a reference standard, included at least 10 subjects, and 20
sufficient data that a 2x2 table of results could be constructed. Quality of studies was assessed 21
using the QUADAS-2 tool. Twenty-six studies were found describing 40 tests that satisfied 22
the inclusion criteria. Tests were radiographic in 22 (55%) instances and ultrasonographic in 23
18 (45%). Quality of studies was generally low, with a risk of bias in patient selection in 92% 24
studies, performance of the index test in 73% studies, and patient flow in 42% studies. 25
Median (range) number of subjects was 64 (20-305), sensitivity was 77% (38-99%), 26
specificity was 82% (50-99%), positive likelihood ratio was 4.1 (1-103), and negative 27
likelihood ratio was 0.29 (0.01-1). Two studies that compared accuracy of radiographic 28
measurements to subjective image interpretation alone found no difference. Evidence is weak 29
that radiologic measurements of structures in dogs and cats are useful for diagnosis, hence 30
measurements should not be emphasized as a basis for diagnosis in either teaching or clinical 31
Introduction 33
“When you can measure what you are speaking about, and express it in numbers, you know 34
something about it; but when you cannot measure it, when you cannot express it in numbers, 35
your knowledge is of a meagre and unsatisfactory kind.” William Thomson, quoted by Keats 36
and Sistrom.1 37
“A radiologist with a ruler is a radiologist in trouble,” Ben Felson.2
38
These quotations illustrate two different opinions about the use of measurements, albeit for 39
different purposes. William Thomson, a mathematician and engineer3 is recognized for his 40
work in thermodynamics, including determining −273.15C to be the value of absolute zero.* 41
He considered accurate measurement to be essential for physical science research. Ben 42
Felson, a clinical radiologist4, is recognized for his remarkable understanding of thoracic 43
radiographs and his innovative teaching.† His quote reflects an emphasis on subjective 44
judgment of shadows as a means of diagnosis – basically, if you don’t know the diagnosis 45
after looking carefully at the radiographs, making a measurement is unlikely to help you. 46
Regardless of this point of view, radiographic anatomy textbooks1,5 include numerous 47
examples of documented methods of measurement, and studies describing measurement of 48
structures in diagnostic images are published frequently. For example, of 52 original 49
investigations published in Veterinary Radiology & Ultrasound in 2013, 18 (35%) were 50
primarily about use of measurements. Measurement of organs and structures is done 51
frequently to supplement the descriptive part of an imaging report, to help identify an 52
abnormality, such as a foreign object, or to describe the severity of a condition, such as an 53
angular limb deformity. In animals having repeated imaging, comparison with previous 54
* Ennobled in 1892 as Lord Kelvin. Absolute temperatures are stated in units of Kelvin in his honor.
measurements provides objective evidence of the progression of disease or the effect of 55
treatment.6 Radiologic measurements may also be used as the basis for diagnosis, and it is
56
that application that is the focus of the present study. The term radiologic is used here to 57
embrace all the diagnostic imaging modalities commonly applied to clinical veterinary 58
patients. 59
It is uncertain what proportion of veterinary radiologists routinely use and/or teach use of 60
radiologic measurements as the basis for diagnosis. Anecdotal evidence suggests that certain 61
methods of radiologic measurement, such as the vertebral heart scale7, are used routinely in 62
many practices, but conversely some teachers discourage use of the vertebral heart scale. 63
Anecdotal evidence also suggests there is a demand from primary care veterinarians for the 64
results of measurements to be included routinely in imaging reports produced by Board-65
certified radiologists based on a belief that such results are important for diagnosis. Students, 66
primary care veterinarians, and radiologists may benefit from more information about the 67
diagnostic value of making measurements of structures in radiologic images, hence a 68
systematic review of the literature is indicated. 69
Systematic reviews attempt to collect and appraise all the empirical evidence applicable to a 70
given research question.8-10 The primary purpose of systematic reviews is to facilitate
71
healthcare decision-making by clinicians, administrators and policy makers by providing 72
high-level evidence of benefit, risks and harms associated with healthcare.10 Systematic 73
reviews of diagnostic test accuracy are done to estimate test performance, to evaluate the 74
methodological quality of primary studies, and to explain variations in findings between 75
studies .8-13 When primary studies are relatively homogeneous, synthesis across studies may
76
The aim of the present study was to systematically review studies reporting diagnostic 78
accuracy of tests based on radiologic measurements of dogs and cats in order to reach 79
generalizable conclusions about the value of making such measurements. 80
81
Methods 82
Conduct of this review followed guidelines in the PRISMA Statement.10 83
Search 84
The search for published studies about diagnostic accuracy of radiologic measurements was 85
done on 25th June 2013 using the ISI Web of KnowledgeSM (Thomson Reuters) for all years 86
represented in the database. The search was refined to those studies in the research domain 87
Science technology and in the subject category Veterinary sciences. Three initial search 88
criteria were used: 1, within the title, the search terms were veterinary or canine or feline or 89
equine or dog or cat or horse; 2, also within the title, the search terms were imaging or 90
ultraso* or sono* or echo* or radiograph* or x-ray or CT or MR or magnetic resonance or 91
computed tomograph*; 3, within topic, the search terms measure* or size or thick* or quanti* 92
or diagnos*. Quotations were not used to allow for lemmatization and no language 93
restrictions were applied. As a means of assessing the completeness of the search, 6 papers 94
about radiologic measurement studies published in non-imaging veterinary journals in the 95
period 1987-2000, and already held on file by the authors, were used as sentinels, i.e. failure 96
of the search to retrieve these papers would indicate that it was incomplete. Reference lists of 97
papers reviewed in full were also searched for additional applicable studies. Retrieved articles 98
were imported into a citation database (Endnote 9.0, Thomson Corporation, San Francisco, 99
Studies eligible for inclusion were those that employed length, angle, area or volume 101
measurements from radiographic, ultrasonographic, computed tomographic (CT) or magnetic 102
resonance (MR) images of dogs or cats as a diagnostic test for a naturally-occurring 103
condition; compared results of imaging with a reference standard; included at least 10 104
animals as subjects; and included sufficient data that a 2x2 table of results could be 105
constructed. The titles of all studies retrieved by initial search were reviewed independently 106
by both investigators to identify studies about use of imaging to examine dogs or cats or 107
horses. Studies of normal animals and studies with horses as subjects were noted for possible 108
future use, but were excluded from the review. Retained studies that had cats or dogs as 109
subjects were reviewed by abstract, and studies retained on the basis of the abstract were 110
reviewed in full. At each stage of the review process, investigators compared their results and 111
resolved differences by discussion. 112
Quality assessment 113
Methodological quality of studies that satisfied the inclusion criteria was assessed using the 114
QUADAS-2 (Quality Assessment of Diagnostic Accuracy Studies) tool.14 Quality was 115
assessed on the basis of studies rather than individual tests because tests within a study used 116
the same methods, which allowed the presentation of results to be simplified. No 117
modifications to the signaling questions included in this tool14 were considered necessary. 118
Each investigator reviewed independently the methods sections of papers describing studies 119
that satisfied the inclusion criteria with respect to 4 key domains (patient selection, the index 120
test, the reference standard, and patient flow and timing), and answered relevant signaling 121
questions according to QUADAS-2 methodology. For each domain, the risk of bias was 122
recorded as low, high or unclear. Risk of bias was considered low if all signaling questions in 123
a domain were answered ‘yes’; if any signaling question was answered ‘no’, the potential for 124
target condition. The unclear category was used when insufficient data were reported to 126
permit a judgment. Investigators compared their results and resolved any differences by 127
discussion. Similarly, for each domain, concern about applicability of retrieved studies to the 128
present review was judged to be low, high or unclear. 129
Measures of accuracy 130
For each study that satisfied the inclusion criteria, study design, use of retrospective or 131
prospective data collection, total number of subjects, and the numbers of true positives, true 132
negatives, false positives and false negatives were recorded. Each investigator reviewed 133
independently the results sections of papers to extract these data, compared their results and 134
resolved any differences by repeat review. The results of any study with zero false positives 135
or false negatives were modified by adding 0.5 subjects into each cell of the 2x2 table.9 This 136
procedure (Haldane correction) was necessary in order to calculate likelihood ratios for these 137
studies. Sensitivity, specificity, positive (PLR) and negative (NLR) likelihood ratios, and 138
their respective binomial 95% confidence intervals (95% CI) were calculated using the stats 139
calculator available online at the Center for Evidence-based Medicine, University of Toronto 140
(http://ktclearinghouse.ca/cebm/practise/ca/calculators/statscalc). The prevalence of diseased 141
subjects in each study was also calculated. 142
Sensitivity and specificity estimates from all studies that satisfied the inclusion criteria were 143
included in a summary receiver-operating characteristic (sROC) plot using Review Manager 144
5.2 (Cochrane Collaboration http://tech.cochrane.org/revman/download). Paired forest plots 145
of sensitivity and specificity were also created for visual assessment of study heterogeneity. 146
147
Results 148
Initial literature search found 4,264 papers, which were reduced to 244 on the basis of title, to 150
43 of the basis of abstract, and to 26 by detailed review15-40 (figure 1). All sentinel papers
151
were retrieved by the search. Papers were published in the period 1986-2012 in 10 different 152
journals with 8 (31%) papers in Journal of Veterinary Internal Medicine, 5 (19%) in 153
Veterinary Radiology & Ultrasound, 3 (12%) in Journal of the American Veterinary Medical 154
Association, 3 (12%) in the Veterinary Record, 2 (8%) in Journal of Small Animal Practice, 155
and one paper in each of 5 other journals. 156
Of the 26 papers retrieved describing studies that satisfied the inclusion criteria, 8 reported 157
multiple index tests for a total of 40 analyzable tests. Tests were radiographic in 22 (55%) 158
instances (including one CT test) (Table 1) and ultrasonographic in 18 (45%) (Table 2). No 159
eligible MR studies were retrieved by the search. Study design was case-control in 36 (90%) 160
instances and cross-sectional in 4 (10%). Data collection was retrospective in 26 (65%) 161
studies, prospective in 6 (15%), and unclear in 8 (20%). The median (range) number of 162
subjects was 64 (20-305). Tests applied to canine conditions in 29 (73%) instances, feline 163
conditions in 9 (23%), and both dogs and cats in the remaining 2 (4%). 164
Quality assessment 165
Results of quality assessment of the radiographic tests and ultrasonographic tests are 166
summarized in tables 3 and 4, respectively. Overall, risk of bias in patient selection was 167
considered high in 24 (92%) studies mainly because case-control study design was not 168
avoided in 23 (89%) studies, and patients were not collected in randomized or consecutive 169
order in 17 (65%) studies. Healthy subjects were included in the control group used for 170
calculation of test accuracy in 14 (54%) studies. Risk of bias in performance of the index test 171
was considered high in 19 (73%) studies primarily because the cut-off point was applied 172
retrospectively in 22 (85%) studies. Risk of bias in performance of the reference standard was 173
correctly classify all patients in 2 (8%) studies. Risk of bias arising from patient flow and/or 175
timing of procedures was considered high in 11 (42%) studies primarily because not all 176
patients were subjected to the same reference standard in 17 (65%) studies. Description of 177
study methods was incomplete in many instances. For example, insufficient data were 178
provided to conclude that the index test was interpreted without knowledge of the results of 179
the reference standard in 12 (46%) studies or that the reference standard was interpreted 180
without knowledge of the results of the index test in 11 (42%) studies. Concern about the 181
applicability of retrieved studies to the present review was considered low in all instances. 182
Measures of accuracy 183
Overall, the median (range) sensitivity was 77% (38-99%), specificity was 82% (50-99%), 184
positive likelihood ratio was 4.1 (1-103), negative likelihood ratio was 0.29 (0.01-1), and 185
prevalence was 37% (10-79%). Only 13 (32%) tests had PLR >10 and only 10 (25%) tests 186
had NLR <0.1. 187
Measures of accuracy for radiographic tests and ultrasonographic tests are summarized in 188
tables 5 and 6, respectively. Subjective assessment of sROC plots (figure 2) and paired forest 189
plots of sensitivity and specificity (figure 3) revealed a high level of heterogeneity for results 190
of both radiographic and ultrasonographic tests. In general, confidence intervals were wider 191
for tests based on radiographic measurements and included 50% in several instances. 192
Specificity estimates for several tests based on ultrasonographic measurements were close to 193
100%. 194
For the sub-group of 14 radiographic tests for cardiac or pericardial disease that were based 195
on measurements of the cardiac silhouette, the median (range) sensitivity was 76% (40-90%), 196
likelihood ratio was 0.32 (0.15-0.71). Area under the sROC curve for this sub-group was 198
subjectively slightly less than that for all radiographic tests (figure 4). 199
For the sub-group of 5 ultrasonographic tests for adrenal endocrinopathy that were based on 200
measurement of adrenal gland thickness, the median (range) sensitivity was 77% (73-97%), 201
specificity was 94% (80-98%), positive likelihood ratio was 12.5 (3.9-52), and negative 202
likelihood ratio was 0.24 (0.04-0.29). Area under the sROC curve for this sub-group appeared 203
to be the same as that for all ultrasonographic tests (figure 5). 204
205
Discussion 206
Search 207
Radiologic measurements used in studies retrieved by search were predominantly linear15,33 208
or ratio20,21,26,27,36, with relatively few examples of angle28, area18 or volume17,32
209
measurements. The studies retrieved by this search represent a more heterogeneous group 210
than is usually obtained by systematic reviews focused on a single diagnosis. Retrieved 211
studies of radiologic measurements varied with species, modality, anatomy, diagnosis, study 212
design, measurement method, and cut-off points, hence the differences observed between 213
studies reflect real differences in study procedures and patients. As a result, there was limited 214
potential for meta-analysis. In order to optimally compare measures of test accuracy obtained 215
in different studies retrieved by systematic review, it is necessary for the definition of disease 216
to be constant, the same test must be used, the thresholds between categories of test result 217
(i.e. positive and negative) must be constant, and the spectrum of patients studied must be 218
similar with respect to prevalence and severity of disease.8-10,41 Useful synthesis of test
219
results may still be possible if some of these criteria are not satisfied; however, none of these 220
in scope in order to enable generalizable conclusions about the diagnostic value of making 222
radiologic measurements. 223
It is noteworthy that 169 papers describing radiologic measurements of normal subjects were 224
retrieved by search (figure 1), which is a much larger number than papers about radiologic 225
measurements for diagnostic purposes. This difference suggests that the majority of reported 226
anatomic measurements have either not been tested for diagnostic use or not found to be 227
useful clinically. These possibilities merit further study. 228
Quality assessment 229
It is important to consider the methodologic quality of studies reporting accuracy of 230
diagnostic tests because differences in study design are associated with significant variations 231
in results.12 Abundant guidance is available to promote higher standards of methodological 232
quality in clinical research studies, including the STARD guidelines for reporting studies of 233
diagnostic accuracy42, the STROBE guidelines for observational studies43, and the 234
CONSORT guidelines for reporting randomized trials.44 QUADAS-2 was developed 235
specifically as a tool to assesses methodological quality of primary studies in order to identify 236
risks of bias in the results of studies retrieved by systematic review.13-15 Methodological 237
weaknesses contributing to exaggerated results for diagnostic imaging tests can be found in 238
many studies.12,45,46 Of the various methodological weaknesses that make studies vulnerable 239
to bias, the most serious are non-consecutive inclusion of patients, retrospective data 240
collection, and use of healthy control subjects.12 Multiple methodological weaknesses were 241
identified in the studies retrieved by search, including case-control design (89% studies), post 242
hoc determination of cut-off value (85% studies), non-consecutive inclusion of patients (at 243
least 65% studies), use of multiple reference tests for patients under study (65% studies), and 244
retrospective data collection (at least 58% studies). Incomplete reporting of methods is 245
frequently in studies retrieved by the present systematic review. None of the studies retrieved 247
by the present systematic review had a low risk of bias in all methodological domains. 248
Healthy subjects were included in the control group used for calculation of test accuracy in 249
54% studies. Studies of diagnostic tests that use healthy volunteers as a control group may be 250
useful as ‘Phase 1’ research, which aims to identify tests with potential clinical utility, but 251
these results cannot be assumed to apply in a clinical setting in which all test subjects are 252
patients.47 A control group for ‘Phase 2’ studies intended to estimate test accuracy in clinical
253
patients should comprise subjects who are identical to the test or treatment group in all 254
aspects that affect the outcome except the variable, result or intervention being studied.48,49 255
Failure to utilize a suitably comparable control group is a frequent methodological flaw in 256
clinical research papers.12,45,46,50 For example, the study by Eom et al22 described use of 257
ultrasonography to measure the width of the tracheal rings and reported that thoracic inlet 258
tracheal ring width-first tracheal ring width ratio >1.4 was a highly accurate test for tracheal 259
collapse in small breed dogs. Eom et al reported zero false negatives and zero false positives 260
(sensitivity and specificity = 100%), i.e. there was a complete lack of overlap in tracheal 261
dimensions of affected and control dogs. Unfortunately, this finding is unrealistic because 262
dogs of breeds prone to collapsing trachea, such as Yorkshire terriers and Pomeranians, have 263
a congenital defect in tracheal cartilage that gets gradually weaker over time51, and it is the 264
occurrence of a comorbidity, such as cardiac disease, heat stress, endotracheal intubation or 265
exposure to smoke, that triggers clinical signs.52,53 Hence any representative sample of dogs 266
at risk of tracheal collapse should include dogs with a continuous range of tracheal 267
dimensions and degrees of tracheal collapse from normal to markedly abnormal. The wide 268
separation between case and control groups in this study is an example of selection bias12,48 269
that will inflate estimates of sensitivity and specificity. It should also be noted that dogs in 270
is insensitive for tracheal collapse54, and therefore not suitable as a reference test for this 272
condition. This is an example of imperfect-standard bias.48
273
Measures of accuracy 274
Overall, the accuracy of diagnostic tests based on radiologic measurements was moderate, 275
with median sensitivity 77% and specificity 82%. In many instances the confidence intervals 276
for estimates of sensitivity and specificity were very wide, which is a function of analyzing 277
small numbers of subjects.55 The results of several of the studies with low numbers of
278
subjects included zero false negatives or false positives. Calculations using these data result 279
in sensitivity or specificity of 100% and likelihood ratios equal to infinity or zero. To avoid 280
extreme calculated values, the results of any study with zero false positives or false negatives 281
were modified by adding 0.5 subjects into each cell of the 2x2 table.9 This approach 282
produced slightly more conservative estimates for these studies. Likelihood ratios were 283
calculated for studies retrieved by search because they give an indication of a test's ability to 284
rule in or rule out a condition.56 High likelihood ratios (e.g. PLR >10) indicate that the test 285
may be useful to rule in disease, while low likelihood ratios (e.g. NLR <0.1) may be useful to 286
rule out disease. In this series, only 13 (32%) tests had PLR >10 and only 10 (25%) tests had 287
NLR <0.1. 288
Sub-group analysis of the 14 radiographic tests based on measurements of the cardiac 289
silhouette found modest diagnostic performance with a subjectively reduced area under the 290
sROC curve for this sub-group than that for all radiographic tests. The range encompassed by 291
these results likely reflects differences in cardiac pathophysiology between cats and dogs and 292
between canine breeds, which have differing predisposition to cardiac conditions.57 For
293
example, conditions that result in cardiac dilatation or eccentric hypertrophy are more likely 294
to cause a recognizable increase in the external dimensions of the heart than conditions 295
Sub-group analysis of the 5 ultrasonographic tests that were based on measurement of adrenal 297
gland thickness found a similar area under the sROC curve for this sub-group as for all 298
ultrasonographic tests. Although diagnosis of adrenal gland dysfunction depends primarily on 299
endocrinologic testing, ultrasonography has a potential role as a means of supporting a 300
diagnosis of adrenal gland dysfunction59,60, and in distinguishing adrenal-dependent from 301
pituitary-dependent hyperadrenocorticism.16 However, the finding that 3 of the 5 302
ultrasonographic tests for adrenal endocrinopathy included in this review had zero false 303
positives or false negatives indicates that these estimates of diagnostic performance are 304
probably inflated. Although a perfect diagnostic test would have zero false positives or false 305
negatives, this is not a realistic expectation. In clinical practice, inconclusive results are 306
inevitable and should be reported in studies about diagnostic tests.61 Given that few studies 307
about diagnostic tests report sample size calculations55, it is suggested that zero false
308
positives or false negatives could be considered a post hoc criterion of inadequate sample 309
size. 310
The moderate median values for sensitivity and specificity of tests based on radiologic 311
measurements included in the present review primarily reflect the fact that the normal size 312
ranges for many anatomical structures are very wide, hence there is marked overlap between 313
normal and pathologic ranges.62 In this respect it is noteworthy that dogs exhibit enormous 314
phenotypic variation compared to other mammals63-65, which makes them particularly ill-315
suited to diagnosis based on measurement because that variation exaggerates the overlap 316
between normal and abnormal ranges. Even for structures that would not be expected to vary 317
greatly with conformation, wide normal size ranges may be observed. For example, 318
abdominal lymph nodes in dogs are variable in size and number in CT images66, which 319
complicates interpretation of size in clinical patients. In humans, differences in interpretation 320
scans of cancer patients.67 The association between lymph node size and occurrence of 322
metastasis to that node appears to be relatively weak, hence assessment of lymph node size 323
alone is insufficient for accurate clinical staging of neoplasia, such as oral malignant 324
melanoma in dogs.68 When a significant risk of lymphatic metastasis exists, cytologic or 325
histologic examination of regional lymph nodes is indicated, regardless of the size of those 326
nodes.68 327
Limitations 328
Systematic reviews often use a multiple electronic databases to maximize the likelihood of 329
retrieving all available empirical evidence. The present study was based on a search done 330
using only the ISI Web of KnowledgeSM. We chose this approach because this database 331
includes over 140 veterinary journals, because it interfaces directly with our preferred citation 332
database, and for simplicity. This search strategy satisfies the minimum recommendations of 333
the PRISMA Statement10; however, it is possible that additional applicable studies might 334
have been retrieved if the search had used multiple electronic databases. 335
In typical test research, the use of an individual diagnostic test is evaluated in order to 336
estimate sensitivity and specificity; however, this kind of test research is only pertinent to 337
clinical situations in which diagnosis is likely to be based on the results of that one test (such 338
as screening).69,70 In usual clinical practice, the results of a test are always judged in the 339
context of existing information, including results of prior tests, and a more relevant objective 340
of diagnostic test performance assessment is to identify the added value (i.e. the incremental 341
increase in diagnostic accuracy) that occurs when the test is used.70 Robust estimates of the 342
added value of diagnostic tests require multivariable methods, in which the probability of 343
disease is a function of all diagnostic variables.70 Many authors of studies included in the 344
present systematic review over-estimated the potential diagnostic impact of radiologic 345
taking into account the accuracy of concurrent subjective image interpretation. The two 347
studies that compared accuracy of radiologic measurements to subjective image interpretation 348
alone for dogs with suspected intestinal obstruction20 and dogs with suspected cardiac 349
disease26 found no differences. In other words, observers making radiologic measurements 350
were no more accurate than when they relied on subjective assessment alone. These findings 351
applied equally to experienced and inexperienced observers.20,26 352
Use of measurements may seem appealing to those who are uncertain about their ability to 353
reach correct conclusions based on subjective assessment of the images alone. Although 354
radiologic measurements (e.g. the vertebral heart scale7) have been recommended for use by 355
inexperienced observers, these same observers may have difficulty making the measurements 356
if selection of landmarks relies on subjective interpretation.20 Furthermore, emphasis on 357
measurements is unwarranted when the pathologic effects of disease are invariably multiple 358
and all the imaging signs must be recognized for optimal interpretation. The trained eye and 359
brain can integrate multiple features that cannot be described with a single measurement.71-73 360
Radiologic interpretation is a skill that must be refined by experience rather than by recourse 361
to measurements.74 362
363
Conclusions 364
For tests based on radiologic measurements that were included in this systematic review, 365
median sensitivity and specificity were only moderate, estimates of test accuracy in many 366
instances were likely exaggerated because of deficiencies in study methodology, and 367
observers making radiologic measurements were no more accurate than when they relied on 368
subjective assessment alone. Overall, evidence is weak that radiologic measurements of 369
measurements may have value in the descriptive part of a radiology report, they should not be 371
emphasized as a basis for diagnosis in either teaching or clinical imaging reports. 372
373
Acknowledgements 374
We thank Sally Burton of the Library and Information Services Division of The Royal 375
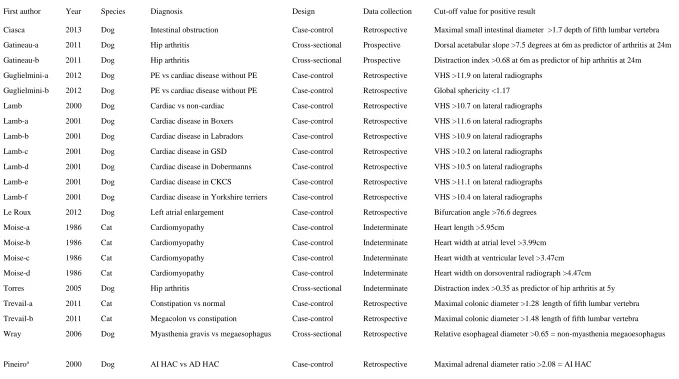
Table 1. Summary of diagnostic tests based on radiographic measurements 377
378
First author Year Species Diagnosis Design Data collection Cut-off value for positive result
Ciasca 2013 Dog Intestinal obstruction Case-control Retrospective Maximal small intestinal diameter >1.7 depth of fifth lumbar vertebra
Gatineau-a 2011 Dog Hip arthritis Cross-sectional Prospective Dorsal acetabular slope >7.5 degrees at 6m as predictor of arthritis at 24m
Gatineau-b 2011 Dog Hip arthritis Cross-sectional Prospective Distraction index >0.68 at 6m as predictor of hip arthritis at 24m
Guglielmini-a 2012 Dog PE vs cardiac disease without PE Case-control Retrospective VHS >11.9 on lateral radiographs
Guglielmini-b 2012 Dog PE vs cardiac disease without PE Case-control Retrospective Global sphericity <1.17
Lamb 2000 Dog Cardiac vs non-cardiac Case-control Retrospective VHS >10.7 on lateral radiographs
Lamb-a 2001 Dog Cardiac disease in Boxers Case-control Retrospective VHS >11.6 on lateral radiographs
Lamb-b 2001 Dog Cardiac disease in Labradors Case-control Retrospective VHS >10.9 on lateral radiographs
Lamb-c 2001 Dog Cardiac disease in GSD Case-control Retrospective VHS >10.2 on lateral radiographs
Lamb-d 2001 Dog Cardiac disease in Dobermanns Case-control Retrospective VHS >10.5 on lateral radiographs
Lamb-e 2001 Dog Cardiac disease in CKCS Case-control Retrospective VHS >11.1 on lateral radiographs
Lamb-f 2001 Dog Cardiac disease in Yorkshire terriers Case-control Retrospective VHS >10.4 on lateral radiographs
Le Roux 2012 Dog Left atrial enlargement Case-control Retrospective Bifurcation angle >76.6 degrees
Moise-a 1986 Cat Cardiomyopathy Case-control Indeterminate Heart length >5.95cm
Moise-b 1986 Cat Cardiomyopathy Case-control Indeterminate Heart width at atrial level >3.99cm
Moise-c 1986 Cat Cardiomyopathy Case-control Indeterminate Heart width at ventricular level >3.47cm
Moise-d 1986 Cat Cardiomyopathy Case-control Indeterminate Heart width on dorsoventral radiograph >4.47cm
Torres 2005 Dog Hip arthritis Cross-sectional Indeterminate Distraction index >0.35 as predictor of hip arthritis at 5y
Trevail-a 2011 Cat Constipation vs normal Case-control Retrospective Maximal colonic diameter >1.28length of fifth lumbar vertebra
Trevail-b 2011 Cat Megacolon vs constipation Case-control Retrospective Maximal colonic diameter >1.48 length of fifth lumbar vertebra
Wray 2006 Dog Myasthenia gravis vs megaesophagus Cross-sectional Retrospective Relative esophageal diameter >0.65 = non-myasthenia megaoesophagus
Pineiroa 2000 Dog AI HAC vs AD HAC Case-control Retrospective Maximal adrenal diameter ratio >2.08 = AI HAC
379
PE, pericardial effusion; GSD, German shepherd dog; CKCS, Cavalier King Charles spaniel; AI, adrenocorticotropic hormone independent; AD, adrenocorticotropic hormone dependent; HAC,
380
hyperadrenocorticism
381
a CT test
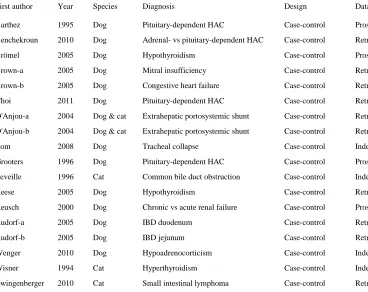
Table 2. Summary of diagnostic tests based on ultrasonographic measurements 383
384
First author Year Species Diagnosis Design Data collection Cut-off value for positive result
Barthez 1995 Dog Pituitary-dependent HAC Case-control Prospective Left adrenal gland maximal diameter >7.4mm
Benchekroun 2010 Dog Adrenal- vs pituitary-dependent HAC Case-control Retrospective For adrenal gland dependent HAC, thickness of smaller gland <5mm
Brömel 2005 Dog Hypothyroidism Case-control Prospective Total thyroid gland volume <424.6mm^3
Brown-a 2005 Dog Mitral insufficiency Case-control Retrospective Index of change in left ventricular internal area >2.1
Brown-b 2005 Dog Congestive heart failure Case-control Retrospective Index of left atrial dimension >1.55 for heart failure
Choi 2011 Dog Pituitary-dependent HAC Case-control Retrospective Left adrenal maximal diameter >6.0mm
D'Anjou-a 2004 Dog & cat Extrahepatic portosystemic shunt Case-control Retrospective Portal vein-aorta ratio <0.65
D'Anjou-b 2004 Dog & cat Extrahepatic portosystemic shunt Case-control Retrospective Portal vein-caudal vena cava ratio <0.70
Eom 2008 Dog Tracheal collapse Case-control Indeterminate Thoracic inlet tracheal ring width-first tracheal ring ratio >1.4
Grooters 1996 Dog Pituitary-dependent HAC Case-control Prospective Either adrenal gland >7mm thick
Leveille 1996 Cat Common bile duct obstruction Case-control Indeterminate Common bile duct diameter 5mm or more
Reese 2005 Dog Hypothyroidism Case-control Retrospective Thyroid gland volume (<0.05ml/kg)
Reusch 2000 Dog Chronic vs acute renal failure Case-control Prospective Parathyroid maximal longitudinal dimension >4mm = Chronic renal failure
Rudorf-a 2005 Dog IBD duodenum Case-control Retrospective Duodenal wall thickness >4.2mm
Rudorf-b 2005 Dog IBD jejunum Case-control Retrospective Jejunal wall thickness >3.3mm
Wenger 2010 Dog Hypoadrenocorticism Case-control Indeterminate Left adrenal gland thickness <3.2mm
Wisner 1994 Cat Hyperthyroidism Case-control Indeterminate Total thyroid gland volume >215 mm^3
Zwingenberger 2010 Cat Small intestinal lymphoma Case-control Retrospective Muscularis layer thickness >0.5 submucosal layer thickness
385
HAC, hyperadrenocorticism; IBD, inflammatory bowel disease
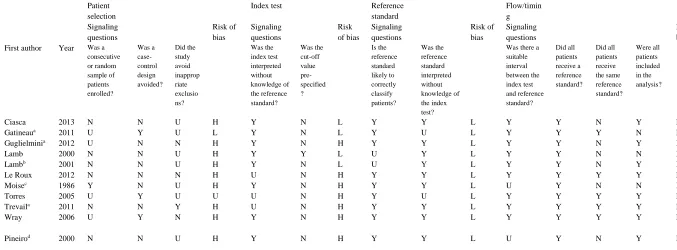
Table 3. Results of methodological quality assessment of radiographic measurement studies retrieved by systematic review 387
388
Patient selection
Index test Reference
standard Flow/timin g Signaling questions Risk of bias Signaling questions Risk of bias Signaling questions Risk of bias Signaling questions Risk of bias First author Year Was a
consecutive or random sample of patients enrolled? Was a case-control design avoided? Did the study avoid inapprop riate exclusio ns? Was the index test interpreted without knowledge of the reference standard? Was the cut-off value pre-specified ? Is the reference standard likely to correctly classify patients? Was the reference standard interpreted without knowledge of the index test?
Was there a suitable interval between the index test and reference standard? Did all patients receive a reference standard? Did all patients receive the same reference standard? Were all patients included in the analysis?
Ciasca 2013 N N U H Y N L Y Y L Y Y N Y L
Gatineaua 2011 U Y U L Y N L Y U L Y Y Y N L
Guglielminia 2012 U N N H Y N H Y Y L Y Y N Y H
Lamb 2000 N N U H Y Y L U Y L Y Y N N H
Lambb 2001 N N U H Y N L U Y L Y Y N Y H
Le Roux 2012 N N N H U N H Y Y L Y Y Y Y L
Moisec 1986 Y N U H Y N H Y Y L U Y N N H
Torres 2005 U Y U U U N H Y U L Y Y Y Y L
Trevaila 2011 N N Y H U N H Y Y L Y Y Y Y L
Wray 2006 U Y N H Y N H Y Y L Y Y Y Y L
Pineirod 2000 N N U H Y N H Y Y L U Y N Y L
389
Y, yes; N, no; H, high; L, low; U, unclear (insufficient data).
390
Table 4. Results of methodological quality assessment of ultrasonographic measurement studies retrieved by systematic review
392 393
Patient selection
Index test Reference
standard Flow/timing Signaling questions Risk of bias Signaling questions Risk of bias Signaling questions Risk of bias Signaling questions Risk of bias First author Year Was a
consecutive or random sample of patients enrolled? Was a case-control design avoided? Did the study avoid inapprop riate exclusio ns? Was the index test interpreted without knowledge of the reference standard? Was the cut-off value pre-specified ? Is the reference standard likely to correctly classify patients? Was the reference standard interpreted without knowledge of the index test?
Was there a suitable interval between the index test and reference standard? Did all patients receive a reference standard? Did all patients receive the same reference standard? Were all patients included in the analysis?
Barthez 1995 N N N H U Y L Y U L U N N Y H
Benchekroun 2010 N N N H Y N H Y U L U Y N Y H
Bromel 2005 U N N H Y N H Y Y L Y Y N Y L
Browna 2005 N N N H N N H Y N H U Y Y Y L
Choi 2011 U N N H U N H Y U L U N N Y H
D'Anjoua 2004 N N U H U N H Y U L U Y N N H
Eom 2008 N N N H U N H N U H U Y Y Y L
Grooters 1996 N N U H U N H Y U L U Y N Y H
Leveille 1996 N N U H Y N H N U H U Y N Y H
Reese 2005 N N N H Y N H Y Y L Y Y N Y L
Reusch 2000 N N U H U N H Y U L U Y N U H
Rudorfa 2005 N N U H Y Y L Y Y L U Y Y Y L
Wenger 2010 U N U H Y N H Y Y L Y Y N Y L
Wisner 1994 U N Y H N N H Y Y L Y Y N Y L
Zwingenberger 2010 N N Y H U Y L Y Y L N Y Y Y L
394
Y, yes; N, no; H, high; L, low; U, unclear (insufficient data)
395
a study includes 2 tests 396
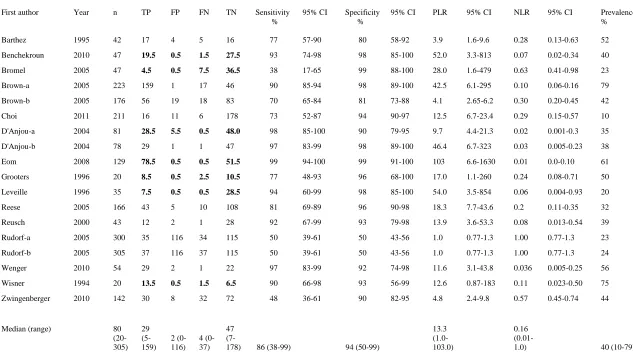
Table 5. Performance of diagnostic tests based on radiographic measurements 398
399
First author Year n TP FP FN TN Sensitivity
%
95% CI Specificity %
95% CI PLR 95% CI NLR 95% CI Prevalence
%
Ciasca 2013 85 25 16 12 32 67 52-80 67 53-78 2.0 1.3-3.2 0.49 0.29-0.81 44
Gatineau-a 2011 73 15 11 5 42 75 53-89 79 67-88 3.6 2.0-6.5 0.32 0.15-0.68 27
Gatineau-b 2011 70 14 12 6 38 70 48-86 76 63-86 2.9 1.65-5.2 0.40 0.20-0.79 29
Guglielmini-a 2012 151 46 34 5 66 90 79-96 66 56-75 2.7 2.0-3.5 0.15 0.06-0.35 34
Guglielmini-b 2012 151 44 29 7 71 86 74-93 71 62-79 3.0 2.2-4.1 0.19 0.10-0.39 34
Lamb 2000 100 38 10 12 40 76 63-86 80 67-89 3.8 2.1-6.8 0.30 0.18-0.50 50
Lamb-a 2001 55 13 14 9 19 59 39-71 58 41-73 1.4 0.82-2.4 0.71 0.40-1.3 40
Lamb-b 2001 64 12 15 7 30 64 41-81 66 52-79 1.9 1.1-3.2 0.55 0.30-1.0 30
Lamb-c 2001 60 16 10 5 29 76 55-89 75 59-85 3.0 1.7-5.4 0.32 0.15-0.70 35
Lamb-d 2001 52 14 10 6 22 70 48-86 69 51-82 2.2 1.2-4.0 0.44 0.22-0.89 38
Lamb-e 2001 48 17 6 4 21 80 60-92 78 59-89 3.6 1.75-7.6 0.25 0.10-0.61 44
Lamb-f 2001 41 10 5 2 24 83 55-95 83 67-92 4.8 2.1-11.2 0.20 0.06-0.72 29
Le Roux 2012 106 21 6 31 48 40 28-54 89 78-95 3.6 1.6-8.3 0.67 0.53-0.86 49
Moise-a 1986 43 8 5 4 26 67 39-86 84 67-93 4.1 1.7-10.1 0.40 0.18-0.90 28
Moise-b 1986 43 8 7 4 24 67 39-86 77 60-89 3.0 1.4-6.3 0.43 0.20-1.0 28
Moise-c 1986 43 9 7 3 24 75 47-91 77 60-89 3.3 1.6-6.9 0.32 0.12-0.88 28
Moise-d 1986 41 8 8 2 23 80 49-94 74 59-86 3.1 1.6-6.1 0.27 0.08-0.95 24
Torres 2005 60 40 4 1 15 98 87-100 79 57-92 4.6 1.9-11.1 0.03 0.004-0.22 68
Trevail-a 2011 89 37 6 2 44 95 83-99 88 76-94 7.9 3.7-16.8 0.06 0.015-0.23 44
Trevail-b 2011 39 19 2 7 11 73 54-86 85 58-96 4.8 1.3-17.4 0.32 0.16-0.63 67
Wray 2006 66 16 22 4 24 80 58-92 52 38-66 1.7 1.2-2.4 0.38 0.15-0.96 30
Pineiroa 2000 64 18.5 1.5 0.5 45.5 97 79-100 97 87-99 30.5 6.3-148 0.03 0.002-0.42 30
Median
(range) 62
(39-151)
16 (8-46)
9 (2-34)
5 (0-31)
28
(11-71) 76 (40-98) 77 (52-97)
3.2 (1.4-30.5)
0.32
(0.03-0.71) 34 (24-68)
400
n, number of subjects studied; TP, true positives; FP, false positives; TN, true negatives; FN, false negatives; CI confidence interval; PLR, likelihood ratio for a positive result; NLR, likelihood ratio for
401
a negative result. Values in bold type have had 0.5 added to permit calculation of likelihood ratios (see text).
402
a CT test.
Table 6. Performance of diagnostic tests based on ultrasonographic measurements 404
405
First author Year n TP FP FN TN Sensitivity
%
95% CI Specificity %
95% CI PLR 95% CI NLR 95% CI Prevalence
%
Barthez 1995 42 17 4 5 16 77 57-90 80 58-92 3.9 1.6-9.6 0.28 0.13-0.63 52
Benchekroun 2010 47 19.5 0.5 1.5 27.5 93 74-98 98 85-100 52.0 3.3-813 0.07 0.02-0.34 40
Bromel 2005 47 4.5 0.5 7.5 36.5 38 17-65 99 88-100 28.0 1.6-479 0.63 0.41-0.98 23
Brown-a 2005 223 159 1 17 46 90 85-94 98 89-100 42.5 6.1-295 0.10 0.06-0.16 79
Brown-b 2005 176 56 19 18 83 70 65-84 81 73-88 4.1 2.65-6.2 0.30 0.20-0.45 42
Choi 2011 211 16 11 6 178 73 52-87 94 90-97 12.5 6.7-23.4 0.29 0.15-0.57 10
D'Anjou-a 2004 81 28.5 5.5 0.5 48.0 98 85-100 90 79-95 9.7 4.4-21.3 0.02 0.001-0.3 35
D'Anjou-b 2004 78 29 1 1 47 97 83-99 98 89-100 46.4 6.7-323 0.03 0.005-0.23 38
Eom 2008 129 78.5 0.5 0.5 51.5 99 94-100 99 91-100 103 6.6-1630 0.01 0.0-0.10 61
Grooters 1996 20 8.5 0.5 2.5 10.5 77 48-93 96 68-100 17.0 1.1-260 0.24 0.08-0.71 50
Leveille 1996 35 7.5 0.5 0.5 28.5 94 60-99 98 85-100 54.0 3.5-854 0.06 0.004-0.93 20
Reese 2005 166 43 5 10 108 81 69-89 96 90-98 18.3 7.7-43.6 0.2 0.11-0.35 32
Reusch 2000 43 12 2 1 28 92 67-99 93 79-98 13.9 3.6-53.3 0.08 0.013-0.54 39
Rudorf-a 2005 300 35 116 34 115 50 39-61 50 43-56 1.0 0.77-1.3 1.00 0.77-1.3 23
Rudorf-b 2005 305 37 116 37 115 50 39-61 50 43-56 1.0 0.77-1.3 1.00 0.77-1.3 24
Wenger 2010 54 29 2 1 22 97 83-99 92 74-98 11.6 3.1-43.8 0.036 0.005-0.25 56
Wisner 1994 20 13.5 0.5 1.5 6.5 90 66-98 93 56-99 12.6 0.87-183 0.11 0.023-0.50 75
Zwingenberger 2010 142 30 8 32 72 48 36-61 90 82-95 4.8 2.4-9.8 0.57 0.45-0.74 44
Median (range) 80
(20-305)
29 (5-159)
2 (0-116)
4 (0-37)
47
(7-178) 86 (38-99) 94 (50-99)
13.3 (1.0-103.0)
0.16
(0.01-1.0) 40 (10-79)
406
n, number of subjects studied; TP, true positives; FP, false positives; TN, true negatives; FN, false negatives; CI confidence interval; PLR, likelihood ratio for a positive result; NLR, likelihood ratio for
407
a negative result. Values in bold type have had 0.5 added to permit calculation of likelihood ratios (see text).
References 409
1. Keats TE, Sistrom C. Atlas of Radiologic Measurement, 7th edition. Philadelphia: 410
Harcourt Health Sciences, 2001. 411
2. Goodman LR. Felson’s Principles of Chest Roentgenology, 3rd edition. Philadelphia: 412
Saunders Elsevier 2007, p197. 413
3. William Thomson, 1st Baron Kelvin. Available at: 414
http://en.wikipedia.org/wiki/William_Thomson,_1st_Baron_Kelvin [Accessed 10 April 415
2014] 416
4. Jacobson HG. In memoriam Benjamin Felson 1913-1988. Radiology 1989;170:897-898. 417
5. Coulson A, Lewis N. An Atlas of Interpretive Radiographic Anatomy of the Dog and Cat, 418
2nd edition. Oxford: Blackwell Science, 2008. 419
6. Tirkes T, Hollar MA, Tann M, Kohli MD, Akisk F, Sandrasegaran K. Response criteria in 420
oncologic imaging: review of traditional and new criteria. RadioGraphics 2013;33:1323-421
1341. 422
7. Buchanan JW, Bucheler J. Vertebral scale system to measure canine heart size in 423
radiographs. J Am Vet Med Assoc 1995;206:194-199. 424
8. The Cochrane Collaboration. Diagnostic Test Accuracy Working Group. Available at: 425
http://srdta.cochrane.org/handbook-dta-reviews [Accessed 10 April 2014] 426
9. Deville WL, Buntinx F, Bouter LM, Montori VM, de Vet HCW, van der Windt DAWM, et 427
al. Conducting systematic reviews of diagnostic studies: didactic guidelines. BMC Med 428
10. Liberati A, Altman DG, Tetzlaff J, Mulrow C, Gøtzsche PC, Ioannidis JPA, et al. The 430
PRISMA statement for reporting systematic reviews and meta-analyses of studies that 431
evaluate healthcare interventions: explanation and elaboration. PLoS Medicine 432
2009;e1000100. 433
11. Irwig L, Macaskill P, Glasziou P, Fahey M. Meta-analytic methods for diagnostic-test 434
accuracy. J Clin Epidemiol 1995;48: 119-130. 435
12. Rutjes AWS, Reitsma JB, Di Nisio M, Smidt N, van Rijn JC, Bossuyt PMM. Evidence of 436
bias and variation in diagnostic accuracy studies. Can Med Assoc J 2006;174:469-476. 437
13. Whiting PF, Rutjes AWS, Westwood ME, Mallett S, Grp Q-S. A systematic review 438
classifies sources of bias and variation in diagnostic test accuracy studies. J Clin Epidemiol 439
2013;66: 1093-1104. 440
14. Whiting PF, Rutjes AWS, Westwood ME, Mallett S, Deeks JJ, Reitsma JB, et al. 441
QUADAS-2: a revised tool for the quality assessment of diagnostic accuracy studies. Ann 442
Intern Med 2011;155: 529-U104. 443
15. Barthez PY, Nyland TG, Feldman EC. Ultrasonographic evaluation of the adrenal glands 444
in dogs. J Am Vet Med Assoc 1995;207:1180-1183. 445
16. Benchekroun G, de Fornel-Thibaud P, Rodriguez Pineiro MI, Rault D, Besso J, Cohen A, 446
et al. Ultrasonography criteria for differentiating ACTH dependency from ACTH 447
independency in 47 dogs with hyperadrenocorticism and equivocal adrenal asymmetry. J 448
17. Brömel C, Pollard RE, Kass PH, Samii VE, Davidson AP, Nelson RW. Ultrasonographic 450
evaluation of the thyroid gland in healthy, hypothyroid, and euthyroid golden retrievers 451
with nonthyroidal illness. J Vet Internal Med 2005;19: 499-506. 452
18. Brown DJ, Rush JE, MacGregor J, Ross JN, Brewer B, Rand WM. Quantitative 453
echocardiographic evaluation of mitral endocardiosis in dogs using ratio indices. J Vet 454
Internal Med 2005;19: 542-552. 455
19. Choi J, Kim H, Yoon J. Ultrasonographic adrenal gland measurements in clinically normal 456
small breed dogs and comparison with pituitary-dependent hyperadrenocorticism. J Vet Sci 457
2011;73: 985-989. 458
20. Ciasca TC, David FH, Lamb CR. Does measurement of small intestinal diameter increase 459
diagnostic accuracy of radiography in dogs with suspected intestinal obstruction? Vet 460
Radiol Ultrasound 2013;54: 207-211. 461
21. D'Anjou MA, Penninck D, Cornejo L, Pibarot P. Ultrasonographic diagnosis of 462
portosystemic shunting in dogs and cats. Vet Radiol Ultrasound 2004;45: 424-437. 463
22. Eom K, Moon K, Seong Y, Oh T, Yi S, Lee K, et al. Ultrasonographic evaluation of 464
tracheal collapse in dogs. J Vet Sci 2008;9: 401-405. 465
23. Gatineau M, Dupuis J, Beauregard G, Charette B, Breton L, Beauchamp G, et al. Palpation 466
and dorsal acetabular rim radiographic projection for early detection of canine hip 467
dysplasia: A prospective study. Vet Surg 2012;41: 42-53. 468
24. Grooters AM, Biller DS, Theisen SK, Miyabayashi T. Ultrasonographic characteristics of 469
the adrenal glands in dogs with pituitary-dependent hyperadrenocorticism: Comparison 470
25. Guglielmini C, Diana A, Santarelli G, Torbidone A, Di Tommaso M, Toaldo MB, et al. 472
Accuracy of radiographic vertebral heart score and sphericity index in the detection of 473
pericardial effusion in dogs. J Am Vet Med Assoc 2012;241: 1048-1055. 474
26. Lamb CR, Tyler M, Boswood A, Skelly BJ, Cain M. Assessment of the value of the 475
vertebral heart scale in the radiographic diagnosis of cardiac disease in dogs. Vet Record 476
2000;146: 687-690. 477
27. Lamb CR, Wikeley H, Boswood A, Pfeiffer DU. Use of breed-specific ranges for the 478
vertebral heart scale as an aid to the radiographic diagnosis of cardiac disease in dogs. Vet 479
Record 2001;148: 707-711. 480
28. Le Roux A, Rademacher N, Saelinger C, Rodriguez D, Pariaut R, Gaschen L. Value of 481
tracheal bifurcatiton angle measurement as a radiographic sign of left atrial enlargment in 482
dogs. Vet Radiol Ultrasound 2012;53: 28-33. 483
29. Leveille R, Biller DS, Shiroma JT. Sonographic evaluation of the common bile duct in 484
cats. J Vet Internal Med 1996;10: 296-299. 485
30. Moise NS, Dietze AE, Mezza LE, Strickland D, Erb HN, Edwards NJ. Echocardiography, 486
electrocardiography, and radiography of cats with dilatation cardiomyopathy, hypertrophic 487
cardiomyopathy, and hyperthyroidism. Am J Vet Res 1986;47: 1476-1486. 488
31. Pineiro MIR, de Fornel-Thibaud P, Benchekroun G, Garnier F, Maurey-Guenec C, Delisle 489
F, et al. Use of computed tomography adrenal gland measurement for differentiating 490
ACTH dependence from ACTH independence in 64 dogs with hyperadenocorticism. J Vet 491
32. Reese S, Breyer U, Deeg C, Kraft W, Kaspers B. Thyroid sonography as an effective tool 493
to discriminate between euthyroid sick and hypothyroid dogs. J Vet Internal Med 2005;19: 494
491-498. 495
33. Reusch CE, Tomsa K, Zimmer C, Hoerauf A, Nett C, Unterer S, et al. Ultrasonography of 496
the parathyroid glands as an aid in differentiation of acute and chronic renal failure in dogs. 497
J Am Vet Med Assoc 2000;217: 1849-1852. 498
34. Rudorf H, van Schaik G, O'Brien RT, Brown PJ, Barr FJ, Hall EJ. Ultrasonographic 499
evaluation of the thickness of the small intestinal wall in dogs with inflammatory bowel 500
disease. J Small Anim Pract 2005;46: 322-326. 501
35. Torres RCS, Araujo RB, Rezende CMF. Articular distractor in the early radiographic 502
diagnosis of canine hip dysplasia. Arquivo Brasileiro De Medicina Veterinaria E Zootecnia 503
2005;57: 27-34. 504
36. Trevail T, Gunn-Moore D, Carrera I, Courcier E, Sullivan M. Radiographic diameter of the 505
colon in normal and constipated cats and cats with megacolon. Vet Radiol Ultrasound 506
2011;52: 516-520. 507
37. Wenger M, Mueller C, Kook PH, Reusch CE. Ultrasonographic evaluation of adrenal 508
glands in dogs with primary hypoadrenocorticism or mimicking diseases. Veterinary 509
Record. 2010;167: 207-210. 510
38. Wisner ER, Théon AP, Nyland TG, Hornof WJ. Ultrasonographic examination of the 511
thyroid gland of hyperthyroid cats: comparison to 99mTcO4- scintigraphy. Vet Radiol
512
39. Wray JD, Sparkes AH. Use of radiographic measurements in distinguishing myasthenia 514
gravis from other causes of canine megaoesophagus. J Small Anim Pract 2006;47: 256-515
263. 516
40. Zwingenberger AL, Marks SL, Baker TW, Moore PF. Ultrasonographic evaluation of the 517
muscularis propria in cats with diffuse small intestinal lymphoma or inflammatory bowel 518
disease. J Vet Internal Med 2010;24: 289-292. 519
41. Irwig L, Bossuyt P, Glasziou P, Gatsonis C, Lijmer J. Designing studies to ensure that 520
estimates of test accuracy are transferable. BMJ 2002;324:669-671. 521
42. STAndards for the Reporting of Diagnostic accuracy studies. Available at: 522
http://www.stard-statement.org/ [Accessed 10 April 2014] 523
43. STrengthening the Reporting of OBservational studies in Epidemiology. Available at: 524
http://www.strobe-statement.org/index.php?id=strobe-home [Accessed 10 April 2014] 525
44. The CONSORT Statement. Available at: http://www.consort-statement.org/consort-526
statement/overview0/#checklist [Accessed 10 April 2014] 527
45. Furukawa TA, Guyatt GH. Sources of bias in diagnostic accuracy studies and the 528
diagnostic process. Can Med Assoc J 2006;174: 481-482. 529
46. Ochodo EA, de Haan MC, Reitsma JB, Hooft L, Bossuyt PM, Leeflang MMG. 530
Overinterpretation and misreporting of diagnostic accuracy studies: evidence of "spin". 531
Radiology 2013:267:581-588. 532
47. Sackett DL, Haynes RB. The architecture of diagnostic research. BMJ 2002;324:539-541. 533
49. Guyatt G, Sackett D, Haynes B. Evaluating diagnostic tests. In: RB Haynes, DL Sackett, G 535
Guyatt, and P Tugwell (Eds.) Clinical Epidemiology: How to Do Clinical Practice 536
Research, 3rd edition. Philadelphia: Lippincott Williams & Wilkins, 2006 pp290-297. 537
50. Malay SMPH, Chung KC. The choice of controls for providing validity and evidence in 538
clinical research. Plastic Reconst Surg 2012;130:959-965. 539
51. Dallman MJ, McClure RC, Brown EM. Histochemical-study of normal and collapsed 540
tracheas in dogs. Am J Vet Res 1988;49:2117-2125. 541
52. White RAS, Williams JM.Tracheal collapse in the dog: is there really a role for surgery? A 542
survey of 100 cases. J Small Anim Pract 1994;35:191–196. 543
53. Payne JD, Mehler SJ, Weisse C. Tracheal collapse. Compend Contin Educ Pract Vet 544
2006;28: 373-382. 545
54. Macready DM, Johnson LR, Pollard RE. Fluoroscopic and radiographic evaluation of 546
tracheal collapse in dogs: 62 cases (2001–2006). J Am Vet Med Assoc 2007;230:1870– 547
1876. 548
55. Bachmann LM, Puhan MA, ter Riet G, Bossuyt PM. Sample sizes of studies of diagnostic 549
accuracy: literature survey. BMJ 2006;332:1127. 550
56. Lamb CR. Statistical briefing: likelihood ratios. Vet Radiol Ultrasound 2007;48:394-395. 551
57. Oliveira P, Domenech O, Silva J, Vannini S, Bussadori R, Bussadori C. Retrospective 552
review of congenital heart disease in 976 dogs. J Vet Internal Med 2011;25: 477-483. 553
58. Lamb CR, Boswood A. Role of survey radiography in diagnosing canine cardiac disease. 554
59. Kaplan AJ, Peterson ME, Kemppainen RJ. Effects of disease on the results of diagnostic-556
tests for use in detecting hyperadrenocorticism in dogs. J Am Vet Med Assoc 1995;207: 557
445-451. 558
60. Behrend EN, Kooistra HS, Nelson R, Reusch CE, Scott-Moncrieff JC. Diagnosis of 559
spontaneous canine hyperadrenocorticism: 2012 ACVIM consensus statement (small 560
animal). J Vet Internal Med 2013;27: 1292-1304. 561
61. Shinkins B, Thompson M, Mallett S, Perera R. Diagnostic accuracy studies: how to report 562
and analyse inconclusive test results. BMJ 2013;346: f2778. 563
62. Lamb CR. How to report radiographs. Eur J Companion Anim Pract 2007;17:161-166. 564
63. Darwin C. Animals and Plants under Domestication. Vol. 1. London: J. Murray, 1868. 565
64. Young A, Bannasch D. Morphological variation in the dog. In: EA Ostrander, U Giger, and 566
K Lindblad-Toh, eds. The Dog and its Genome. Cold Spring Harbor, NY: Cold Spring 567
Harbor Laboratory Press, 2006, pp47–65. 568
65. Drake AG, Klingenberg CP. Large-scale diversification of skull shape in domestic dogs: 569
disparity and modularity. American Naturalist 2010; 175: 289-301. 570
66. Beukers M, Grosso FV, Voorhout G. Computed tomographic characteristics of presumed 571
normal canine abdominal lymph nodes. Vet Radiol Ultrasound 2013;54: 610–617. 572
67. Gollub MJ, Panicek DM, Bach AM, Penalver A, Castellino RA. Clinical importance of 573
reinterpretation of body CT scans obtained elsewhere in patients referred for care at a 574
68. Williams LE, Packer RA. Association between lymph node size and metastasis in dogs 576
with oral malignant melanoma: 100 cases (1987–2001). J Am Vet Med Assoc 577
2003;222:1234-1236. 578
69. Lamb CR. Statistical briefing: screening for disease. Vet Radiol Ultrasound 2008;49:109-579
110. 580
70. Moons KGM, van Es GA, Michel BC, Büller HR, Habbema JDF, Grobbee DE. 581
Redundancy of single diagnostic test evaluation. Epidemiology 1999;10:276-281. 582
71. Wood BP. Decision making in radiology. Radiology 1999;211:601-603. 583
72. Haller S, Radue EW. What is different about a radiologist's brain? Radiology 584
2005;236:983-989. 585
73. Morita J, Miwa K, Kitasaka T, et al. Interactions of perceptual and conceptual processing: 586
Expertise in medical image diagnosis. Int J Human-Computer Studies 2008;66: 370-390. 587
Legends 589
590
Figure 1. Schematic to illustrate numbers of papers retrieved by the search. 591
592
A B
593
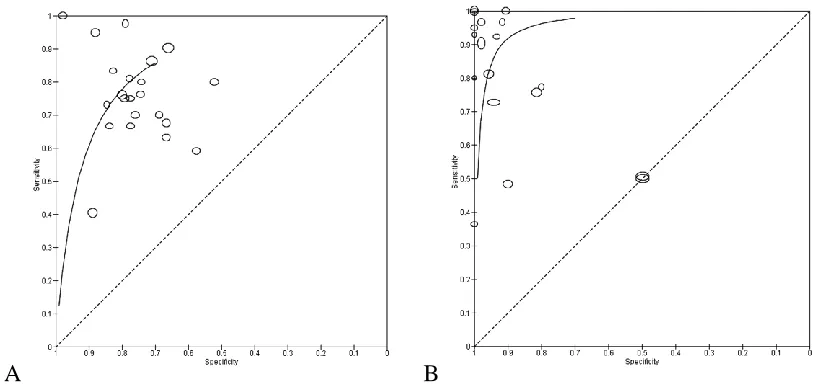
Figure 2. Summary receiver-operating characteristic plots of results of A) 22 tests based on 594
radiographic measurements and B) 18 tests based on ultrasonographic measurements. In each 595
instance, results of individual tests are widely scattered. The size of data points is proportional to 596
598
A B
599
Figure 3. Forest plots of results of A) 22 tests based on radiographic measurements and B) 18 600
tests based on ultrasonographic measurements. In general, confidence intervals are wider for 601
tests based on radiographic measurements and include 0.5 (50%) in several instances. Specificity 602
estimates for many tests based on ultrasonographic measurements are close to 1.0 (100%). 603
Multiple tests derived from a single study are presented in the same order as in Tables 1 & 2. 604
605
Figure 4. Summary receiver-operating characteristic plot of results of 14 radiographic tests for 607
cardiac or pericardial disease based on measurements of the cardiac silhouette. The results of 608
individual tests are widely scattered. The area under the curve for this sub-group is subjectively 609
slightly less than that for all radiographic tests (compare with figure 2A). 610
611
612
Figure 5. Summary receiver-operating characteristic plot of results of 5 tests based on 613
ultrasonographic measurements. The area under the curve for this sub-group appears to be the 614