Licensed under Creative Common Page 377
http://ijecm.co.uk/
ISSN 2348 0386
INCREASING A RELATIONSHIP QUALITY TO ENHANCE
CUSTOMER LOYALTY USING CONTACT FREQUENCY
AS A MEDIATING VARIABLE
Florentina K. Tehubijuluw
Lecturer, Matana University, Tangerang, Indonesia
[email protected]; [email protected]
Abstract
Tour and Travel Agency (TTA) is one key player in the tight competition in the hospitality and
tourism industry. The key success to win the competition is by creating an excellent relationship
quality and loyalty with the customers. A good relationship depends on the ability of the
organization to create customer satisfaction, increase customer trust and having a full
commitment to serve the customers better. Long-term relationship will be created if the
company able to establish communication system on a regular basis with customers by
increasing contact frequency and leveraging advances in technology devices. The unit of
analysis in this study was the entire customer of TTA. The population for this study was all the
customer of TTA, which are members of ASITA (the Associate of Indonesia Travel Agent),
located in Tangerang, Banten Province, Indonesia. In particular, the respondents were all the
customers who have used the services of TTA more than more than 3 times. The data was
collected directly from all the respondents using prevalidated structured questionnaire. This
study described that the customer satisfaction has the greatest effect into customer trust. Both
of these dimensions, which are also supported by customer commitment, will develop a good
relationship quality between customer and TTA that will create a strong customer loyalty.
Keywords: Customer Satisfaction, Trust, Customer Commitment, Relationship Quality, Contact
Licensed under Creative Common Page 378
INTRODUCTION
The tourism industry in Indonesia is growing rapidly along with the strengthening purchasing
power of Indonesian people. The tour and travel businesses as part of the tourism industry are
also growing rapidly. The rapid developments are including the developments of information technology; increased price, intense competition and changing on customer’s attitudes and
preferences. The intense competition in the tourism industry challenges each player to create
some marketing strategies to attract and retain customers. The tour and travel agency (TTA)
must focus on delivering outstanding services to their customers and in the same time
managing the customer relationship. Myhal (2008) stated that since customer is the most
important aspect of the success of the company, its presence should be maintained and
managed properly (Myhal, et.al., 2008).
Strengthening the relationship and transforming to indifferent customer into loyal ones
and serving customers as a client considered as other marketing goals. Customer loyalty can be
created as long as TTA able to make an integrated marketing approach, which in not only rely
on the internal capabilities of the company itself, but also involves marketing strategy that
focuses on building relationships with customer (Chan, 2003). Relationship marketing
management is a crucial factor in building success in the market because it influences and
maintains customer loyalty in the business. Moreover, relationship quality captures the nature of
a relationship, which in turn provides positive benefits to the customers (Hennig-Thurau and
Klee, 1997). Hence, loyalty, participation and cooperation from the customers are becoming
more and more important elements in enabling the TTA to build long-term relationship with
customer.
There are two main reasons why relationship marketing needs to be applied in the tour
and travel industry: The characteristic of industry requires a highly human-contact and also a
touch of tourism hospitality, and the customers need intensive approach to get complete
information before making a buying decision.
Customer satisfaction, trust and commitment are basic concepts that develop the
relationship quality definition. (Moliner, et al., 2006). Customer satisfaction is a positive affective state resulting from customer’s appraisal of all aspects of its working relationship with the
company (Bajs, et al., 2015). Trust defined as a belief of customer’s trustworthiness that results
from the expertise, reliability or intentionality of the company (Han, et al.,2008). Meanwhile,
commitment is an enduring desire to maintain a valued relationship (Ravald & Gronroos, 1996).
The stronger relationship quality between the customers and TTA, the higher the customer
loyalty into the TTA. The loyal customers who are satisfied with the TTA will recommend their
Licensed under Creative Common Page 379 key factor to secure the loyal customer base and to reach a high level of profitability (Vieira, et
al., 2008).
Earlier research found that the relationship quality was built by three main constructs,
namely: commitment, satisfaction and confidence (Morgan & Hunt, 1994; Moliner, 2006). This
relationship quality must be supported by the level of frequency relationship, which is
characterized by the frequency number of contacts made by the personnel of TTA. (Crosby et
al., 2003). A previous study also stated that the relationship quality will be succeed when the
highly frequency contact was powered (Crosby, et al., 2003).
Bajs (2015) in his study in tour operator industry got the conclusion that the expertise
and friendliness of tour operator employees combined with the reputation of the tour operator itself will increase the customer’s confidence in using their services. Meanwhile, the aspect of
familiarity and politeness of the tour operator employees will lead to customer satisfaction.
(Crosby, et al., 2003).
Expertise, sincerity and reliability are also other factors that strengthen the customer
relationship quality (Moliner, et al., 2006). Another recommendation of the previous researcher
said that there was a positive relationship between the skill (and ability/authority) and trust
(Crosby, et al., 2003).
Dagger (2009) in his research saw the influence of effects of customer contact frequency and it’s duration of the Customer-Reported Relationship Strength (CRRS) with the consideration
influence of variable satisfaction, trust, and commitment into the CRRS. The results showed that
the frequency and duration of contacts relationship had a positive influence of the CRRS, and
the duration of relationship become moderating variable which influence the frequency of
contact.
This research chose tourism industry, specifically: TTA as a unit analysis. The significant
findings on dimensions of satisfaction; trust; commitment into relationship quality and finally into
customer loyalty will be highlighted and analyzed. This study also added a new variable,
namely: frequency contacts as a moderating variable based on the fact that the TTA also has
low switching barrier to maintain the customer.
Objectives of the Study
The main purpose of this study is to examine the dimensions of customer satisfaction, customer
trust and customer commitment into relationship quality and finally creating customer loyalty by
Licensed under Creative Common Page 380
THEORETICAL FRAMEWORK
Customer Satisfaction
The sense of customer satisfaction was conceptualized as a loyalty research in a thorough
evaluation of the consumer experience with a service provider, not just specific transactions
based on satisfaction of judgments (Oliver, 1999; Molineret.al, 2006; Han, 2008). Satisfaction is the degree to which performance meets customer’s expectations (Negi and Ketema, 2013). It
also an emotional state that occurs in response to a positive evaluation of the interaction
experiences (Chang and Ku, 2009). If customers are satisfied with a product, they increasingly
tend to repurchase its products or services and become a loyal customer. Customer satisfaction
is considered as one of the main factors that influence customer loyalty (Evanschitzky and
Wunderlich, 2006).
Customer Trust
Trust defined as willingness to rely on an exchange partner in whom one has confidence
(Moorman et.al., 1993); which means that there has be a belief in the other partner’s
trustworthiness that results from the expertise, reliability or intentionally of that partner
(Hanet.al., 2008). A key component of trust is the extent to which the customer believes that the
organization has intentions and motives beneficial to the customer and is concerned with
creating positive customer outcomes. The high level of trust enable each party to focus on
long-term benefits of the relationship and willingness not try to exploit the new relationship at the
expense of the long-term cooperation (Bajs, 2015).
According to Morgan and Hunt (1994), commitment and trust together encourage
marketers:
To work towards preserving relationship investments by cooperating with
exchange partners;
To resist attractive short-term alternatives in favor of the long-term expected
benefits of staying with existing partners;
To view potentially high-risk actions more favorably because they believe that
their partners will not act opportunistically.
The transaction service relies heavily on trust, because of the nature of service is not real yield
uncertainty and risk for consumers is good for purchase or during use. Trust is defined as a
willingness to rely on a business partner. Confidence in the credibility of the company based on
how far the consumer trust the promise of the company, that the company is honest, and
Licensed under Creative Common Page 381
Customer Commitment
Commitment is an enduring desire to maintain a valued relationship (Ortiz, et.al., 2015).
Commitment is positively related to loyalty and repeated purchase and an essential component
of long-term loyalty (Morgan & Hunt, 2004). Furthermore, he said that commitment towards a
brand is based on three principal behavioral consequences:
- The repurchase of the brand
- Resistance to modifications generated from the competing universe
- Resistance to negative feelings generated by specific dissatisfactions.
Feelings about an emotional entanglement with a partner business, formed through the contact
quenching and reflect a deep fondness, involves the dedication upon the maintenance of
relationships (Moliner, et al. 2006).
Relationship Quality
A key concept in relationship quality is the development of an individualized, one-to-one
relationship with a customer that becomes increasingly relevant and focused, as the company
learns about the customer needs and wants over time. As the relationship tie established and
continue developed, customers started to feel safe and comfort, and thus trust in developing.
Over the longer period, more and tighter ties were developed with its customer specific needs or
wants and more on one-to-one relationship which emphasized on the relationship quality
elements of trust, commitment and loyalty. Relationship quality was defined by Hennig-Thurau
and Klee (1997) as the degree of appropriateness of a relationship to fulfill the needs of the
customers associated with the relationship. Better relationship quality is accompanied by
greater satisfaction, trust and commitment (Bajs, 2015).
Relationship quality is also defined as a condition in which consumers rely on the
integrity of the company and have the future performance of the company due to his past
satisfactory performance levels on a consistent basis. Thus, between the company and the
customer relationship patterns occur based on satisfaction, trust, and commitment that produce
a feeling of interdependence. Therefore, it will be created an adaptability and mutual
understanding situation of the role and the purpose of each party. At this kind of stage the
purchase action done by the customer would happen automatically (Moliner, 2007; Han, 2008).
Contact Frequency
Understanding customer needs is the best way to determine the optimal frequency of contact.
Licensed under Creative Common Page 382 Customer
Commitment
the customer or vice versa, and a large number of meetings/face-to-face contact between both
of them (Crosby, et al. 2003; Dagger, 2009).
Customer Loyalty
Customer loyalty is described as a deeply held commitment to re-buy or repurchase a preferred
product/service consistently in the future, thereby causing repetitive same-brand or same-set
purchasing, despite situational influences and marketing efforts are having the potential to
cause switching behavior (Crosby, et al., 2003). Customer loyalty will also show the degree in
which the customer doing repeated buying behavior from the same service provider; have a
positive attitude towards the service provider, and only consider using this service provider
when needed. This aspect is seen as a deeper dimension and involves awareness of customers
in the decision-making process at the time of evaluation of alternative choices before any
purchase is made. Based on this definition, the characteristic of a very loyal customer is as
follows:
1) Regularly use the service provided by the service provider;
2) Really liked the company and holds high about it; and
3) Never consider using another service provider (Berry, 1995; Parasuraman&Zeithaml, 1998;
Han, 2008).
Research Framework
Customer Satisfaction
Customer Trust
Relationship Quality
Contact Frequency
Customer Loyalty H
7
H 8 H
1
H 3 H
5 H
4
H6
Licensed under Creative Common Page 383
Research Hypotheses
H1: There is a positive effect of customer satisfaction into relationship quality.
H2: There is an effect of customer trust into relationship quality.
H3: There is a positive effect of customer commitment into relationship quality.
H4: There is a strong effect of customer satisfaction into customer trust.
H5: There is an effect of customer trust into customer commitment.
H6: There is a positive effect of customer satisfaction into customer commitment.
H7: There is a strong relationship quality into customer loyalty.
H8: There is the effect of contact frequency as moderating variable of the relationship between
the relationship quality and customer loyalty.
RESEARCH METHODOLOGY
The Study
For the study purpose, a descriptive research design was adopted. The research questionnaires
in this study consisted two parts. The first part was drawn for collecting demographic information
profile of the respondents and the second part of questionnaire represented the main research
questions is taken from the previous study which are adjusted with the current respondent. Each
question will be measured base on Likert 5th option spectrum coded from: Scale 1 = Very
Disagree, Scale 2 = Disagree, Scale 3 = Doubtful, Scale 4 = Agree and Scale 5 = Very Agree.
The research design in this study is hypotheses testing using cross-sectional time
dimension; field study research, causality with individual as unit analysis using the Structural
Equation Models (SEM) technique and the Lisrel Program.
Based on SEM rule of thumb, it’s enough using comparison 5:1 with the minimum of
sample = 200 respondents. For this study, the researcher distributed 215 questionnaires, with
15 questionnaires were used for the back-up.
Sampling
The unit of analysis in this study is the entire customer of TTA. Meanwhile the population for this
study is all the customer of TTA, which are members of ASITA (the Associate of Indonesia
Travel Agent), located in Tangerang, Banten Province, Indonesia. In particular, the respondents
were all the customers who have used the services of TTA more than more than 3 times. The
data was collected directly from all the respondents. The respondents answered all the
questions listed in the questionnaires. For the sample collection method, this study used one
Licensed under Creative Common Page 384 method offered easy accessible to get respondents, the researcher must be careful in making
more generalized conclusion of the data analysis.
Measurement tools
Satisfaction is the degree to which performance meets customer’s expectation and consists of the following dimension: all products/services offered hadmet the customer’s expectation;
high-quality products/services and overall satisfaction in consuming the product or experiencing the
services (Negi and Ketema, 2013).
The dimension of commitment was explained using a scale adapted from
Zineldin&Jonsson (2003), which consists of: customer has a long-term relationship with the company; concern on the success of the company; proud buying the company’s products/services; being a loyal customer of the company and willing to participate in company’s
activities.
The dimension of trust was measured by adapting Morgan & Hunt study (1994), namely:
highly-integrity company; the company always keep on promises while delivering
product/services; the company is trustable and the company is highly-trusted.
Beatsonet.al (2008) conceptualized that the relationship quality composed of three dimensions:
customer happy about the relationship with the company; an open and honest company and the
company devotes sufficient time and effort to improve the relationship.
Meanwhile the aspect of loyalty is measured by variables developed by Wu (2011),
which are consists of: customer will say positive things to others; recommend the company to
others; encourage friends to meet the frontliners before making buying decision; willing to buy
the product at normal price; and the company is the first choice for the customer in making
buying decision.
The contact frequency was measured by the frequency of the sales agents make a
contact with the customers on the regular basis; the kind of media was used in making contact
and the updated information shared into the customers (Zineldin& Johnson, 2000).
Validity & Reliability Testing
Validity was ensure by correlating among scores for each item in form of questions using
Pearson correlation and the pre-test with critical t> 0.795 showing that all items have greater
correlation value and VALID.
For reliability, all values yielded alpha coefficient exceeded the values of 0.50 suggested
by Nunnaly (1978). The pre-test showed that the alpha reliability value is greater than 0.795 and
Licensed under Creative Common Page 385
Model Estimation
Test of Model Fit Measurement
In this study, Confirmatory Factor Analysis (CFA) is used.
Structural Model Fit Test
Evaluation on analysis of structural model includes examination of correlation of latent variables
in this research. If significance degree reaches alpha = 0.05 and t-value >= 1.96, then
significance of every coefficient that represents causal relation that is hypothesized can be
tested systematically. The structural equations model which is using in this study will explain the
relationship among six variables namely:
a. Three exogenous variables:
ξ1 = customer satisfaction, which is measured by three dimensions (X1, X2, X3)
ξ2 = customer trust, which is measured by four dimensions (X4, X5, X6, X7)
ξ3 = customer commitment, which is measured by five dimensions (X8, X9, X10, X11, X12).
b. Three endogenous variables:
1 = relationship quality, which is measured by three dimensions (Y1, Y2, Y3)
2 = customer loyalty, which is measured by five dimensions (Y4, Y5, Y6, Y7, Y8)
3 = contact frequency, which is measured by three dimensions (Y9, Y10, Y11).
ANALYSIS AND FINDINGS
Test of Structural Model Fitness
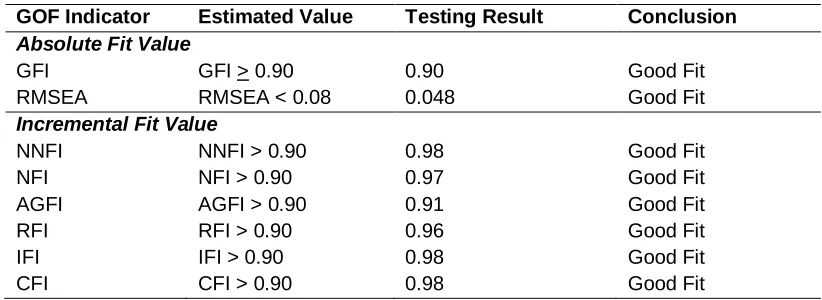
From the Goodness-of Fit (GOF) test showed that all the covariance matrix of the data samples
were suitable with the estimated covariance matrix of all population (Table 1). Therefore, it can
be said that the relationship between research framework and the research theory was perfect.
Table 1. Design Summary for Goodness for Fit Testing Model
GOF Indicator Estimated Value Testing Result Conclusion
Absolute Fit Value
GFI GFI > 0.90 0.90 Good Fit
RMSEA RMSEA < 0.08 0.048 Good Fit Incremental Fit Value
NNFI NNFI > 0.90 0.98 Good Fit
NFI NFI > 0.90 0.97 Good Fit
AGFI AGFI > 0.90 0.91 Good Fit
RFI RFI > 0.90 0.96 Good Fit
IFI IFI > 0.90 0.98 Good Fit
CFI CFI > 0.90 0.98 Good Fit
Licensed under Creative Common Page 386
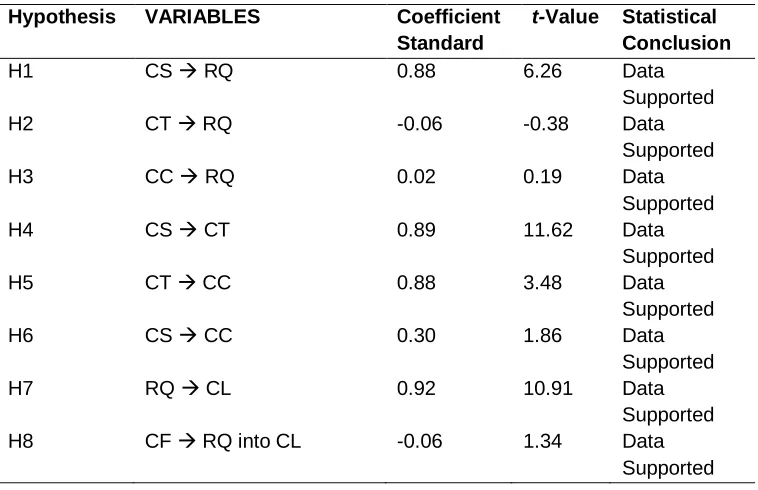
Hypotheses Testing
Table 2. Summary of Result of Hypotheses Testing
Hypothesis VARIABLES Coefficient
Standard
t-Value Statistical Conclusion
H1 CS RQ 0.88 6.26 Data
Supported H2 H3 H4 H5 H6 H7 H8
CT RQ
CC RQ
CS CT
CT CC
CS CC
RQ CL
CF RQ into CL
-0.06 0.02 0.89 0.88 0.30 0.92 -0.06 -0.38 0.19 11.62 3.48 1.86 10.91 1.34 Data Supported Data Supported Data Supported Data Supported Data Supported Data Supported Data Supported
The result of all hypothetical tests indicates that all hypotheses tested on all respondents are
supported by data. Following are the results of the description of each variable estimator:
a. Customer Satisfaction: Mostly all the responders are always satisfied with the average
value = 4.73.
b. Customer Trust: The data showed that the highest indicator on the respondent's
answer of customer trust dimension was the TTA always keep on promises while
delivering product/services and may be relied upon for solving the customers problem,
with the average value = 4.68.
c. Customer Commitment: From the long-term relationship, customer had a feeling of
comfort because TTA is informative and treat them in personal ways, with the average
value = 4.83.
d. Relationship Quality: All respondents prefer a valuable relationship with the TTA as
long as the company devotes sufficient time and effort to improve the relationship, with
the average value = 4.70
e. Contact Frequency: The highest value (=4.88) comes as employees of TTA visit the customers regularly to offer the company’s product and services. The employees could
Licensed under Creative Common Page 387 f. Customer Loyalty: All customers who are satisfied with the TTA will be loyal customers
and said that specific TTA will be the first choice for them in making buying decision (the
average value = 4.76).
DISCUSSION
First hypotesis stated that customer satisfaction has a positive effect to the relationship quality
with the value component coefficientof 0.88 and the value of the t-valueamounted to 6.26. That
means that the higher the value of the person's satisfaction in receiving product/services
provided by the TTA will cause the higher level relational quality happens.
Second hypotesis also said that customer trust will have an effect to the relationship
quality. From the results of the data analysis proves that this second hypothesis H2 is not proven
by the t-value -0.38 and component coefficient was -0.06. This means that the aspect of
customer trust did not significantly affect the relationship quality.
Third hypothesis stated that there is a good effect of the customer commitment into
relationship quality. This research showed that significant influence does not occur between the
dimension of customer commitment into the relationship quality with a value of the t-value 0.19
and component coefficient was 0.02. This means that an increase in customer commitment will
not cause increased automatically the relationship quality. In other words, the relationship
between customers with the TTA is not only caused by the satisfaction experienced by the
customers.
Fourth hypothesis said that the customer satisfaction has positive influence against the
customer trust. This study indicates that the hypothesis is proven to significantly with a value of
the t-value 11.62 and component coefficient 0.89. This means that the stronger customer
satisfaction will lead to an increase in customer trust to the TTA.
Meanwhile the fifth hypothesis declared that there is a positive effect of the customer
trust into customer commitment. Authentication is done on the research indicates that the
hypothesis is supported significantly the data with the t-value 3.48 and component coefficient
was 0.88. This result means that the higher the customer confidence level will improve also their
commitment to TTA.
The sixth hypothesis also stated that the customer satisfaction has positive effect
against customer commitment. The result of this study indicated that there was no significant
influence between the customer satisfaction and their commitment with a value of the t-value
1.86 and component coefficient was 0.30. This means that no change occurred the customer
Licensed under Creative Common Page 388 The seventh hypothesis also stated that the relationship quality has the positive impact of
customer loyalty. This hypothesis is supported significantly with the value of the t-value 10.91
and component coefficient was 0.92. This suggests that the higher the level of closeness of
relationship will improve their consumer loyalty towards TTA.
The final hypothesis described that the contact frequency dimensions affects the
relationship quality and customer loyalty. The evidentiary data indicated that a value of the
t-value that occurs is 1.34 with component coefficient of-0.06. This means that the latent variable
does not significantly affect the relationship between the relationship quality and customer
loyalty. Along with the advances in technology, the company can take advantage in spreading
the useful information to customers such as: e-mail, phone messaging, blackberry messenger
or using social media like Facebook and Twitter to deliver information to customers.
CONCLUSION
The existence of a positive influence of customer satisfaction into the relationship quality with
the t-valueamounted to 6.26 showed the data obtained support the H1.The results of the study
also showed that customer trustdid not affect the relationship qualitywith the t-value -0.38. It can
be concluded that the data obtained did not support the H2.The absence of significant influence
between the customer commitment into the relationship quality with the t-value 0.19 also
showed that the data did not support the H3. Meanwhile the data obtained support the H4
because customer satisfaction has a positive and significant effect into customer trust.
Furthermore, variable customer trust also has a positive and significant impact on customer
commitment with t-value 3.48 and this result support the H5.
However, there was no significant influence between customer satisfactions into
customer commitment, as evidenced by the t-value 1.86, do not support H6.The variable of
quality relationship has a positive and significant effect of customer loyalty with t-valueof 10,91.
This data obtained is support the H7. Contact frequency has no effect and is not significant to
the quality relationship and customer loyalty with the t-value of 1.34. It can be said the data
obtained support the H8, in which the contact frequency as a moderating variable between the
relationship quality and customer satisfaction.
From all the variables discussed and tested in this research, it described that the
customer satisfaction has the greatest effect into customer trust. Both of these dimensions,
which are also supported by customer commitment, will develop a good relationship quality
Licensed under Creative Common Page 389
IMPLICATIONS OF THE STUDY
The Theoretical Implications
The quality of the relationship between customers and TTA is affected by the level of customer
satisfaction, trust and commitment. It also can be concluded that the dimensions of satisfaction,
trust and commitment have positive effects on the relationship quality. Furthermore, it will also
have a significant effect into customer loyalty. The commitment variable that occurs on the
consumer at the TTA is caused by the presence of satisfaction and trust. In other words,
commitment to the TTA is built upon the trust and satisfaction of the customers. If it developed
continuously, it will have a positive impact into customer loyalty into TTA.
The Managerial Implications
The present model can be considered as an empirical approach capturing the major part of
customer responses of global tourism industry demonstrating the relationship between the
related constructs and their direct or indirect influence on loyalty. From a managerial view, it is
apparent that relationship quality lies on the heart of this specific model affecting directly
satisfaction, trust, commitment. Thus, the customer loyalty is highly dependent on the dimension
of relationship quality. Company should maintain their relationship quality with the customer by
establishing frequent contact with the customers in order to foster a loyalty. A higher relationship
quality will increase customer intention of repurchase.
The role of satisfaction, trust and commitment is also a strategic importance as they all
directly associated with the creation of higher relationship quality and finally influencing directly
behavioral intentions to buy the product/services. This result is consistent with the previous
study from Morgan and Hunt (1994) who is stated that the companies should look beyond
satisfaction, trust and commitment to develop customer loyalty in order to ensure long-term
relationship.
The continuous customer satisfaction will lead to the construction of a good relationship.
The customers tend to repurchase the products/services and also will recommend their good
experience to their friends and relatives. TTA management needs to do a strategy to increase
the satisfaction of its customers by improving service and knowledge of their employees in the
buying interaction process. TTA management mustkeep trying to increase consumer confidence by improving employee’s ability to understand the needs required by consumers; to help resolve
customer problems; to fulfill the promise that has being made, to be honest and transparent in
Licensed under Creative Common Page 390
RESEARCH LIMITATIONS & FURTHER RESEARCH
First, the respondent of the study is limited in one specific industry who is customers of TTA in
Tangerang region. As such, the applicability of the current findings to other industry contexts
would need further research and should be extended to respondents from different industries.
Future research should also test whether the issues and applications discussed here are
applicable and helpful in other industry, especially in service industry such as hotels, airlines,
local operators, restaurants, entertainment venues and more.
Secondly, this study concentrated only on customer side of the TTA-customer
relationships. It focuses only what the customer perspectives on how the TTA deliver their
products/services to them. Future studies may address another point of view by incorporating
deeply on data collection form both customers and TTA staffs.
Thirdly, the study considers the contact frequency as a mediating variable that can affect
the relationship quality and the customer loyalty. The result of the study is consistent with the
previous research showing the importance of the contact frequency in a long term relationship.
The future research could elaborate more another variables that influence the relationship
quality, so it can beapplied and contribute in management decision making.
REFERENCES
Bajs, Irena, and Pandza (2015), "Tourist perceived value, relationship to satisfaction and behavioral intentions: the example of the Croatian tourist destination Dubrovnik", Journal of Travel Research, Vol. 54, pp. 122-134.
Berry, L.L. (1995), On Great Service – A Framework for Action, Free Press, New York, NY.
Beatson A, Lings I, Gudergan S (2008),“Employee behavior and relationship quality: impact on customers”, The Service Industries Journal, Vol. 28, No.2, pp.211-23.
Berry, Leonard. L. (1995), "Relationship marketing of services growing interest, emerging perspectives", Journal of the Academy of Marketing Science 23 (Fall), pp. 236-45 pm.
Crosby, Benny, DeVito, r. and Pearson, J.M. (2003), "Manage your customers' perception of quality", Review of Business, vol. 24, no. 1, pp. 18-24
Chan and Ndubisi (2008), "Relationship marketing and customer loyalty", Journal of Marketing Intelligence and Planning, vol. 25, no. 1, pp. 98-106.
Chang HH, Ku PW (2009), “Implementation of relationship quality for CRM performance: acquisition of BPR and organizational learning”, Total Quality Management, Vol.20, No.3, pp.327-348.
Dagger, Danaher and Gibbs (2009), "How often versus how long: the interplay of contact frequency and relationship duration in customer-reported service relationship strength”, Journal of Service Research, vol. 11, pp. 371.
Evanschitzky H, Wunderlich M (2006), “An examination of moderator effects: the four stage loyalty model”, Journal of Service Research, Vol. 8, No.4, oo.330-345.
Licensed under Creative Common Page 391 Han, Kwortnik and Wang (2008) – "Service Loyalty: An Integrative Model and Examination across Service Contexts", Journal of Service Research, Vol.11. no.1, pp. 22-42
Hennig-Thurau and Alexander Klee (1997), "The impact of customer satisfaction and relationship quality on customer retention-a critical reassessment and model development", Psychology & Marketing, 14 (December), pp. 737-65.
Moliner, Sanchez, Rodruguez and Callarisa (2006), "Quality Relationships with a Travel Agency:The Influence of ThePostpurchasePerceived Value of a Tourism Package"
Moorman C, Deshpande R, Zaltman G (1993), “Factors affecting trust in market research relationships”, Journal of Marketing, Vol. 57., No.1, pp.81-101.
Morgan, M. and Hunt (1994), "The commitment-trust theory of relationship marketing ", Journal of Marketing, vol. 58, no. 3, pp. 20-38.
Myhall, Kang, Murphy (2008), "Retaining customers through relationship quality: a service business marketing case", Journal of Service Marketing, vol. 22, no. 6, pp. 445-453.
Negi R, Ketema, E (2013), “Customer perceived relationship quality and satisfaction: a case of Ethiopian telecommunication corporation”, African Journal of Economic and Management Studies, Vol.4, No.1, pp. 109-121.
Ortiz, Maria Z, Rosario E, Marquez E and Gruneiro (2015), "Relationship between organizational commitments and organizational citizenship in a sample of private banking employees’, International Journal of Sociology and Social Policy, vol. 35, ½, 91.
Ravald, Annika and Gronroos (1996), "The value concept and relationship marketing, European Journal of Marketing, vol. 30, Iss:2, pp. 19-30.
Vierra, Luis; Winklholfer, H and Ennew, C (2008), "Relationship quality: a literature review and research agenda", Journal ofCustomer Behavior, vol. 7 (4), pp. 269-291.
Zeithaml, V.A., Berry, L.L. and Parasuraman, a. (1996), "The behavioural consequences of service quality", Journal of Marketing, vol. 60, no. 2, pp. 31-46.