Remote Sensing Image Fusion Using
High-Resolution Scale Regression And Half-Gradient
Vaibhav R. Pandit, Dr. R. J. Bhiwani
Abstract: Multispectral and panchromatic images are the outcomes of optical satellite technology. Because of the different levels in spatio-spectral resolutions, they can also be regarded as spectrally-superior-spatially-inferior-resolution image and spatially-superior-spectrally-inferior-resolution image respectively. When acquired for the same geographic scenario, the fusion of these two images is also referred to as ‗Pansharpening‘. It has emerged as a promising solution to fulfill the demand of simultaneous high levels of spatio-spectral resolutions in remote sensing imagery. Continuous attempts while proposing different approaches to produce efficient fused image are reported in literature. The approaches are mostly differentiated based on way of spatial detail extraction from panchromatic image and its injection to multispectral image. In this paper, we propose to use morphological half-gradient for the first task and iterative regression approach at high resolution for the second one. The performance measurement is carried out on two real datasets made available by Deimos-2 and IKONOS satellite sensors using low- and high-resolution evaluation techniques. The performance analysis involves comparison with the most recent algorithms. With respect to the evaluated quality metrics, the proposed algorithm proves to be the best among others.
Index Terms: High-resolution scale regression, half-gradient, image fusion, multispectral image, panchromatic image, remote sensing.
—————————— ——————————
1.
INTRODUCTION
THE advancements in satellite technology have lead to a continuous exploration along with analysis of the earth surface at wide scale [1]. This has resulted in many application tasks which help groundwater prospects mapping, forecast of agricultural output, forest cover mapping, snow & glacier studies, wasteland mapping, object recognition, change detection, scene interpretation and visual image analysis, etc. [2]. The benefits are of-course totally dependent on the accurateness of the accessed image. Today, the satellites like GeoEye, WorldView, QuickBird, IKONOS, Deimos, OrbView, Landsat, SPOT, etc. which sense the optical region of electromagnetic spectrum, provide a bundle of multispectral (MS) and panchromatic (PAN) images [3]. Mostly, the spatial richness of PAN imagery is four-times greater than that of MS imagery. On the another hand, MS imagery usually features four to eight spectral components over visual and near-infrared wavelengths separately as compared to a single band of PAN imagery. Due to the different levels of such spatio-spectral resolutions, they can also be regarded as spectrally-superior-spatially-inferior-resolution image and spatially-superior-spectrally-inferior-resolution image respectively. The physical constraints of imaging sensors mounted on board of satellite cannot provide unique product rich in both spatial and spectral resolutions [4]. But, the demand for simultaneous high levels of spatio-spectral resolutions is continuously growing. The promising way to fulfill this demand is seen in terms of ‗image fusion‘ [5]. The fusion of MS image with PAN image (whereas, they are acquired on the same location) is also referred to as ‗Pansharpening‘ that produces a compound image rich with both spatial and spectral resolutions [6]. Detailed literature of image fusion algorithms is surveyed in [7]–[9]. The algorithms are mostly categorized under a spectral class of Component Substitution (CS) [10], a spatial class of Multi-Resolution Analysis (MRA) [11] and hybrid approaches. As the intended fused image is expected to feature spatial and
spectral-richness from PAN and MS images respectively, the differentiation of one approach from another is based on the way of spatial detail extraction from first image and its injection to the second image. In this paper, we propose an image fusion algorithm denoted by ‗MHG-Reg‘. The algorithm exploit the morphological half-gradient for the first task of spatial detail extraction and further use iterative regression for the second task of spatial detail injection. Most of the conventional algorithms are found injecting the spatial detail at low resolution (i.e. at the size of original MS image) while following the Wald‘s protocol [12] in the absence of the reference fused image. Here, we successfully utilize the regression carried out at high resolution scale i.e. at the size of expected fused image. The performance measurement is carried out on two real datasets made available by Deimos-2 and IKONOS satellite sensors using low- and high-resolution evaluation techniques. The performance analysis involves a comparison with other nine the most recent algorithms belonging to CS and MRA approach with linear and nonlinear decomposition schemes.
The remaining paper is presented in the sequence as: Section II briefs the methodology of the proposed image fusion algorithm. Application of fusion algorithms to image datasets and performance measurement is shown in Section III. The results are analyzed in Section IV. Lastly, conclusion is noted in Section V.
2
THE
PROSED
WORK
As per the conventional CS approach, MS image undergoes a transformation to other domain with the assumption that spatial contents are grouped separately from the spectral information. Next, the component containing the spatial structure is subsequently substituted by the PAN image. Using an inverse transform, the data is finally brought back to the original space. Image fusion using this approach is mathematically generalized as:
)
(
Lup
G
P
I
M
F
(1)Where,
F
holds the result of image fusion produced byP
as input PAN image andM
up as the input MS image interpolated to the dimensions ofP
.G
is the gain factor for spectral bands(
i
1
,...,
N
)
in MS image andI
L is the synthetic intensity component representing spatial structure of MS ———————————————— Vaibhav R. Pandit is currently pursuing Ph.D. degree program in Engineering & Technology from Sant Gadge Baba Amravati University, Amravati, Maharashtra State, India. E-mail: [email protected]
142 image derived from the its spectral components as:
N i i up i Lw
M
I
1
)
(
(2)Here,
N
denotes total number of frequency bands of MS image overlapped by PAN image.w
is a weighting factor forth
i
band calculated by multiple regression of PAN and MS image.On the another hand, MRA involves an iterative decomposition scheme that constructs a chain of 2D-signals with progressive reduced contents. Here, the content of information is considered as spatial frequency. The decomposition can range from single level to more complex techniques. Image fusion using MRA approach is mathematically generalized as:
)
(
Lup
G
P
P
M
F
(3)Where, the meanings of
M
up,P
,F
lies the same.P
L isthe low-pass form of PAN image computed as:
N k k up k Lw
M
P
1
)
(
(4)Here,
w
represent optimal weights for spectral bands of MS image denoted ask
1
,...,
N
. So in MRA, the result of image fusion exploits computation of subtracting the low-pass filtered PAN image from itself as shown in (3).To look at both of these image fusion approaches, two important steps: 1) spatial detail extraction and 2) spatial detail injection to MS image are highlighted. For the first step, we propose to use the potential of morphological image processing operations which are popular for manipulating spatial contents of input image.For an image
I
, letB
and
B denotes dilation and erosion operations respectively using a structuring elementB
on a local neighborhood. The definitions of morphological internal gradient (
ig) i.e. residual of applying erosion and morphological external gradient (
eg) i.e. residual of applying dilation can be mathematically expressed as:B ig
I
(5)I
B eg
(6)A more precise morphological gradient can be expressed in terms of
ig and
eg as:)
(
5
.
0
ig eghg
(7)Where, constant value of 0.5 shows a normalization factor. Applying a morphological analysis filter, we get,
hg hg
I
f
(8)Using substitutions from equations (5), (6) and (7),
)
(
5
.
0
B Bhg
f
(9)Thus, the result of filtering is the half summation of erosion and dilation operations. Hence,
hg is referred to as‗Morphological Half-Gradient‘ (MHG) operator [13]. It is very clear from the mathematical representations, that the MHG based filtering results in spatial detail extraction from the input image. We take the advantage of this potential MHG based filtering in the proposed algorithm summarized at the end of this section.Now, with respect to both of the CS and MRA approaches, for the second step of spatial detail injection to MS image, the computation of gain
G
as denoted in (1) and (3) is very important. The different formulations ofG
corresponding to variety of algorithms belonging to CS and MRA approaches can be cited in [8]. Because of the lack of reference fused image, the conventional computations are usually made on low resolution scale i.e. at the size of original MS image. Its generalized mathematical form is shown as:
)
var(
)
,
cov(
L L up lrP
P
M
G
(10)Where, the subscript
lr
is to denote low resolution scale computation.Recently, the concept of computing the gainG
at high resolution scale i.e. at the size of intended fused image is proposed in [14]. The calculation for such gain is mathematically expressed as:
)
var(
)
,
cov(
P
P
F
G
hr
(11)Where, the subscript
hr
is to denote high resolution scale computation.Due to unavailability of
F
at this stage, the initial estimate ofhr
G
is considered as:)
,
cov(
)
,
cov(
0P
P
P
M
G
L uphr
(12)Next to this, the iterations are to be carried out for
j
0
to1
X
, whereX
is a fixed number.Thus, the improved fusion equations of CS and MRA approach respectively become:
)
(
1 L j hr up jI
P
G
M
F
(13))
(
1 L j hr up jP
P
G
M
F
(14)Because of above fusion structures, the fused image is improved with every iteration.
For MRA approach, Generalized Laplacian Pyramid with Modulation Transfer Function matched filter (MTF-GLP) [8], [15], [16] fusion procedure using such regression at high resolution scale is successfully demonstrated in [14] and is denoted as ‗GLP-Reg‘.In this work, using the spatial detail extraction by MHG based filtering and spatial detail injection by high resolution scale iterative regression approach with MTF-GLP procedure, we achieve more efficient fusion of MS to PAN imagery. This proposed algorithm is denoted as ‗MHG-Reg‘ and is summarized in following steps:
Algorithm: MHG-Reg Input:
M
up,P
Output:F
Step-1: MHG based filtering of
P
.Step-2: Equalization of
P
to matchM
up scale.Step-4: Determination of gain
G
hr (defined in (11)) through iterations forj
0
toX
1
over (12)).Step-5: MHG based filtering of [
G
hr(
P
P
L)
]. Step-6: ComputeF
as per (14).3 RESULTS
&
PERFORMANCE
MEASUREMENT
The performance evaluation of MHG-Reg algorithm along with its comparison to performances of CS based image fusion algorithms viz. Intensity-Hue-Saturation (IHS) [17], Principal Component Analysis (PCA) [18], Gram-Schmidt-Adaptive (GSA) [19], context-adaptive segmentation approach (SEGM) [20], [21] and MRA based algorithms listed as MTF-GLP [8], [15], [16], MTF-GLP using Context-Based Decision (MTF-GLP-CBD) [8], [15], [16], Additive Wavelet Luminance Proportional (AWLP) [8], [22], Morphological Half-Gradient based fusion with nonlinear decomposition scheme (MF-HG) [13], [23], GLP-Reg [14] is reported in this section. Two remotely sensed image datasets acquired by two different satellite sensors are used in this experimentation. The performance is measured using the latest MATLAB R2019b installed on the system configuration of core i5 3rd generation processor with 6 GB RAM.
3.1 Datasets
The details of datsets are shown in Table I. MS images of both the datasets hold four spectral bands viz. Blue (B), Green (G), Red (R), Near-IR1 (NIR1); while PAN image holds the single band. Performance evaluation is carried on a selected region of size
256
256
pixels for MS and1024
1024
pixels for PAN image of both the datasets. Fig. 1 shows MS and PAN images from the corresponding datasets.3.2 Image Fusion Results
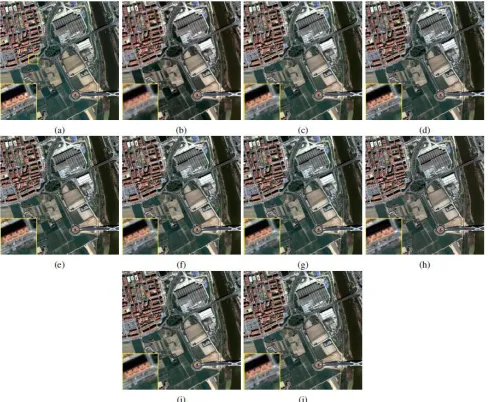
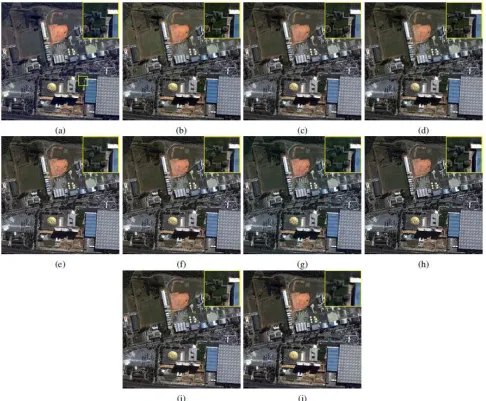
For the two datasets, we perform two experiments applying the image fusion algorithms to Deimos-2 and IKONOS images. The PAN to MS ratio considering spatial resolutions is 4. Result images after fusion are displayed in Fig. 2 and Fig. 3 for two datasets respectively. Here, the spectral band combination of only R, G, and B is used for display purpose. Also, the magnification of a small region outlined in (a) of both of these Fig.s is respectively represented at bottom left and top right in every fused image to help the visual distinction.
Table- I: Dataset Specifications for Deimos-2 and IKONOS imagery
Specifications Dataset-1: Barcelona Dataset-2: São Paulo Satellite Sensor Deimos-2 IKONOS Spectral Bands 4 MS & 1 PAN 4 MS & 1 PAN
Specifications Dataset-1: Barcelona Dataset-2: São Paulo Spatial
Resolutions
MS: 4 m & PAN: 1 m
MS: 3.2 m & PAN: 82 cm Location Barcelona, Spain São Paulo, Brazil
Data Format 16-bit 16-bit
Dimensions of
MS
3249
2928
4
2228
2240
4
Dimensions ofPAN
12996
11712
8912
8960
Provided by [23] [23]
Fig. 1. Dataset-1: Barcelona (a) MS and (b) PAN images.
Dataset-2: São Paulo (c) MS and (d) PAN images. (The spectral band combination of only R, G, and B is used for
display of MS images.)
3.3 Performance Measurement
144
Fig. 2. Experimentation with Dataset-1: Barcelona. Resultant fused images of (a) IHS, (b) PCA, (c) GSA, (d) SEGM, (e) MTF-GLP, (f) MTF-GLP-CBD, (g) AWLP, (h) MF-HG, (i) GLP-Reg, (j) MHG-Reg.
Table- II: Measurement of performance metrics and Execution Time for Dataset-1: Barcelona.
Algorithm High-Resolution Evaluation Low-Resolution Evaluation Time (s)
RMSE ERGAS SCC Q4 QNR
D
D
S SAM(
)
IHS 407.9157 2.1539 0.7958 0.7864 0.8265 0.0598 0.1209 1.3129 0.0415
PCA 848.4473 2.7930 0.7417 0.8068 0.8700 0.0704 0.0640 2.7607 0.3208
GSA 517.5843 1.9930 0.7448 0.8708 0.8705 0.0461 0.0874 1.1830 1.3251
SEGM 518.6228 2.1333 0.7463 0.8777 0.8901 0.0432 0.0698 1.1550 0.3934
MTF-GLP 556.3843 2.2321 0.7317 0.8655 0.8577 0.0567 0.0907 1.0792 1.6508
MTF-GLP-CBD 501.4898 1.9331 0.7581 0.8904 0.8765 0.0473 0.0800 1.0885 1.5724
AWLP 666.9871 2.3477 0.6860 0.8615 0.8938 0.0408 0.0681 1.1783 1.9220
MF-HG 637.5674 2.7525 0.7453 0.8343 0.8384 0.0720 0.0965 1.1830 0.7948
GLP-Reg 500.6709 1.9457 0.7586 0.8893 0.8740 0.0486 0.0814 1.0841 1.4890
Fig. 3. Experimentation with Dataset-2: São Paulo. Resultant fused images of (a) IHS, (b) PCA, (c) GSA, (d) SEGM, (e) MTF-GLP, (f) MTF-GLP-CBD, (g) AWLP, (h) MF-HG, (i) GLP-Reg, (j) MHG-Reg.
Table- III: Measurement of performance metrics and Execution Time for Dataset-2: São Paulo.
Algorithm
High-Resolution Evaluation Low-Resolution Evaluation
Time (s)
RMSE ERGAS SCC Q4 QNR
D
D
S SAM(
)
IHS 45.3878 3.7375 0.5657 0.5963 0.7030 0.1219 0.1995 1.8589 0.0423
PCA 48.2325 4.0462 0.5587 0.6047 0.7106 0.1086 0.2028 2.2762 0.3251
GSA 50.6445 4.1532 0.5217 0.6776 0.7259 0.1165 0.1784 1.6628 0.8154
SEGM 50.1578 4.0964 0.5253 0.7043 0.7516 0.1015 0.1635 1.6433 0.3999
MTF-GLP 48.3749 3.9391 0.5644 0.7031 0.7179 0.1310 0.1738 1.4582 1.5502
MTF-GLP-CBD 46.9917 3.8507 0.5730 0.7204 0.7393 0.1140 0.1656 1.4636 1.5713
AWLP 47.4570 3.7990 0.5748 0.7297 0.7431 0.1178 0.1577 1.4294 1.8755
MF-HG 53.8270 4.4291 0.5745 0.6926 0.7205 0.1349 0.1672 1.5489 0.7953
GLP-Reg 47.2382 3.8623 0.5716 0.7202 0.7398 0.1139 0.1651 1.4592 1.5170
MHG-Reg 31.3156 2.5745 0.7467 0.8250 0.8350 0.1047 0.0674 1.4807 1.5452
Quality w/ No Reference (QNR) [26], Spectral Distortion (
D
)[26], Spatial Distortion (
D
S) [26] and Spectral Angle Mapper (SAM) [25], [26] are obtained using high-resolution evaluation146 Table III correspondingly show performance metric values for
experimentation with Dataset-2: São Paulo. Here, the best achieved results are shown in bold, the second most desired results are highlighted with underline and the results at third most desired level are shown in italics.
4 OBJECTIVE
AND
SUBJECTIVE
ANALYSES
The previous section reported quantitative results obtained corresponding to the performances of ten image fusion algorithms. Now, the objective and subjective analysis carried on the obtained results are discussed as under:
4.1 Objective Analysis
Based on the low-resolution evaluation technique used in the experimentation, a comparison is made for average RMSE values (average is computed corresponding to both the datasets) as plotted in Fig. 4 (Note: MTF-GLP-CBD is denoted by GLP-CBD for compactness in graphical representations of Fig. 4 and onwards). Here, the proposed algorithm MHG-Reg is found to be superior than PCA, AWLP, MF-HG, MTF-GLP, SEGM, GSA, GLP-Reg, MTF-GLP-CBD and IHS. It has calculated this error metric at the most desired low level than calculated by all other image fusion algorithms.
Fig. 4. Comparative measurement of average RMSE against all the image fusion algorithms.
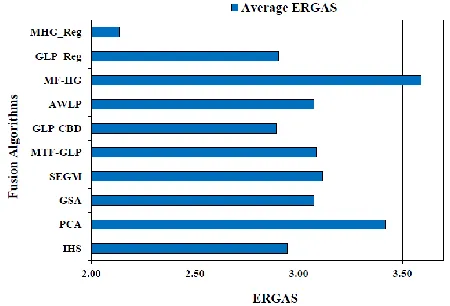
Along with RMSE, we calculate ERGAS which is again an error value and its comparison with respect to average values is plotted in Fig. 5. Here also, the potential of proposed algorithm MHG-Reg is proved. It has achieved the most lowest value of ERGAS than all other algorithms. The performance of other algorithms is improved in the order MF-HG, PCA, SEGM, MTF-GLP, AWLP, GSA, IHS, GLP-Reg and MTF-GLP-CBD considering ERGAS measurement.
Fig. 5. Comparative measurement of average ERGAS against all the image fusion algorithms.
SCC computes percentage of spatial details injected to final resultant images. A comparison of average SCC values is plotted in Fig. 6. On comparison, MHG-Reg is successful to compute the highest value of SCC index. IHS stands with the second most desired SCC value and MTF-GLP-CBD stands at the third place. The performance of GLP-Reg is very competitive to that of MTF-GLP-CBD. Here, AWLP lags the most in injecting more spatial details to corresponding fused image.
Fig. 6. Comparative measurement of average SCC against all the image fusion algorithms.
Quality content among the fused images can also be measured in terms of Q4 index. Average Q4 index is plotted against image fusion algorithms and the plot is shown in Fig. 7. Here also, MHG-Reg is proved to compute the best value for Q4 index. Comparatively, IHS and PCA respectively stand at the last to maintain quality content in terms of Q4. Using the high-resolution evaluation procedure, we have obtained
D
,S
Fig. 7. Comparative measurement of average Q4 against all the image fusion algorithms.
Fig. 8. Comparative measurement of average
D
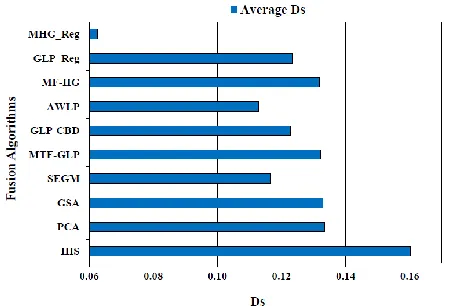
against all the image fusion algorithms.Fig. 9. Comparative measurement of average
D
S against all the image fusion algorithms.Undoubtedly, the proposed image fusion using MHG-Reg is successful to have the least spatial distortion in resultant fused image. Whereas, the SEGM is proved to be more superior than MHG-Reg in reducing spectral distortion. MHG-Reg stands with the second most desired value of
D
index.Fig. 10. Comparative measurement of average QNR against all the image fusion algorithms.
Fig. 11. Comparative measurement of average SAM against all the image fusion algorithms.
Fig. 12. Comparative measurement of average execution time against all the image fusion algorithms.
148 quality seems to degrade in the order SEGM, AWLP,
GLP-CBD, GLP-Reg, GSA, PCA, MTF-GLP, MF-HG, IHS. The desired SAM index is ideally zero. Measurements of average SAM are compared in Fig. 11. The comparison shows MHG-Reg outwitting the performances of all others. Here, it is also noticed that GLP-Reg and MTF-GLP have very similar performance next to it. The spectral distortion in terms of SAM increases in the order GLP-CBD, AWLP, MF-HG, SEGM, GSA, IHS, PCA. Finally, a comparison of average time taken by image fusion algorithms to generate high resolution resultant image is plotted in Fig. 12. IHS being simplest in structure, has resulted with very fast fusion result. PCA and SEGM have also achieved fast image fusion next to IHS. MHG-Reg though requires more time for image fusion results than produced by MF-HG, GSA, GLP-Reg, MTF-GLP-CBD and MTF-GLP, it has more economical computational complexity than that of AWLP.
4.2 Subjective Analysis
The variations in values corresponding to quality- and error-metrics analyzed in previous subsection underline the suitability of metrics to image fusion algorithms still being an open research problem. Also, user is the ultimate judge of results at end use. Hence, a visual inspection of resultant images is necessary. It is observed that PCA results in the most distortion in fused images. Upon considering the overall spectral-spatial distortions along with clear distinction of objects, it is noted that visualization of MHG-Reg fused image is optimal among other resultant images.
5 CONCLUSION
Use of morphological half-gradient and high-resolution scale regression approach for producing efficient image fusion is attempted in this paper. The successful demonstration of the proposed MHG-Reg image fusion algorithm is made while compared to the nine other most recent image fusion algorithms from CS and MRA approaches. Two real datasets from Deimos-2 and IKONOS are utilized for the experimentation. The objective analysis along with subjective analysis i.e. visual inspection helped the wide comparison. The MHG-Reg has resulted with overall the most desired values of quality metrics involved in evaluation techniques. The MHG-Reg seems more successful to lower the spatial distortion than the spectral distortion. Also, the MHG-Reg is found computationally complex than eight other image fusion algorithms except AWLP. The development of more efficient image fusion algorithm along with possibly lower computational complexity is still an open research problem.
REFERENCES
[1] R. Lasaponara and N. Masini, Eds., Satellite Remote Sensing. Springer, 2012.
[2] B. Escalante-Ram´ırez, Ed., Remote Sensing – Applications. Janeza Trdine 9, 51000 Rijeka, Croatia: InTech, 2012.
[3] T. Wang, F. Fang, F. Li, and G. Zhang, ―High quality bayesian pansharpening,‖ IEEE Trans. Image Process., vol. 28, no. 1, pp. 227–239, Jan. 2019.
[4] H. Wu, S. Zhao, J. Zhang, and C. Lu, ―Remote sensing image sharpening by integrating multispectral image super-resolution and convolutional sparse representation fusion,‖ IEEE Access, vol. 7, pp. 46 562–46 574, 2019.
[5] K. Zhang, M. Wang, S. Yang, and L. Jiao, ―Convolution structure sparse coding for fusion of panchromatic and multispectral images,‖ IEEE Trans. Geosci. Remote Sens., vol. 57, no. 02, pp. 1117–1130, Feb. 2019.
[6] X. Wang, S. Bai, Z. Li, R. Song, and J. Tao, ―The PAN and MS image pansharpening algorithm based on adaptive neural network and sparse representation in the NSST domain,‖ IEEE Access, vol. 7, pp. 2169–3536, 2019.
[7] V. R. Pandit and R. J. Bhiwani, ―Image fusion in remote sensing applications: A review,‖ Int. J. Comput. Appl., vol. 120, no. 10, pp. 22–32, Jun. 2015.
[8] G. Vivone et al., ―A critical comparison among pansharpening algorithms,‖ IEEE Trans. Geosci. Remote Sens., vol. 53, no. 5, pp. 2565–2586, May 2015.
[9] C. Thomas, T. Ranchin, L. Wald, and J. Chanussot, ―Synthesis of multispectral images to high spatial resolution: A critical review of fusion methods based on remote sensing physics,‖ IEEE Trans. Geosci. Remote Sens., vol. 46, no. 5, pp. 1301– 1312, May 2008.
[10]V. R. Pandit and R. J. Bhiwani, ―Component substitution based fusion of WorldView imagery,‖ in Proc. IEEE The 10th Int. Conf. Comput., Commun. Netw. Technol. (ICCCNT), IIT, Kanpur, India, Jul. 2019.
[11]V. R. Pandit and R. J. Bhiwani, ―Fusion of QuickBird imagery using multi-resolution analysis based algorithms,‖ in Proc. IEEE 4th Int. Conf. Commun. Electron. Syst. (ICCES), Coimbatore, India, Jul. 2019.
[12]L. Wald, ―Some terms of reference in data fusion,‖ IEEE Trans. Geosci. Remote Sens., vol. 37, no. 3, pp. 1190–1193, May 1999.
[13]R. Restaino, G. Vivone, M. D. Mura, and J. Chanussot, ―Fusion of multispectral and panchromatic images based on morphological operators,‖ IEEE Trans. Image Process., vol. 25, no. 6, pp. 2882–2895, Jun. 2016.
[14]G. Vivone, R. Restaino, and J. Chanussot, ―Full scale regression-based injection coefficients for panchromatic sharpening,‖ IEEE Trans. Image Process., vol. 27, no. 7, pp. 3418–3431, Jul. 2018.
[15]B. Aiazzi, L. Alparone, S. Baronti, and A. Garzelli, ―Context-driven fusion of high spatial and spectral resolution images based on oversampled multiresolution analysis,‖ IEEE Trans. Geosci. Remote Sens., vol. 40, no. 10, pp. 2300–2312, Oct. 2002.
[16]B. Aiazzi, L. Alparone, S. Baronti, A. Garzelli, and M. Selva, ―MTF tailored multiscale fusion of high-resolution MS and Pan imagery,‖ Photogramm. Eng. Remote Sens., vol. 72, no. 5, pp. 591–596, May 2006.
[17]M. C. El-Mezouar, N. Taleb, K. Kpalma, and J. Ronsin, ―An IHS based fusion for color distortion reduction and vegetation enhancement in IKONOS imagery,‖ IEEE Trans. Geosci. Remote Sens., vol. 49, no. 5, pp. 5090–1602, May 2011. [18]V. P. Shah, N. H. Younan, and R. L. King, ―An efficient
pan-sharpening method via a combined adaptive PCA approach and contourlets,‖ IEEE Trans. Geosci. Remote Sens., vol. 46, no. 5, pp. 1323–1335, May 2008.
[19]B. Aiazzi, S. Baronti, and M. Selva, ―Improving component substitution pansharpening through multivariate regression of MS+Pan data,‖ IEEE Trans. Geosci. Remote Sens., vol. 45, no. 10, pp. 3230–3239, Oct. 2007.
[21]R. Restaino, M. D. Mura, G. Vivone, and J. Chanussot, ―Context adaptive pansharpening based on image segmentation,‖ IEEE Trans. Geosci. Remote Sens., vol. 55, no. 2, pp. 753–766, Feb. 2017.
[22]X. Otazu, M. Gonz´alez-Aud´ıcana, O. Fors, and J. N´u˜nez, ―Introduction of sensor spectral response into image fusion methods. application to wavelet-based methods,‖ IEEE Trans. Geosci. Remote Sens., vol. 43, no. 10, pp. 2376–2385, Oct. 2005.
[23]V. R. Pandit and R. J. Bhiwani, ―Fusion of remote sensing imagery using morphological gradient,‖ in Proc. IEEE 5th Int. Conf. Comput. Commun. Control Autom. (ICCUBEA), Pune, India, Sep. 2019.
[24](2019, May). [Online]. Available:
https://apollomapping.com/downloadfree-poster
[25]S. Li and B. Yang, ―A new pan-sharpening method using a compressed sensing technique,‖ IEEE Trans. Geosci. Remote Sens., vol. 49, no. 2, pp. 738–746, Feb. 2011.
[26]F. Palsson, J. R. Sveinsson, M. O. Ulfarsson, and J. A. Benediktsson, ―Quantitative quality evaluation of pansharpened imagery: Consistency versus synthesis,‖ IEEE Trans. Geosci. Remote Sens., vol. 54, no. 3, pp. 1247–1259, Mar. 2016.
[27]L. He et al., ―Pansharpening via detail injection based convolutional neural networks,‖ IEEE J. Sel. Topics Appl. Earth Observ., vol. 12, no. 4, pp. 1188–1204, Apr. 2019.